Metals Acquisition Limited Reports Drill Results Including 19.2m @ 10.4% Cu, 16.0m @ 10.4% Cu and 3m @ 13.9% Cu
ST. HELIER, Jersey--(BUSINESS WIRE)-- Metals Acquisition Limited (NYSE: MTAL) (ASX:MAC):
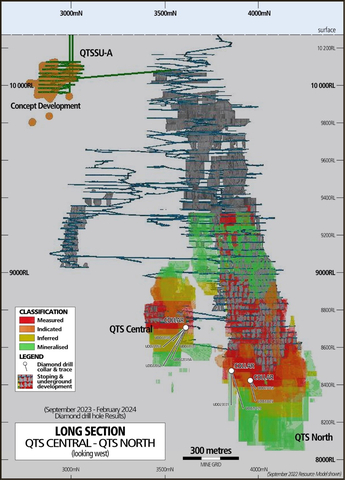
Figure 1 – CSA Copper Mine Long Section (Graphic: Business Wire)
Metals Acquisition Limited (“MAC” or the “Company”) today provides a market update on the continuing exploration and resource development at the CSA Copper Mine:
Highlights
- The 2023 Resource and Reserve estimate is scheduled for release in Q2 2024
- All results reported in this release are after the cut-off date (August 31, 2023) for the 2023 Resource and Reserve and will be incorporated in the subsequent Resource and Reserve Estimate update.
-
Results from QTS North (“QTSN”) include:
-
14m @
7.9% Cu from 159m in UDD20139 -
16m @
10.4% Cu from 102m in UDD23024 -
19.2m @
10.4% Cu from 114.8m in UDD23025
-
14m @
-
Results from QTS Central (“QTSC”) include:
-
11.5m @
11.8% Cu from 180.5m in UDD22052 -
6.9m @
11.3% Cu from 114.5m in UDD22040 -
25.6m @
6.1% Cu from 152.4m in UDD22049A -
14.5m @
9.0% Cu from 146.5m in UDD22054
-
11.5m @
-
Results from the near surface QTS South Upper A (“QTSSUA”) include:
-
1.7m @
21.3% Cu from 281.2m in QSDD057C -
3.0m @
13.9% Cu from 268.7m in QSDD059 -
4.3m @
14.2% Zn,3.9% Pb and0.8% Cu from 294.4m in QSDD060
-
1.7m @
Discussion
MAC has continued drilling since acquiring the CSA Copper Mine in June 2023 with a view to expand it’s high quality resource base to underpin a new reserve estimate and mine plan. Due to the lead time required to complete a full reserve estimate and mine plan the data cut off for the 2023 Resource and Reserve Statement is August 31,2023. All results reported in this release are after that cut off.
Results are reported as down hole widths. A complete list of post-August 2023 resource drilling is contained in Table 1 at the end of this report.
MAC CEO, Mick McMullen commented “These results continue to showcase why we think the CSA Copper Mine has a long future with continued exploration success converting the Inferred Resource to Measured and Indicated, together with adding new mineralisation to the inventory. QTS North continues to demonstrate good continuity at depth with what is in line with observed CSA Copper Mine widths and grades such as the 19.2m @
QTS Central appears to be getting wider with the new drilling which is very encouraging from what is already our highest margin ore. The shallow high-grade results from QTS South Upper A are very encouraging and work is underway in incorporating this into a resource estimate for mine planning purposes. The presence of a high-grade Zn lens in this area is interesting and drilling is underway on the shallow potions of the nearby East and West lodes to determine what mineralisation may not have been mined historically.
Following the recent
CSA Copper Mine
The CSA Copper Mine is a world class mine that consists of a series of mineralized lenses that extend from surface to a depth of over 2.3km. The main deposits are QTSN, QTSC, QTSS, East and West lenses with additional mineralisation in the near surface QTSS Upper A zone. Approximately
The resource model for QTSN commences approximately 850m below surface, with all data above that in hard copy and not in the digital database. Work is underway to digitize and validate this data and will be incorporated into a future resource update. Based on the initial information it would appear that there are reasonable prospects for additional mineralisation in the top 850m of the mine.
Refer to Figure 1 below for the location of the various deposits.
Exploration Results
Figure 1 – CSA Copper Mine Long Section
Drilling has been targeting conversion of Inferred resource to Measured and Indicated for inclusion in the Reserve Estimate, as well as the known mineralized lenses to add incremental resources.
The location of the significant drill results is shown in Figure 2 below.
Figure 2 – QTSN and QTSC Long Section
At QTSN, the most recent drilling has confirmed the location of the Inferred Resource and enabled it to be upgraded as well as confirmation of the smaller mineralized lenses adjacent to the existing resource. This can be seen in Figure 3. QTSN is characterised by a series of high-grade lenses (grading plus
As drilling has progressed down dip it would appear that tonnes per vertical metre are increasing.
Figure 3 – QTSN Cross Section
QTSC is located adjacent to QTSN and is centred around a depth of 1.4km and is open both up and down dip. QTSC is typically narrower than QTSN but higher grade. As seen in Figure 4 the most recent drilling continues to confirm the presence of the high-grade mineralisation below the current working level through the Inferred Resource and into mineralised material that will extend the resource beyond its current limits.
Figure 4 – QTSC Cross Section
QTSS Upper A is a narrow (1.5 to 3m) but a high-grade zone of mineralisation that is much shallower than the rest of the mine. This lens starts approximately 120m below surface and extends to approximately 350m below surface. Drilling from surface was targeting upgrading the confidence level of the mineralization to allow inclusion in the new 2023 Resource and Reserves Estimate and for mine planning purposes.
This lens is narrower than the average QTSN and QTSC lenses but share a higher grade with QTS Central. In a mine known for high grade copper material the QTSS Upper A lens stands out based on intercepted grades of 1.7m @
Of note also is the intercepted 4.3m @
Competent and Qualified Person Statement(s)
The information in this announcement that relates to Exploration Results at the CSA Copper Mine is based on information compiled or reviewed by Patrick Adams, a Competent Person who is a Fellow of the Australian Institute of Mining and Metallurgy. Mr. Adams is employed by Cube Consulting Pty Ltd. Mr. Adams has sufficient experience which is relevant to the style of mineralisation and type of deposit under consideration and to the activity being undertaken to qualify as a Competent Person as defined in the JORC Code. Mr. Adams has given (and not withdrawn) written consent to the inclusion in the report of the results reported here and the form and context in which it appears. Mr. Adams is also a Qualified Person as defined by S-K 1300 rules for mineral deposit disclosure. Mr. Adams further consents as Qualified Person to the inclusion in the report of the matters based on information in the form and context in which it appears.
This announcement is authorised for release by Mick McMullen, Chief Executive Officer and Director.
About Metals Acquisition Limited
Metals Acquisition Limited (NYSE: MTAL; ASX:MAC) is a company focused on operating and acquiring metals and mining businesses in high quality, stable jurisdictions that are critical in the electrification and decarbonization of the global economy.
Cautionary and Forward Looking Statements
This press release has been prepared by Metals Acquisition Limited (“Company” or “MAC”), has been prepared in compliance with the JORC Code 2012 Edition and includes “forward-looking statements.” The ‘forward-looking information’ is based on the Company’s expectations, estimates and projections as of the date on which the statements were made.
MAC’s actual results may differ from expectations, estimates, and projections and, consequently, you should not rely on these forward-looking statements as predictions of future events. Words such as “expect,” “estimate,” “project,” “budget,” “forecast,” “anticipate,” “intend,” “plan,” “may,” “will,” “could,” “should,” “believes,” “predicts,” “potential,” “continue,” and similar expressions (or the negative versions of such words or expressions) are intended to identify such forward- looking statements. These forward-looking statements include, without limitation, MAC’s expectations with respect to future performance of the CSA Copper Mine and anticipated financial impacts and other effects of the proposed business combination, the satisfaction of the closing conditions to the proposed transaction and the timing of the completion of the proposed transaction. These forward-looking statements involve significant risks and uncertainties that could cause the actual results to differ materially from those discussed in the forward-looking statements. Most of these factors are outside MAC’s control and are difficult to predict. Factors that may cause such differences include, but are not limited to: the ability to recognize the anticipated benefits of the business combination, which may be affected by, among other things; the supply and demand for copper; the future price of copper; the timing and amount of estimated future production, costs of production, capital expenditures and requirements for additional capital; cash flow provided by operating activities; unanticipated reclamation expenses; claims and limitations on insurance coverage; the uncertainty in mineral resource estimates; the uncertainty in geological, metallurgical and geotechnical studies and opinions; infrastructure risks; and dependence on key management personnel and executive officers; and other risks and uncertainties indicated from time to time in the definitive proxy statement/prospectus relating to the business combination that MAC filed with the SEC, including those under “Risk Factors” therein, and in MAC’s other filings with the SEC. MAC cautions that the foregoing list of factors is not exclusive. MAC cautions readers not to place undue reliance upon any forward-looking statements, which speak only as of the date made. MAC does not undertake or accept any obligation or undertaking to release publicly any updates or revisions to any forward-looking statements to reflect any change in its expectations or any change in events, conditions, or circumstances on which any such statement is based.
More information on potential factors that could affect MAC’s or CSA Copper Mine’s financial results is included from time to time in MAC’s public reports filed with the SEC. If any of these risks materialize or MAC’s assumptions prove incorrect, actual results could differ materially from the results implied by these forward-looking statements. There may be additional risks that MAC does not presently know, or that MAC currently believes are immaterial, that could also cause actual results to differ from those contained in the forward-looking statements. In addition, forward-looking statements reflect MAC’s expectations, plans or forecasts of future events and views as of the date of this communication. MAC anticipates that subsequent events and developments will cause its assessments to change. However, while MAC may elect to update these forward-looking statements at some point in the future, MAC specifically disclaims any obligation to do so, except as required by law. These forward- looking statements should not be relied upon as representing MAC’s assessment as of any date subsequent to the date of this communication. Accordingly, undue reliance should not be placed upon the forward-looking statements.
Table 1 – Significant Drill Results QTSN, QTSC and QTSS Upper
Hole |
East
|
North
|
RL.
|
EOH |
Azimuth |
Dip |
From |
To |
Length |
Cu % |
Ag g/t |
System |
UDD20139 |
5873.06 |
3864.05 |
8474.16 |
310.0 |
74.0 |
-49.0 |
47.6 |
52.5 |
4.9 |
3.4 |
19.2 |
QTS North |
74.0 |
77.0 |
3.0 |
3.4 |
14.3 |
QTS North |
|||||||
82.0 |
86.0 |
4.0 |
4.1 |
25.0 |
QTS North |
|||||||
159.0 |
173.0 |
14.0 |
7.9 |
40.4 |
QTS North |
|||||||
UDD20142 |
5873.07 |
3863.36 |
8474.09 |
360.0 |
91.5 |
-50.0 |
89.1 |
98.9 |
9.8 |
3.8 |
25.0 |
QTS North |
UDD22113 |
5845.08 |
4217.82 |
8515.13 |
380.5 |
57.0 |
-35.0 |
274.3 |
277.4 |
3.1 |
4.1 |
126.2 |
QTS North |
UDD23001 |
5873.25 |
3862.57 |
8474.70 |
330.0 |
108.9 |
-37.1 |
115.0 |
119.0 |
4.0 |
3.7 |
14.0 |
QTS North |
UDD23002 |
5873.27 |
3862.43 |
8474.25 |
250.0 |
110.7 |
-47.4 |
124.6 |
129.2 |
4.6 |
3.7 |
18.5 |
QTS North |
UDD23005 |
5873.09 |
3862.29 |
8474.16 |
239.0 |
115.6 |
-36.0 |
111.3 |
118.6 |
7.3 |
3.0 |
19.2 |
QTS North |
UDD23006 |
5873.29 |
3862.18 |
8474.25 |
276.1 |
116.4 |
-44.5 |
91.8 |
94.8 |
3.0 |
3.7 |
0.0 |
QTS North |
UDD23012 |
5872.74 |
3862.43 |
8474.11 |
332.0 |
117.2 |
-57.6 |
25.3 |
28.3 |
3.0 |
3.3 |
16.0 |
QTS North |
117.6 |
124.0 |
6.4 |
5.4 |
29.5 |
QTS North |
|||||||
202.7 |
206.0 |
3.3 |
4.4 |
0.0 |
QTS North |
|||||||
UDD23004 |
5873.10 |
3863.80 |
8474.16 |
294.5 |
79.5 |
-46.5 |
75.7 |
79.0 |
3.3 |
2.9 |
0.0 |
QTS North |
84.5 |
93.2 |
8.7 |
3.7 |
19.8 |
QTS North |
|||||||
UDD23010 |
5872.93 |
3861.10 |
8474.13 |
282.0 |
122.3 |
-43.6 |
83.0 |
87.5 |
4.5 |
3.0 |
17.0 |
QTS North |
100.8 |
105.2 |
4.4 |
2.9 |
20.5 |
QTS North |
|||||||
125.0 |
129.0 |
4.0 |
3.1 |
15.3 |
QTS North |
|||||||
155.1 |
159.7 |
4.6 |
5.8 |
39.5 |
QTS North |
|||||||
UDD23014A |
5903.21 |
3961.92 |
8417.48 |
126.0 |
120.0 |
-65.5 |
51.4 |
56.8 |
5.4 |
2.6 |
12.0 |
QTS North |
UDD23024 |
5904.02 |
3963.50 |
8418.80 |
180.0 |
78.0 |
-15.5 |
76.3 |
80.4 |
4.1 |
6.9 |
24.9 |
QTS North |
102.0 |
118.0 |
16.0 |
10.4 |
38.6 |
QTS North |
|||||||
UDD23029 |
5873.24 |
3862.88 |
8474.70 |
225.0 |
101.5 |
-31.0 |
77.8 |
80.9 |
3.1 |
6.0 |
26.7 |
QTS North |
UDD20144 |
5873.32 |
3862.20 |
8474.16 |
400.0 |
116.5 |
-47.0 |
87.5 |
91.5 |
4.0 |
3.5 |
0.0 |
QTS North |
102.4 |
107.0 |
4.6 |
6.7 |
30.9 |
QTS North |
|||||||
128.8 |
133.8 |
5.0 |
4.5 |
17.6 |
QTS North |
|||||||
161.5 |
166.4 |
4.9 |
7.5 |
34.7 |
QTS North |
|||||||
UDD21096 |
5843.38 |
4211.32 |
8514.51 |
190.0 |
89.0 |
-7.5 |
169.7 |
176.2 |
6.5 |
5.7 |
30.0 |
QTS North |
UDD22124 |
5843.99 |
4216.46 |
8513.45 |
460.7 |
46.0 |
-42.0 |
313.4 |
319.2 |
5.8 |
3.2 |
6.3 |
QTS North |
UDD22125 |
5844.10 |
4216.17 |
8513.48 |
440.0 |
52.6 |
-44.5 |
310.9 |
314.3 |
3.4 |
8.7 |
27.6 |
QTS North |
UDD22131 |
5844.12 |
4218.35 |
8513.69 |
510.9 |
32.5 |
-20.0 |
358.8 |
363.0 |
4.2 |
4.2 |
8.5 |
QTS North |
UDD23003 |
5873.26 |
3862.81 |
8474.29 |
390.4 |
102.6 |
-47.2 |
95.1 |
101.3 |
6.2 |
3.2 |
0.0 |
QTS North |
152.5 |
155.6 |
3.1 |
3.3 |
17.0 |
QTS North |
|||||||
UDD23007 |
5873.21 |
3861.87 |
8474.26 |
259.8 |
121.5 |
-35.3 |
120.0 |
125.7 |
5.7 |
3.3 |
17.0 |
QTS North |
135.9 |
139.7 |
3.8 |
2.8 |
14.7 |
QTS North |
|||||||
146.0 |
149.9 |
3.9 |
4.0 |
21.7 |
QTS North |
|||||||
UDD23025 |
5903.75 |
3963.52 |
8418.14 |
218.3 |
79.0 |
-37.0 |
64.1 |
67.9 |
3.8 |
7.5 |
0.0 |
QTS North |
72.0 |
78.0 |
6.0 |
3.7 |
0.0 |
QTS North |
|||||||
82.1 |
89.1 |
7.0 |
4.4 |
0.0 |
QTS North |
|||||||
114.8 |
134.0 |
19.2 |
10.4 |
31.7 |
QTS North |
|||||||
UDD23030 |
5873.25 |
3863.42 |
8474.89 |
260.0 |
92.5 |
-33.0 |
189.8 |
195.0 |
5.2 |
3.6 |
0.0 |
QTS North |
UDD23031 |
5872.95 |
3863.21 |
8474.10 |
295.0 |
94.0 |
-53.0 |
82.6 |
96.1 |
13.5 |
4.6 |
22.2 |
QTS North |
UDD22041 |
6055.77 |
3624.71 |
8702.39 |
165.6 |
96.0 |
-47.3 |
98.0 |
106.7 |
8.7 |
3.0 |
5.9 |
QTS Central |
UDD22043 |
6056.02 |
3624.32 |
8702.36 |
162.5 |
103.8 |
-46.3 |
99.9 |
108.4 |
8.5 |
4.2 |
11.5 |
QTS Central |
116.2 |
119.6 |
3.4 |
7.2 |
0.0 |
QTS Central |
|||||||
UDD22044 |
6055.69 |
3624.18 |
8702.44 |
181.8 |
109.3 |
-51.7 |
107.9 |
111.9 |
4.0 |
4.7 |
8.4 |
QTS Central |
117.0 |
121.1 |
4.1 |
4.0 |
23.5 |
QTS Central |
|||||||
UDD22047 |
6055.45 |
3624.21 |
8702.38 |
200.0 |
108.6 |
-57.5 |
133.0 |
150.0 |
17.0 |
4.7 |
0.0 |
QTS Central |
UDD22051 |
6054.00 |
3626.20 |
8703.20 |
225.0 |
134.7 |
-52.6 |
153.3 |
159.1 |
5.8 |
4.4 |
4.4 |
QTS Central |
UDD22052 |
6054.81 |
3623.19 |
8702.41 |
266.4 |
139.6 |
-55.6 |
180.5 |
192.0 |
11.5 |
11.8 |
38.9 |
QTS Central |
UDD22042 |
6055.67 |
3624.09 |
8702.46 |
185.0 |
94.6 |
-53.4 |
116.5 |
121.2 |
4.7 |
4.6 |
0.0 |
QTS Central |
128.5 |
140.0 |
11.5 |
4.5 |
16.0 |
QTS Central |
|||||||
UDD22045 |
6055.50 |
3624.09 |
8702.39 |
200.0 |
95.4 |
-58.6 |
151.0 |
156.1 |
5.1 |
3.5 |
6.5 |
QTS Central |
UDD22048 |
6055.33 |
3624.16 |
8702.39 |
213.0 |
109.6 |
-60.3 |
160.2 |
165.4 |
5.2 |
4.4 |
9.7 |
QTS Central |
UDD22053 |
6055.21 |
3623.07 |
8702.40 |
213.0 |
135.2 |
-46.8 |
143.9 |
149.3 |
5.4 |
5.1 |
0.0 |
QTS Central |
151.5 |
158.5 |
7.0 |
4.5 |
8.3 |
QTS Central |
|||||||
UDD22023 |
6056.73 |
3623.30 |
8702.41 |
162.0 |
115.0 |
-32.4 |
93.9 |
102.2 |
8.3 |
5.6 |
27.6 |
QTS Central |
110.9 |
115.5 |
4.6 |
4.8 |
10.0 |
QTS Central |
|||||||
UDD22039 |
6056.26 |
3623.81 |
8702.49 |
160.0 |
111.0 |
-40.3 |
98.0 |
109.7 |
11.7 |
4.8 |
7.9 |
QTS Central |
UDD22040 |
6055.79 |
3623.32 |
8702.47 |
160.5 |
124.0 |
-37.5 |
95.3 |
99.5 |
4.2 |
4.0 |
0.0 |
QTS Central |
102.8 |
109.0 |
6.2 |
7.5 |
0.0 |
QTS Central |
|||||||
114.5 |
121.4 |
6.9 |
11.3 |
28.3 |
QTS Central |
|||||||
UDD22049A |
6054.00 |
3626.20 |
8703.20 |
222.8 |
125.7 |
-58.4 |
152.4 |
178.0 |
25.6 |
6.1 |
21.7 |
QTS Central |
UDD22054 |
6055.32 |
3622.80 |
8702.47 |
196.4 |
137.4 |
-39.6 |
136.6 |
143.0 |
6.4 |
5.1 |
17.7 |
QTS Central |
146.5 |
161.0 |
14.5 |
9.0 |
26.6 |
QTS Central |
|||||||
QSDD056 |
6440.22 |
2988.00 |
10258.06 |
321.4 |
268.6 |
-57.2 |
268.4 |
269.2 |
0.8 |
3.5 |
10.0 |
QTSS Upper A |
QSDD057C |
6438.24 |
2959.60 |
10257.83 |
301.2 |
266.8 |
-59.9 |
281.2 |
282.9 |
1.7 |
21.3 |
72.3 |
QTSS Upper A |
QSDD059 |
6433.27 |
2900.58 |
10257.56 |
294.5 |
272.1 |
-57.0 |
268.7 |
271.6 |
3.0 |
13.9 |
43.3 |
QTSS Upper A |
QSDD060 |
6437.03 |
2841.27 |
10257.29 |
320.1 |
270.1 |
-59.0 |
293.1 |
293.6 |
0.5 |
9.1 |
90.0 |
QTSS Upper A |
Hole |
From |
To |
Length |
Cu % |
Ag g/t |
Pb % |
Zn % |
System |
QSDD060 |
294.40 |
298.70 |
4.3 |
0.8 |
27.7 |
3.9 |
14.2 |
QTSS Upper A |
APPENDIX 1
JORC Code, 2012 Edition – Table 1: CSA Mineral Resource, February 2024
Section 1 Sampling Techniques and Data
(Criteria in this section apply to all succeeding sections.)
Criteria |
JORC Code explanation |
Commentary |
Sampling techniques |
|
|
Drilling techniques |
|
|
Drill sample recovery |
|
|
Logging |
|
|
Sub-sampling techniques and sample preparation |
|
|
Quality of assay data and laboratory tests |
|
|
Verification of sampling and assaying |
|
|
Location of data points |
|
|
Data spacing and distribution |
|
|
Orientation of data in relation to geological structure |
|
|
Sample security |
|
|
Audits or reviews |
|
|
Section 2 Reporting of Exploration Results
(Criteria listed in the preceding section also apply to this section.)
Criteria |
JORC Code explanation |
Commentary |
Mineral tenement and land tenure status |
|
|
Exploration done by other parties |
|
|
Geology |
|
|
Drill hole Information |
|
|
Borehole Intersections - Sep 1st 2023 to Feb 29th 2024 |
||||||||||||
Hole |
East (MG) |
North (MG) |
RL. (MG) |
EOH |
Azimuth |
Dip |
From |
To |
Length |
Cu % |
Ag g/t |
System |
UDD20139 |
5873.06 |
3864.05 |
8474.16 |
310.0 |
74.0 |
-49.0 |
47.6 |
52.5 |
4.9 |
3.4 |
19.2 |
QTS North |
74.0 |
77.0 |
3.0 |
3.4 |
14.3 |
QTS North |
|||||||
82.0 |
86.0 |
4.0 |
4.1 |
25.0 |
QTS North |
|||||||
159.0 |
173.0 |
14.0 |
7.9 |
40.4 |
QTS North |
|||||||
UDD20142 |
5873.07 |
3863.36 |
8474.09 |
360.0 |
91.5 |
-50.0 |
89.1 |
98.9 |
9.8 |
3.8 |
25.0 |
QTS North |
UDD22113 |
5845.08 |
4217.82 |
8515.13 |
380.5 |
57.0 |
-35.0 |
274.3 |
277.4 |
3.1 |
4.1 |
126.2 |
QTS North |
UDD23001 |
5873.25 |
3862.57 |
8474.70 |
330.0 |
108.9 |
-37.1 |
115.0 |
119.0 |
4.0 |
3.7 |
14.0 |
QTS North |
UDD23002 |
5873.27 |
3862.43 |
8474.25 |
250.0 |
110.7 |
-47.4 |
124.6 |
129.2 |
4.6 |
3.7 |
18.5 |
QTS North |
UDD23005 |
5873.09 |
3862.29 |
8474.16 |
239.0 |
115.6 |
-36.0 |
111.3 |
118.6 |
7.3 |
3.0 |
19.2 |
QTS North |
UDD23006 |
5873.29 |
3862.18 |
8474.25 |
276.1 |
116.4 |
-44.5 |
91.8 |
94.8 |
3.0 |
3.7 |
0.0 |
QTS North |
UDD23012 |
5872.74 |
3862.43 |
8474.11 |
332.0 |
117.2 |
-57.6 |
25.3 |
28.3 |
3.0 |
3.3 |
16.0 |
QTS North |
117.6 |
124.0 |
6.4 |
5.4 |
29.5 |
QTS North |
|||||||
202.7 |
206.0 |
3.3 |
4.4 |
0.0 |
QTS North |
|||||||
UDD23004 |
5873.10 |
3863.80 |
8474.16 |
294.5 |
79.5 |
-46.5 |
75.7 |
79.0 |
3.3 |
2.9 |
0.0 |
QTS North |
84.5 |
93.2 |
8.7 |
3.7 |
19.8 |
QTS North |
|||||||
UDD23010 |
5872.93 |
3861.10 |
8474.13 |
282.0 |
122.3 |
-43.6 |
83.0 |
87.5 |
4.5 |
3.0 |
17.0 |
QTS North |
100.8 |
105.2 |
4.4 |
2.9 |
20.5 |
QTS North |
|||||||
125.0 |
129.0 |
4.0 |
3.1 |
15.3 |
QTS North |
|||||||
155.1 |
159.7 |
4.6 |
5.8 |
39.5 |
QTS North |
|||||||
UDD23014A |
5903.21 |
3961.92 |
8417.48 |
126.0 |
120.0 |
-65.5 |
51.4 |
56.8 |
5.4 |
2.6 |
12.0 |
QTS North |
UDD23024 |
5904.02 |
3963.50 |
8418.80 |
180.0 |
78.0 |
-15.5 |
76.3 |
80.4 |
4.1 |
6.9 |
24.9 |
QTS North |
102.0 |
118.0 |
16.0 |
10.4 |
38.6 |
QTS North |
|||||||
UDD23029 |
5873.24 |
3862.88 |
8474.70 |
225.0 |
101.5 |
-31.0 |
77.8 |
80.9 |
3.1 |
6.0 |
26.7 |
QTS North |
UDD20144 |
5873.32 |
3862.20 |
8474.16 |
400.0 |
116.5 |
-47.0 |
87.5 |
91.5 |
4.0 |
3.5 |
0.0 |
QTS North |
102.4 |
107.0 |
4.6 |
6.7 |
30.9 |
QTS North |
|||||||
128.8 |
133.8 |
5.0 |
4.5 |
17.6 |
QTS North |
|||||||
161.5 |
166.4 |
4.9 |
7.5 |
34.7 |
QTS North |
|||||||
UDD21096 |
5843.38 |
4211.32 |
8514.51 |
190.0 |
89.0 |
-7.5 |
169.7 |
176.2 |
6.5 |
5.7 |
30.0 |
QTS North |
UDD22124 |
5843.99 |
4216.46 |
8513.45 |
460.7 |
46.0 |
-42.0 |
313.4 |
319.2 |
5.8 |
3.2 |
6.3 |
QTS North |
UDD22125 |
5844.10 |
4216.17 |
8513.48 |
440.0 |
52.6 |
-44.5 |
310.9 |
314.3 |
3.4 |
8.7 |
27.6 |
QTS North |
UDD22131 |
5844.12 |
4218.35 |
8513.69 |
510.9 |
32.5 |
-20.0 |
358.8 |
363.0 |
4.2 |
4.2 |
8.5 |
QTS North |
UDD23003 |
5873.26 |
3862.81 |
8474.29 |
390.4 |
102.6 |
-47.2 |
95.1 |
101.3 |
6.2 |
3.2 |
0.0 |
QTS North |
152.5 |
155.6 |
3.1 |
3.3 |
17.0 |
QTS North |
|||||||
UDD23007 |
5873.21 |
3861.87 |
8474.26 |
259.8 |
121.5 |
-35.3 |
120.0 |
125.7 |
5.7 |
3.3 |
17.0 |
QTS North |
135.9 |
139.7 |
3.8 |
2.8 |
14.7 |
QTS North |
|||||||
146.0 |
149.9 |
3.9 |
4.0 |
21.7 |
QTS North |
|||||||
UDD23025 |
5903.75 |
3963.52 |
8418.14 |
218.3 |
79.0 |
-37.0 |
64.1 |
67.9 |
3.8 |
7.5 |
0.0 |
QTS North |
72.0 |
78.0 |
6.0 |
3.7 |
0.0 |
QTS North |
|||||||
82.1 |
89.1 |
7.0 |
4.4 |
0.0 |
QTS North |
|||||||
114.8 |
134.0 |
19.2 |
10.4 |
31.7 |
QTS North |
|||||||
UDD23030 |
5873.25 |
3863.42 |
8474.89 |
260.0 |
92.5 |
-33.0 |
189.8 |
195.0 |
5.2 |
3.6 |
0.0 |
QTS North |
UDD23031 |
5872.95 |
3863.21 |
8474.10 |
295.0 |
94.0 |
-53.0 |
82.6 |
96.1 |
13.5 |
4.6 |
22.2 |
QTS North |
UDD22041 |
6055.77 |
3624.71 |
8702.39 |
165.6 |
96.0 |
-47.3 |
98.0 |
106.7 |
8.7 |
3.0 |
5.9 |
QTS Central |
UDD22043 |
6056.02 |
3624.32 |
8702.36 |
162.5 |
103.8 |
-46.3 |
99.9 |
108.4 |
8.5 |
4.2 |
11.5 |
QTS Central |
116.2 |
119.6 |
3.4 |
7.2 |
0.0 |
QTS Central |
|||||||
UDD22044 |
6055.69 |
3624.18 |
8702.44 |
181.8 |
109.3 |
-51.7 |
107.9 |
111.9 |
4.0 |
4.7 |
8.4 |
QTS Central |
117.0 |
121.1 |
4.1 |
4.0 |
23.5 |
QTS Central |
|||||||
UDD22047 |
6055.45 |
3624.21 |
8702.38 |
200.0 |
108.6 |
-57.5 |
133.0 |
150.0 |
17.0 |
4.7 |
0.0 |
QTS Central |
UDD22051 |
6054.00 |
3626.20 |
8703.20 |
225.0 |
134.7 |
-52.6 |
153.3 |
159.1 |
5.8 |
4.4 |
4.4 |
QTS Central |
UDD22052 |
6054.81 |
3623.19 |
8702.41 |
266.4 |
139.6 |
-55.6 |
180.5 |
192.0 |
11.5 |
11.8 |
38.9 |
QTS Central |
UDD22042 |
6055.67 |
3624.09 |
8702.46 |
185.0 |
94.6 |
-53.4 |
116.5 |
121.2 |
4.7 |
4.6 |
0.0 |
QTS Central |
128.5 |
140.0 |
11.5 |
4.5 |
16.0 |
QTS Central |
|||||||
UDD22045 |
6055.50 |
3624.09 |
8702.39 |
200.0 |
95.4 |
-58.6 |
151.0 |
156.1 |
5.1 |
3.5 |
6.5 |
QTS Central |
UDD22048 |
6055.33 |
3624.16 |
8702.39 |
213.0 |
109.6 |
-60.3 |
160.2 |
165.4 |
5.2 |
4.4 |
9.7 |
QTS Central |
UDD22053 |
6055.21 |
3623.07 |
8702.40 |
213.0 |
135.2 |
-46.8 |
143.9 |
149.3 |
5.4 |
5.1 |
0.0 |
QTS Central |
151.5 |
158.5 |
7.0 |
4.5 |
8.3 |
QTS Central |
|||||||
UDD22023 |
6056.73 |
3623.30 |
8702.41 |
162.0 |
115.0 |
-32.4 |
93.9 |
102.2 |
8.3 |
5.6 |
27.6 |
QTS Central |
110.9 |
115.5 |
4.6 |
4.8 |
10.0 |
QTS Central |
|||||||
UDD22039 |
6056.26 |
3623.81 |
8702.49 |
160.0 |
111.0 |
-40.3 |
98.0 |
109.7 |
11.7 |
4.8 |
7.9 |
QTS Central |
UDD22040 |
6055.79 |
3623.32 |
8702.47 |
160.5 |
124.0 |
-37.5 |
95.3 |
99.5 |
4.2 |
4.0 |
0.0 |
QTS Central |
102.8 |
109.0 |
6.2 |
7.5 |
0.0 |
QTS Central |
|||||||
114.5 |
121.4 |
6.9 |
11.3 |
28.3 |
QTS Central |
|||||||
UDD22049A |
6054.00 |
3626.20 |
8703.20 |
222.8 |
125.7 |
-58.4 |
152.4 |
178.0 |
25.6 |
6.1 |
21.7 |
QTS Central |
UDD22054 |
6055.32 |
3622.80 |
8702.47 |
196.4 |
137.4 |
-39.6 |
136.6 |
143.0 |
6.4 |
5.1 |
17.7 |
QTS Central |
146.5 |
161.0 |
14.5 |
9.0 |
26.6 |
QTS Central |
|||||||
Note: |
||||||||||||
Borehole intersects criteria based on Copper grade > |
||||||||||||
Hole |
East (MG) |
North(MG) |
RL. (MG) |
EOH |
Azimuth |
Dip |
From |
To |
Length |
Cu % |
Ag g/t |
System |
QSDD056 |
6440.22 |
2988.00 |
10258.06 |
321.4 |
268.6 |
-57.2 |
268.4 |
269.2 |
0.8 |
3.5 |
10.0 |
QTSS Upper A |
QSDD057C |
6438.24 |
2959.60 |
10257.83 |
301.2 |
266.8 |
-59.9 |
281.2 |
282.9 |
1.7 |
21.3 |
72.3 |
QTSS Upper A |
QSDD059 |
6433.27 |
2900.58 |
10257.56 |
294.5 |
272.1 |
-57.0 |
268.7 |
271.6 |
3.0 |
13.9 |
43.3 |
QTSS Upper A |
QSDD060 |
6437.03 |
2841.27 |
10257.29 |
320.1 |
270.1 |
-59.0 |
293.1 |
293.6 |
0.5 |
9.1 |
90.0 |
QTSS Upper A |
Note: |
||||||||||||
The intersects criteria is not apply to QTSS Upper A due to its mineralisation style as narrow vein. |
||||||||||||
Zinc Results |
||||||||||||
Hole |
Sample ID |
From |
To |
Length |
Cu % |
Ag g/t |
Pb % |
Zn % |
||||
QSDD060 |
CU157624 |
285.50 |
286.10 |
0.6 |
0.0 |
2.0 |
0.6 |
1.0 |
||||
QSDD060 |
CU157632 |
293.60 |
294.40 |
0.8 |
1.6 |
31.0 |
0.2 |
1.7 |
||||
QSDD060 |
CU157633 |
294.40 |
295.20 |
0.8 |
0.6 |
24.0 |
7.0 |
16.8 |
||||
QSDD060 |
CU157634 |
295.20 |
295.90 |
0.7 |
0.6 |
16.0 |
2.5 |
25.2 |
||||
QSDD060 |
CU157637 |
297.70 |
298.70 |
1.0 |
1.2 |
64.0 |
9.7 |
30.0 |
||||
Data aggregation methods |
|
|
Relationship between mineralisation widths and intercept lengths |
|
|
Diagrams |
|
|
Balanced reporting |
|
|
Other substantive exploration data |
|
|
Further work |
|
|
View source version on businesswire.com: https://www.businesswire.com/news/home/20240319036286/en/
Mick McMullen
Chief Executive Officer
Metals Acquisition Limited
investors@metalsacqcorp.com
Morne Engelbrecht
Chief Financial Officer
Metals Acquisition Limited
Source: Metals Acquisition Limited