
Aurora Cannabis Announces Full Year and Fiscal 2026 Fourth Quarter Results with Record Annual Revenue and Adjusted EBITDA¹
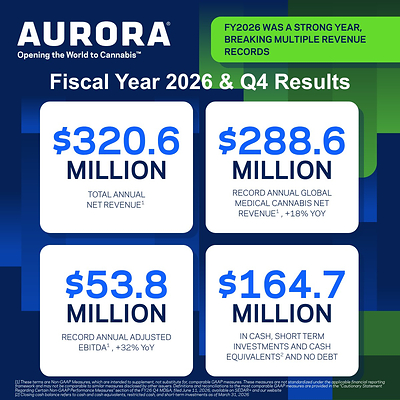
Aurora Cannabis (NASDAQ:ACB) reported fiscal 2026 results, highlighting record annual global medical cannabis net revenue1 of $288.6 million, up 18% year over year, and record annual Adjusted EBITDA1 of $53.8 million, up 32%.
Rhea-AI Summary
Aurora Cannabis (NASDAQ:ACB) reported fiscal 2026 results, highlighting record annual global medical cannabis net revenue1 of $288.6 million, up 18% year over year, and record annual Adjusted EBITDA1 of $53.8 million, up 32%.
The company ended Q4 2026 with total net revenue1 of $84.8 million, medical cannabis net revenue1 of $77.1 million, Adjusted EBITDA1 of $9.2 million, and approximately $164.7 million in cash, short-term investments and cash equivalents2 with no debt. Aurora completed a $26.5 million acquisition of Safari Flower Company, adding a 59,000 square foot EU-GMP indoor cultivation and manufacturing facility, and divested its 50.1% stake in Bevo. For fiscal 2027, Aurora expects lower total net revenue1, adjusted gross margins1 in the mid to high 50% range, broadly stable Adjusted SG&A1, and lower annual Adjusted EBITDA1 versus fiscal 2026.
Positive
- Record annual global medical cannabis net revenue1 of $288.6 million, +18% YoY
- Record annual Adjusted EBITDA1 of $53.8 million, +32% YoY
- Q4 2026 medical cannabis net revenue1 $77.1 million, 91% of total
- Safari acquisition adds 59,000 sq. ft. EU-GMP facility for international supply
- Q4 2026 working capital1 of $330.5 million
- Approximately $164.7 million in cash, short-term investments and cash equivalents2 with no debt
Negative
- Q4 2026 net loss from continuing operations widened to $27.6 million
- Q4 2026 Adjusted EBITDA1 fell to $9.2 million from $14.1 million
- Q4 2026 consumer cannabis net revenue1 declined 55% YoY to $3.6 million
- Q4 2026 adjusted gross margin1 on medical cannabis fell to 66% from 71%
- Free cash flow1 dropped to $0.3 million in Q4 2026 from $5.2 million
- Fiscal 2027 outlook calls for lower total net revenue1 and lower annual Adjusted EBITDA1
Details
News Market Reaction – ACB
On Jun 11, the day this news came out, ACB closed 6.38% below the previous close.
Data tracked by StockTitan Argus for the Jun 11 session.
Key Figures
- Global medical cannabis net revenue
- $288.6 million
- Record annual net revenue, 18% YoY growth
- Annual Adjusted EBITDA
- $53.8 million
- Record annual Adjusted EBITDA, 32% YoY growth
- Cash and equivalents
- $164.7 million
- Cash, short term investments and cash equivalents with no debt
- Q4 2026 net revenue
- $84.8 million
- Total net revenue in Q4 2026 vs $76.8 million prior-year quarter
- Q4 2026 medical net revenue
- $77.1 million
- Medical cannabis net revenue, 14% YoY increase, 91% of consolidated revenue
- Q4 2026 consumer net revenue
- $3.6 million
- Consumer cannabis net revenue vs $8.2 million prior-year, reflecting wind-down
- Safari acquisition value
- $26.5 million
- Total consideration for Safari Flower Company acquisition
- Safari facility size
- 59,000 square feet
- EU-GMP certified indoor cultivation and manufacturing facility
Historical Context
-
Expanded Strains for Heroes program and veteran community support in Canada.
-
Scheduled Q4 and FY 2026 results release and investor conference call.
-
Granted Canadian Plant Breeders’ Rights for two proprietary medical cultivars.
-
Expanded medical cannabis product portfolio across several key international markets.
-
Accretive Safari Flower acquisition to expand EU GMP capacity for high-margin markets.
24h Move is the share-price change in the day after each event; other market factors may also have contributed.
Key Terms
adjusted EBITDA financial
non-GAAP financial measures financial
EU-GMP medical
adjusted gross margin financial
free cash flow financial
working capital financial
fair value adjustments financial
SG&A financial
AI-generated analysis. How Rhea-AI works. Not financial advice.




NASDAQ | TSX: ACB
- Achieves Record Annual Global Medical Cannabis Net Revenue1 of
$288.6 million 18% YoY growth - Delivers Record Annual Adjusted EBITDA1 of
$53.8 million 32% YoY growth - Completes Accretive Acquisition of Safari Flower Company in April, an established EU-GMP Manufacturer, adding Critical Capacity to Serve Growing Profitable International Markets
- Maintains Strong Balance Sheet with
~ of Cash, Short Term Investments and Cash Equivalents2 with no Debt$164.7 million
"During fiscal year 2026, we exceeded our projection for global medical cannabis net revenue1 led by double-digit growth in
"We believe Aurora's leadership in medical cannabis is built upon our regulatory expertise, extensive and recently expanded supply network of EU-GMP certified facilities, and proven commercial execution. We are confident that these attributes create a competitive advantage as we navigate the evolving industry dynamics to maintain and expand global market share, while driving international growth," concluded Mr. Martin.
[1] This news release includes certain non-GAAP financial measures, which are intended to supplement, not substitute for, comparable GAAP financial measures. See "Non-GAAP Measures" below for reconciliations of non-GAAP financial measures to GAAP financial measures. |
[2] Cash Equivalents refers to cash, restricted cash and cash equivalents. |
Fourth Quarter 2026 Highlights
(Unless otherwise stated, comparisons are made between fiscal Q4 2026 and Q4 2025 results and are in Canadian dollars and reflects only the results of continuing operations, unless otherwise noted.
On February 17, 2026, the Company completed the divestiture of its
Consolidated Revenue and Adjusted Gross Profit:
Total net revenue1 was
Consolidated adjusted gross margin before fair value adjustments1 was
Medical Cannabis:
Medical cannabis net revenue1 was
The increase in medical cannabis net revenue1 of
Adjusted gross margin before fair value adjustments1 on medical cannabis net revenue1 was
Consumer Cannabis:
Aurora's consumer cannabis net revenue1 was
Adjusted gross margin before fair value adjustments1 on consumer cannabis net revenue1 was
Adjusted Selling, General and Administrative ("Adjusted SG&A"):
Adjusted SG&A1 was
Net Income (Loss):
Net loss from continuing operations for the three months ended March 31, 2026 was
Adjusted Net Income:
Adjusted net income1 was
Adjusted EBITDA:
Adjusted EBITDA1 was
Free Cash Flow:
Free cash flow was
Strategic Business Update
Plant Propagation:
On February 3, 2026, Aurora and its wholly owned subsidiary entered into a definitive agreement with Bevo Agtech Inc and Bevo Farms Ltd. pursuant to which, among other things, Aurora agreed to exchange all of its common shares of Bevo for preferred shares of Bevo. On February 17, 2026, the transaction closed, resulting in the disposal of the Company's
Safari Flower Company Acquisition:
On April 15, 2026, the Company acquired Safari Flower Company ("Safari"), through a share purchase acquisition, for total consideration of
The acquisition of Safari provides the Company with a 59,000 square foot EU-GMP certified indoor cultivation and manufacturing facility to supply cannabis to key international markets while reducing reliance on third party purchases.
Fiscal Full Year 2027 Outlook:
Our outlook reflects the strategic changes we have made in exiting our low margin Canadian Consumer and Plant Propagation businesses, which will allow the Company to reallocate resources to focus on global medical cannabis. We believe this is our highest return opportunity to create value.
Over the next few quarters, we are purposely investing in our international business through strategic sales initiatives and EU GMP capacity expansion to support growth in our most profitable markets. These efforts are expected to help offset the impact of margin reductions in our Canadian medical business, following the reduction in government reimbursed pricing, effective April 1, 2026.
- Total Net Revenue1 is expected to decline and be more in line with our Cannabis Net Revenue results in fiscal year 2025, following the changes in Canadian medical partially offset by international growth, driven by
Germany andPoland . - Adjusted Gross Margin before FV adjustments1 are expected to be in the mid to high fifties, driven by higher revenue contributions from
Europe and the exit from the lower margin businesses. These benefits will partially offset lower margins in Canadian Medical. - Adjusted SG&A1 is expected to remain broadly in line with the prior fiscal year.
- Adjusted EBITDA1 is expected to vary quarter over quarter, leading to lower annual adjusted EBITDA1 compared to the prior fiscal year. This change in expectations is due to the revisions in reimbursed pricing that drive lower net revenue and adjusted gross profits contributions.
Key Quarterly Financial Results
($ thousands) | Three months ended | ||||||
March 31, 2026 | December 31, 2025 | $ Change | % Change | March 31, 2025 | $ Change | % Change | |
Financial Results(3) | |||||||
Net revenue (1) | 84,816 | 82,893 | 1,923 | 2 % | 76,768 | 8,048 | 10 % |
Medical cannabis net revenue (1) | 77,096 | 76,247 | 849 | 1 % | 67,776 | 9,320 | 14 % |
Consumer cannabis net revenue (1) | 3,645 | 5,160 | (1,515) | (29 %) | 8,166 | (4,521) | (55 %) |
Adjusted gross margin before FV adjustments on | 60 % | 66 % | N/A | (6 %) | 65 % | N/A | (5 %) |
Adjusted gross margin before FV adjustments on medical | 66 % | 69 % | N/A | (3 %) | 71 % | N/A | (5 %) |
Adjusted gross margin before FV adjustments on | 22 % | 28 % | N/A | (6 %) | 27 % | N/A | (5 %) |
Adjusted SG&A expense(1) | 40,254 | 34,867 | 5,387 | 15 % | 35,403 | 4,851 | 14 % |
Adjusted EBITDA (1) | 9,227 | 18,371 | (9,144) | (50 %) | 14,056 | (4,829) | (34 %) |
Adjusted net income (1) | 5,581 | 11,711 | (6,130) | (52 %) | 15,272 | (9,691) | (63 %) |
Free cash flow (1) | 316 | 18,569 | (18,253) | (98 %) | 5,249 | (4,933) | (94 %) |
Balance Sheet | |||||||
Working capital (1) | 330,523 | 299,901 | 30,622 | 10 % | 367,465 | (36,942) | (10 %) |
Cannabis inventory and biological assets (2) | 169,629 | 191,064 | (21,435) | (11 %) | 193,980 | (24,351) | (13 %) |
Total assets | 601,087 | 775,292 | (174,205) | (22 %) | 852,666 | (251,579) | (30 %) |
(1) | These terms are defined in the "Cautionary Statement Regarding Certain Non‑GAAP Performance Measures" section of the Annual MD&A, including information on reconciliation to the most directly comparable IFRS measures. |
(2) | Represents total biological assets and inventory, exclusive of merchandise, accessories, supplies and consumables. |
(3) | Results shown are from continuing operations. On February 17, 2026, the Company completed the divestiture of its |
Conference Call
Aurora will host a conference call today, Thursday, June 11, 2026, to discuss these results. Miguel Martin, Chief Executive Officer, and Simona King, Chief Financial Officer, will host the call starting at 8:00 a.m. Eastern time | 6:00 a.m. Mountain Time. A question and answer session will follow management's presentation.
DATE: | Thursday, June 11, 2026 |
TIME: | 8:00 a.m. Eastern Time | 6:00 a.m. Mountain Time |
WEBCAST: | |
About Aurora Cannabis
Aurora is a global leader in medical cannabis, dedicated to improving lives through scientific expertise, proven performance, and a deep commitment to patient care. Aurora serves medical markets across
Aurora's common shares trade on the NASDAQ and TSX under the symbol "ACB".
Forward Looking Statements
This news release includes statements containing certain "forward-looking information" within the meaning of applicable securities law ("forward-looking statements"). Forward-looking statements are frequently characterized by words such as "plan", "continue", "expect", "project", "intend", "believe", "anticipate", "estimate", "may", "will", "potential", "proposed" and other similar words, or statements that certain events or conditions "may" or "will" occur. Forward-looking statements made in this news release include, but are not limited to, statements regarding the Company's fiscal 2026 results; statements under the heading "Fiscal Full Year 2027 Outlook ", including, but not limited to, those related to expectations for net revenue, adjusted gross margin before FV adjustments, adjusted EBITDA, and adjusted SG&A; statements regarding the Company's long-term outlook, ability to respond to changing global market dynamics and ability to mitigate the impact of margin reductions in the Canadian medical business; statements regarding the Company's global medical cannabis leadership and anticipated growth in the Company's international medical business; and statements regarding the Company's conference call to discuss results.
These forward-looking statements are only predictions. Forward-looking information or statements contained in this news release have been developed based on the Company and its management's good faith assumptions relating to the financial, market, regulatory and other relevant environments that will exist and affect the Company's business and operations in the future. Forward-looking information and statements are not a guarantee of future performance and are based upon a number of estimates and assumptions of management at the date the statements are made including, among other things, assumptions about: development costs remaining consistent with budgets; the ability to manage anticipated and unanticipated costs; access to favorable equity and debt capital markets; the ability to raise sufficient capital to advance the business of the Company; favorable operating and economic conditions; political and regulatory stability; obtaining and maintaining all required licenses and permits; receipt of governmental approvals and permits; sustained labour stability; stability in financial and capital goods markets; favorable production levels and costs from the Company's operations; the pricing of various cannabis products; the level of demand for cannabis products; the availability of third-party service providers and other inputs for the Company's operations; and the Company's ability to conduct operations in a safe, efficient, and effective manner. The Company does not give any assurance that the assumptions on which forward-looking information or statements are based will prove to be correct, or that the Company's business or operations will not be affected in any material manner by these or other factors not foreseen or foreseeable by the Company or management or beyond the Company's control. Such forward-looking statements are estimates reflecting the Company's best judgment based upon current information and involve a number of risks and uncertainties, and there can be no assurance that other factors will not affect the accuracy of such forward-looking statements. These risks include, but are not limited to, the ability to retain key personnel, the ability to continue investing in infrastructure to support growth, the ability to obtain financing on acceptable terms, the continued quality of our products, customer experience and retention, the development of third party government and non-government consumer sales channels, management's estimates of consumer demand in
Non-GAAP Measures
This news release contains reference to certain financial performance measures that are not recognized or defined under IFRS (termed "Non-GAAP Measures"). As a result, this data may not be comparable to data presented by other licensed producers of cannabis and cannabis companies. Non-GAAP Measures should be considered together with other data prepared in accordance with IFRS to enable investors to evaluate the Company's operating results, underlying performance and prospects in a manner similar to Aurora's management. Accordingly, these non-GAAP Measures are intended to provide additional information and to assist management and investors in assessing financial performance and should not be considered in isolation or as a substitute for measures of performance prepared in accordance with IFRS. The information included under the heading "Cautionary Statement Regarding Certain Non-GAAP Performance Measures" in the FY26 Q4 MD&A is incorporated by reference into this news release. The MD&A is available on the Company's issuer profiles on SEDAR+ at www.sedarplus.com and on the
Net Revenue, Adjusted Gross Profit and Margin
Net revenue, adjusted gross profit before FV adjustments, and adjusted gross margin before FV adjustments are Non-GAAP Measures and can be reconciled with revenue, gross profit and gross margin, the most directly comparable GAAP financial measures, respectively, as follows:
($ thousands) | Three months ended | Years ended | |||
March 31, 2026 | December 31, 2025 | March 31, 2025 | March 31, 2026 | March 31, 2025 | |
Medical cannabis net revenue(1) | |||||
Canadian medical cannabis net revenue | 28,314 | 28,250 | 26,751 | 112,116 | 107,432 |
International medical cannabis net revenue | 48,782 | 47,997 | 41,025 | 176,524 | 137,010 |
Total medical cannabis net revenue(1) | 77,096 | 76,247 | 67,776 | 288,640 | 244,442 |
Consumer cannabis net revenue(1) | 3,645 | 5,160 | 8,166 | 23,548 | 40,033 |
Wholesale bulk cannabis net revenue(1) | 4,075 | 1,486 | 826 | 8,405 | 4,436 |
Total net revenue(1) | 84,816 | 82,893 | 76,768 | 320,593 | 288,911 |
(1) | These terms are defined in the "Cautionary Statement Regarding Certain Non‑GAAP Performance Measures" section of the Annual MD&A, including information on reconciliation to the most directly comparable IFRS measures. |
Adjusted EBITDA
The following is the Company's adjusted EBITDA:
($ thousands) | Three months ended | Years ended | |||
March 31, 2026 | December 31, 2025(3) | March 31, 2025(3) | March 31, 2026 | March 31, 2025(3) | |
Net income (loss) from continuing operations | (27,566) | 6,317 | (12,128) | (58,619) | 27,050 |
Income tax expense (recovery) | (538) | 97 | 3,285 | 2,095 | 4,245 |
Other expense (income) | 1,673 | 2,322 | (11,925) | 9,862 | (20,861) |
Share-based compensation | 689 | (551) | 3,786 | 7,293 | 12,930 |
Depreciation and amortization | 3,871 | 4,583 | 3,379 | 16,228 | 15,430 |
Business development costs | 850 | 443 | 624 | 1,975 | 3,435 |
Inventory and biological assets fair value and | 20,487 | 1,306 | 21,953 | 50,419 | (20,969) |
Business transformation costs (1) | 9,761 | 3,854 | 5,082 | 24,555 | 19,610 |
Adjusted EBITDA (2) | 9,227 | 18,371 | 14,056 | 53,808 | 40,870 |
(1) | Business transformation related charges include costs related to closed facilities, certain IT project costs, sublease income, severance and retention costs in connection with the exit of the consumer market, legal provisions and costs associated with the retention of certain medical aggregators. |
(2) | Adjusted EBITDA is defined in the "Cautionary Statement Regarding Certain Non‑GAAP Performance Measures" section of the Annual MD&A, including information on reconciliation to the most directly comparable IFRS measures. |
(3) | Prior period comparatives were adjusted to include the adjustments for markets under development, business transformation costs and non-recurring charges related to non-core bulk cannabis wholesale to be comparable to the current period presentation. |
Adjusted Net Income
The following is the Company's adjusted net income (loss):
($ thousands) | Three months ended | Years ended | |||
March 31, 2026 | December 31, 2025 | March 31, 2025 | March 31, 2026 | March 31, 2025 | |
Net income (loss) from continuing operations | (27,566) | 6,317 | (12,128) | (58,619) | 27,050 |
Inventory and biological assets fair value and | 20,487 | 1,306 | 21,953 | 50,419 | (20,969) |
Business development costs | 850 | 443 | 624 | 1,975 | 3,435 |
Impairment of property, plant and equipment | 2,246 | 4 | — | 2,775 | (696) |
Impairment of intangible assets and goodwill | — | — | — | 13,186 | — |
Deferred tax expense - impairment of intangible | — | — | — | 5,856 | — |
Business transformation costs (1) | 9,564 | 3,641 | 4,823 | 23,746 | 18,401 |
Adjusted net income (2) | 5,581 | 11,711 | 15,272 | 39,338 | 27,221 |
(1) | Business transformation costs include certain IT project costs, severance and retention costs in connection with the exit of the consumer market, legal provision and costs associated with the retention of certain medical aggregators. |
(2) | Adjusted net income is defined in the "Cautionary Statement Regarding Certain Non‑GAAP Performance Measures" section of the Annual MD&A, including information on reconciliation to the most directly comparable IFRS measures |
Adjusted SG&A
Adjusted SG&A is a Non-GAAP Measure and can be reconciled with sales and marketing and general and administrative expenses, the most directly comparable GAAP financial measure, as follows:
Three months ended | Years ended | ||||
($ thousands) | March 31, 2026 | December 31, 2025 | March 31, 2025 | March 31, 2026 | March 31, 2025 |
General and administration | 29,540 | 23,861 | 25,078 | 106,567 | 91,323 |
Sales and marketing | 16,022 | 14,860 | 15,407 | 59,641 | 56,170 |
Business transformation costs (2) | (5,308) | (3,854) | (5,082) | (20,105) | (19,610) |
Adjusted SG&A (1) | 40,254 | 34,867 | 35,403 | 146,103 | 127,883 |
(1) | Adjusted SG&A is defined in the "Cautionary Statement Regarding Certain Non‑GAAP Performance Measures" section of the Annual MD&A, including information on reconciliation to the most directly comparable IFRS measures. |
(2) | Business transformation costs include certain IT project costs, severance and retention costs in connection with the business transformation plan and costs associated with the consumer channel exit |
Free Cash Flow
The table below outlines free cash flow for the periods ended:
Three months ended | Years ended | ||||
($ thousands) | March 31, 2026 | December 31, 2025 | March 31, 2025 | March 31, 2026 | March 31, 2025 |
Cash provided by (used in) operating activities | (9,410) | 9,517 | (2,969) | 1,386 | 4,764 |
Changes in non-cash working capital | 11,823 | 10,573 | 9,736 | (9,214) | 14,205 |
Net cash provided by (used in) operating | 2,413 | 20,090 | 6,767 | (7,828) | 18,969 |
Less: maintenance capital expenditures(1) | (2,097) | (1,521) | (1,518) | (6,425) | (8,084) |
Free cash flow(2) | 316 | 18,569 | 5,249 | (14,253) | 10,885 |
(1) | Maintenance capital expenditures are comprised of costs to sustain facilities, machinery and equipment in working order to support operations and excludes discretionary investments for revenue growth. |
(2) | Free cash flow is defined in the "Cautionary Statement Regarding Certain Non‑GAAP Performance Measures" section of the Annual MD&A, including information on reconciliation to the most directly comparable IFRS measures. |
Working Capital
Working capital is a Non-GAAP Measure and can be reconciled with total current assets and total current liabilities, the most directly comparable GAAP financial measure, as follows:
($ thousands) | Three months ended | ||
March 31, 2026 | December 31, 2025 | March 31, 2025 | |
Total current assets | 397,453 | 445,836 | 488,548 |
Total current liabilities | (66,930) | (145,935) | (149,807) |
Working capital | 330,523 | 299,901 | 338,741 |

 View original content to download multimedia:https://www.prnewswire.com/news-releases/aurora-cannabis-announces-full-year-and-fiscal-2026-fourth-quarter-results-with-record-annual-revenue-and-adjusted-ebitda-302797627.html
SOURCE Aurora Cannabis Inc.
FAQ
AI-generated questions and answers. How Rhea-AI works. Not financial advice.