
Minnova Announces Positive Preliminary Economic Assessment for the PL Gold Mine Restart: After-Tax NPV5% of US$181 Million and 111% IRR at US$3,000/oz Gold, Rising to US$439 Million at US$4,000/oz
A 20% reduction in assumed gold price lowers projected after-tax value at a 5% discount rate to US$5.0 million.
Sentiment and the balance of points
Rhea-AI Sentiment reads the wording of the document, how positive or negative its language is on a 1 to 5 scale. The balance of points shown with the takes weighs what the document actually discloses, so the two can disagree, for example when a trial that missed its main goal is described in upbeat language.
Rhea-AI Summary
Minnova (AGRDF) announced a preliminary economic assessment for restarting its PL Gold Mine, with projected after-tax value of US$180.6 million. That net present value discounts future cash flows at 5% and assumes US$3,000/oz gold. The assessment projects a 111% internal rate of return and 0.68-year payback from production.
The plan targets first gold in 2028 and 621.5 thousand recovered ounces over 2028–2037, using the existing mill. Estimated pre-production capital is US$53.4 million; total life-of-mine capital is US$120.9 million. Base-case all-in sustaining cost is US$2,288/oz. At US$4,000/oz gold, projected after-tax value rises to US$438.9 million. Open-pit mining would run through 2030, with underground mining expected from mid-2028 and supplying all mill feed from 2031. No production decision has been made; a decision depends on further work, including a feasibility study, financing and permitting.
How this balance works
Rhea-AI gives every point it takes from this document a weight. Minor counts 1, Moderate 3 and Major 9, so one Major point outweighs several Minor ones. The bar adds up the weights on each side, and when neither side holds more than 65% of the total the balance reads Mixed.
It reads the document as published, with the same rules for every company, and it does not look at what the market expected or at how the stock traded, so a point can be objectively good on a day the stock falls.
Rhea-AI Sentiment measures something else, the tone of the wording.
Hollow bars mark forward-looking points. How the balance works
Positive
- Major point. Forward-looking: it has not happened yet and may not happen.Base-case assessment projects US$180.6 million after-tax net present value at 5%, assuming US$3,000/oz gold.
- Moderate point. Forward-looking: it has not happened yet and may not happen.Production plan targets 621.5 thousand recovered ounces over 2028–2037, averaging 62.2 thousand ounces annually.
- Minor point. Forward-looking: it has not happened yet and may not happen.Base-case projected returns include 111% internal rate of return and 0.68-year payback from production.
- Minor point. Forward-looking: it has not happened yet and may not happen.Higher-price cases project after-tax value at 5% of US$310.8 million at US$3,500/oz and US$438.9 million at US$4,000/oz.
- Minor point. Forward-looking: it has not happened yet and may not happen.Life-of-mine after-tax free cash flow is projected at US$247.6 million in the US$3,000/oz base case.
4 minor points
- Minor point. Forward-looking: it has not happened yet and may not happen.Higher-price cases project life-of-mine after-tax free cash flow of US$427.7 million at US$3,500/oz and US$604.9 million at US$4,000/oz.
- Minor point. Forward-looking: it has not happened yet and may not happen.Early production is projected at 165.4 thousand ounces in 2028–2029, peaking at 91.6 thousand in 2029.
- Minor point. Forward-looking: it has not happened yet and may not happen.Mill processing is planned to increase from 492,000 tonnes in 2028 to 720,000 tonnes annually from 2029.
- Minor point. Forward-looking: it has not happened yet and may not happen.Existing mill refurbishment and contractor mining mean no owner mining fleet capital is required.
Negative
- Moderate pointRestart assessment remains preliminary; no production decision has been made.
- Moderate point. Forward-looking: it has not happened yet and may not happen.Estimated life-of-mine capital totals US$120.9 million, including US$53.4 million before production in 2026–2027.
- Moderate point. Forward-looking: it has not happened yet and may not happen.Gold-price sensitivity shows a 20% reduction lowers projected after-tax value at 5% to US$5.0 million.
- Moderate point. Forward-looking: it has not happened yet and may not happen.Recovered-gold sensitivity shows a 20% reduction lowers projected after-tax value at 5% to US$7.3 million.
- Minor pointProduction decision depends on a feasibility study, financing and permitting, alongside further work.
6 minor points
- Minor point. Forward-looking: it has not happened yet and may not happen.Base-case projected costs are US$2,183/oz cash cost, US$2,288/oz sustaining cost and US$2,377/oz all-in cost.
- Minor pointCost estimates allocate no corporate general and administrative expenses.
- Minor point. Forward-looking: it has not happened yet and may not happen.Revenue-linked 3% royalty raises projected sustaining cost to US$2,305/oz and US$2,323/oz in higher-price cases.
- Minor point. Forward-looking: it has not happened yet and may not happen.Base-case projected life-of-mine taxes total US$139.6 million.
- Minor point. Forward-looking: it has not happened yet and may not happen.Operating-cost sensitivity shows a 20% increase lowers projected after-tax value at 5% to US$60.5 million.
- Minor pointInternal rate of return is very sensitive to pre-production spending timing and should be considered alongside net present value.
AI-generated analysis. How Rhea-AI works. Not financial advice.




Low-capital restart using the existing PL mill: US
PEA Highlights (base case US
- Robust economics at a conservative base-case gold price: after-tax net present value at a
5% discount rate ("NPV5%") of US$180.6 million , after-tax internal rate of return ("IRR") of111% and payback of 0.7 years from the start of production at US$3,000 /oz gold, the same price used for the 2026 Mineral Resource Estimate. - Strong leverage to gold price: after-tax NPV5% of US
$310.8 million (IRR152% ) at US$3,500 /oz and US$438.9 million (IRR187% ) at a US$4,000 /oz long-term price. - Low pre-production capital of US
$53.4 million (2026-2027, including a15% contingency), reflecting the refurbishment of the existing PL mill and site infrastructure; total LOM capital of US$120.9 million including sustaining capital and closure. - 621.5 thousand ounces ("koz") of recovered gold over a 10-year mine life (2028-2037), averaging 62.2 koz per year, with 165.4 koz in the first two years from high-grade open pits (plant head grade 4.9 g/t Au in 2028-2029) and peak production of 91.6 koz in 2029.
- LOM all-in sustaining cost ("AISC")¹ of US
$2,288 /oz and total cash cost¹ of US$2,183 /oz. - LOM after-tax free cash flow¹ of US
$247.6 million at US$3,000 /oz, US$427.7 million at US$3,500 /oz and US$604.9 million at US$4,000 /oz. - Phased development: open-pit mining in 2028-2030 followed by underground mining from mid-2028, with the underground supplying all mill feed from 2031.
¹ Non-GAAP measure - see "Non-GAAP Financial Measures" below.
Toronto, Ontario--(Newsfile Corp. - October 14, 2026) - Minnova Corp. (TSXV: MCI) (OTC Pink: AGRDF) ("Minnova" or the "Company"), an advanced development-stage gold company focused on the restart and expansion of its
The PEA outlines a combined open-pit and underground operation that re-uses the existing processing plant at the past-producing PL mine site. Initial production is sourced from the high-grade open pits, with processing increasing from 492,000 tonnes in 2028 to 720,000 tonnes per year (approximately 2,000 tonnes per day) from 2029, followed by a transition to underground mining. Readers are cautioned that no production decision has been made. Any such decision would depend on further work, including the completion of a feasibility study, and on financing and permitting.
Gord Glenn, President and CEO of Minnova, commented: "This PEA confirms what we have believed about the PL Gold Mine: a high-grade open pit start, an existing mill and infrastructure, and a modest capital requirement combine to deliver a short payback and strong returns at a conservative US
Project Economics
Table 1 summarises the key results for the base case (US
Table 1 - Key economic results by gold price case
| Parameter | Base Case US | Alternative Case US | Higher Price Sensitivity Case US |
| Valuation (after tax unless stated) | |||
| After-tax NPV @ | 180.6 | 310.8 | 438.9 |
| After-tax NPV @ | 151.4 | 260.1 | 367.2 |
| After-tax IRR | |||
| After-tax payback from start of production (years) | 0.68 | 0.54 | 0.45 |
| Pre-tax NPV @ | 283.4 | 500.2 | 717.0 |
| Pre-tax IRR | |||
| LOM after-tax free cash flow¹ (US$M) | 247.6 | 427.7 | 604.9 |
| LOM taxes (US$M) | 139.6 | 259.4 | 382.1 |
| Production and cost | |||
| LOM recovered gold (koz) | 621.5 | 621.5 | 621.5 |
| LOM total operating cost (US$M) | 1,280.8 | 1,280.8 | 1,280.8 |
| Total cash cost¹ (US$/oz) | 2,183 | n/r | n/r |
| AISC¹ (US$/oz) | 2,288 | 2,305 | 2,323 |
| Pre-production capital, 2026-2027 (US$M) | 53.4 | 53.4 | 53.4 |
| Total LOM capital incl. sustaining and closure (US$M) | 120.9 | 120.9 | 120.9 |
All values real (unescalated) US$,
Note on IRR: the after-tax IRR exceeds
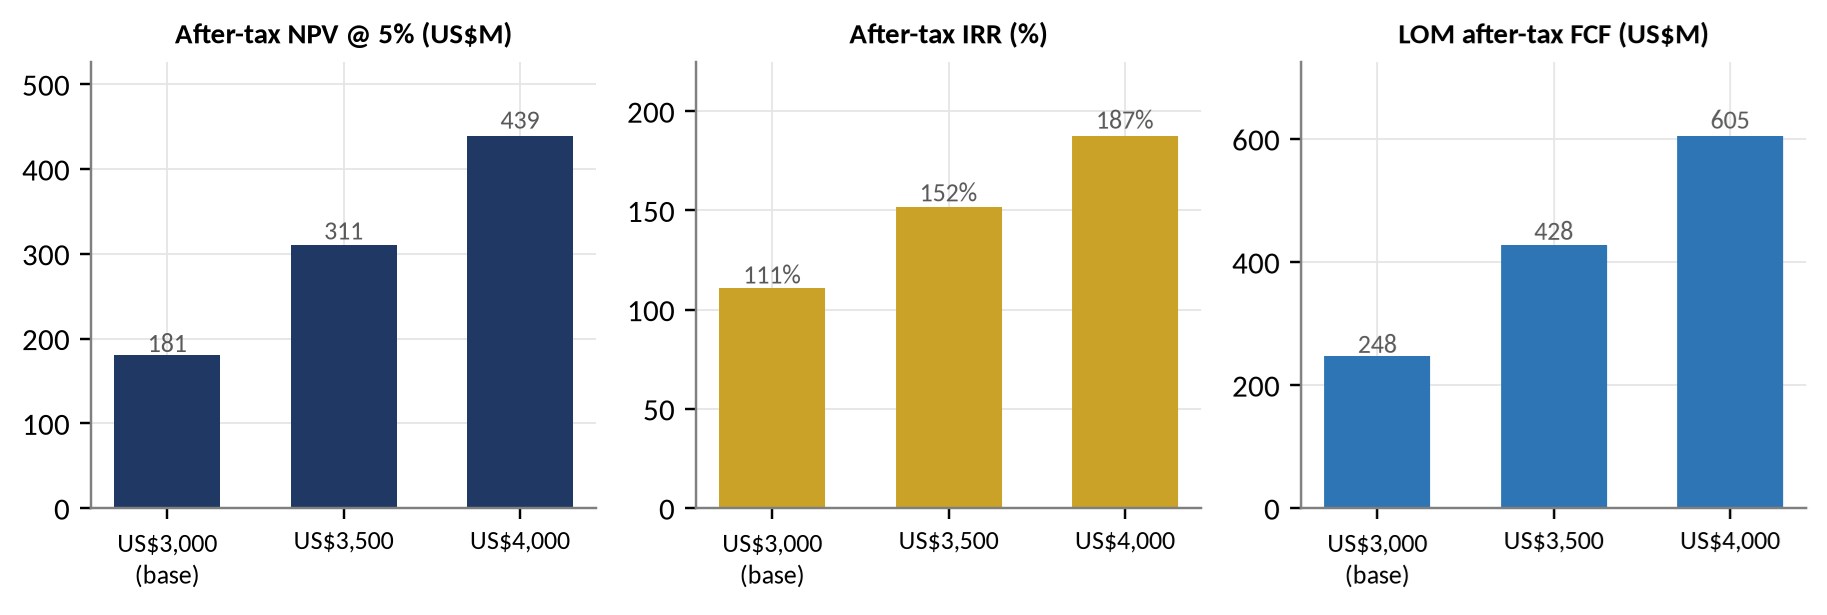
Figure 1: After-tax NPV5%, IRR and LOM free cash flow by gold price case
To view an enhanced version of this graphic, please visit:
https://images.newsfilecorp.com/files/3654/319014_0a4eaeb564451948_001full.jpg
Production Profile
Table 2 - Production summary
| Parameter | Open pit | Underground | Total LOM |
| Ore mined and processed (Mt) | 1.76 | 4.74 | 6.50 |
| Waste mined (Mt) | 36.9 | 3.42 | 40.3 |
| Strip ratio (waste : ore) | 21:1 | - | - |
| Recovered gold (koz) | 212.0 | 409.4 | 621.5 |
| Mining period | 2028-2030 | 2028-2037 | 2028-2037 |
| Average plant head grade (g/t Au) | 4.68 | 2.80 | 3.30 |
| Metallurgical recovery (design) | |||
| Average annual gold production, 2028-2037 (koz) | - | - | 62.2 |
Source: PEA financial model (Production Schedule, Economic Summary rows 76-82). Head grade is for combined plant feed.
The Project is planned to commence production in 2028, with initial mill feed sourced from high-grade open-pit mining. Underground mining is expected to commence in mid-2028 and operate concurrently with open-pit mining through 2030. From 2031, underground mining is planned to supply all mill feed through the end of the current LOM production schedule in 2037.
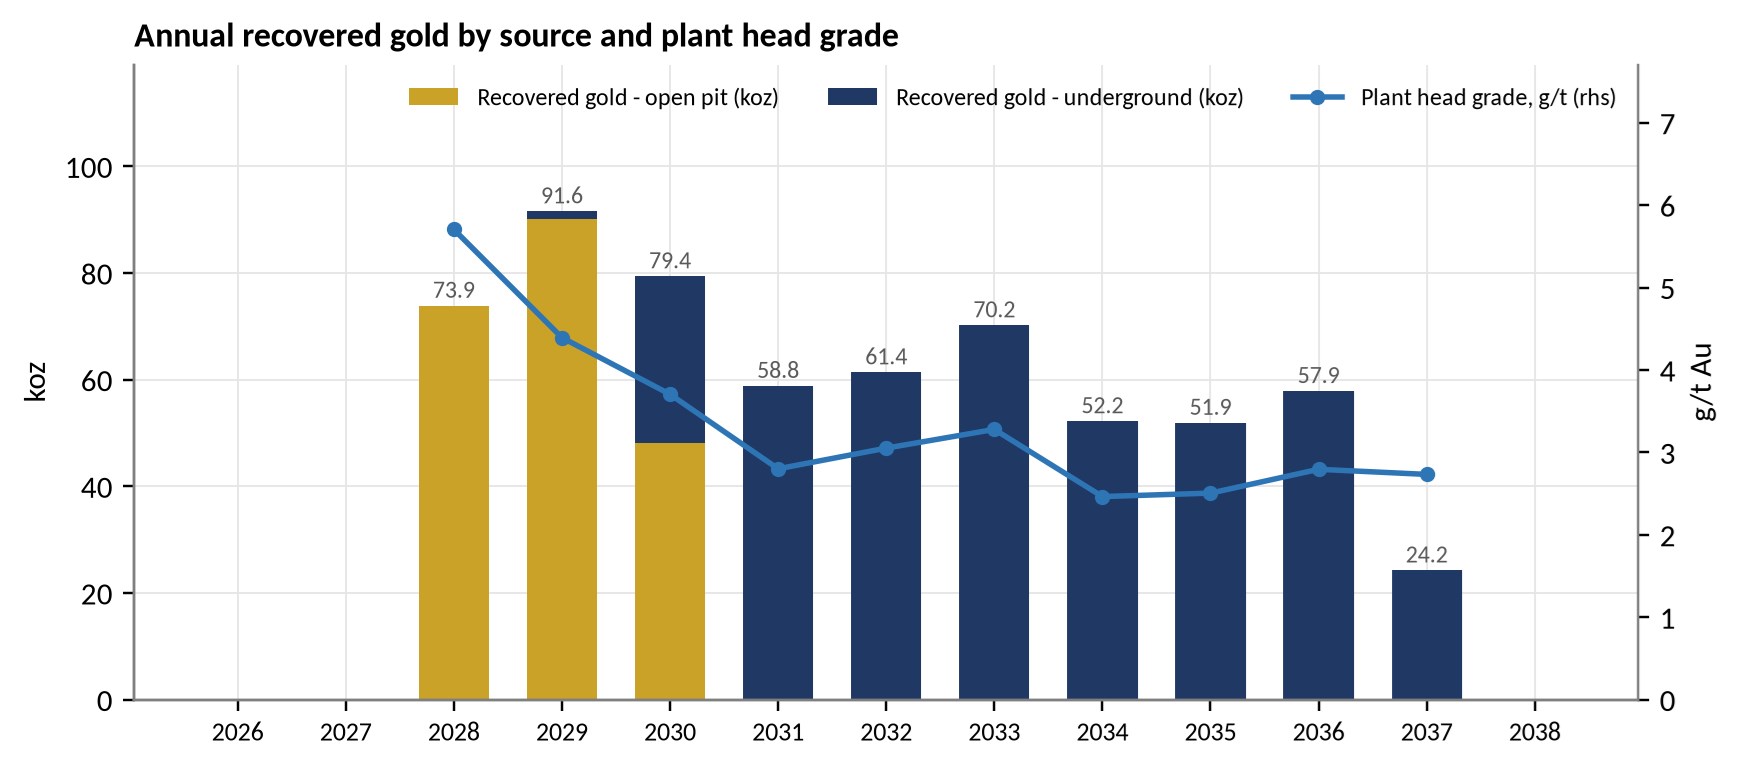
Figure 2: Annual recovered gold by source (koz) and plant head grade (g/t Au)
To view an enhanced version of this graphic, please visit:
https://images.newsfilecorp.com/files/3654/319014_0a4eaeb564451948_002full.jpg
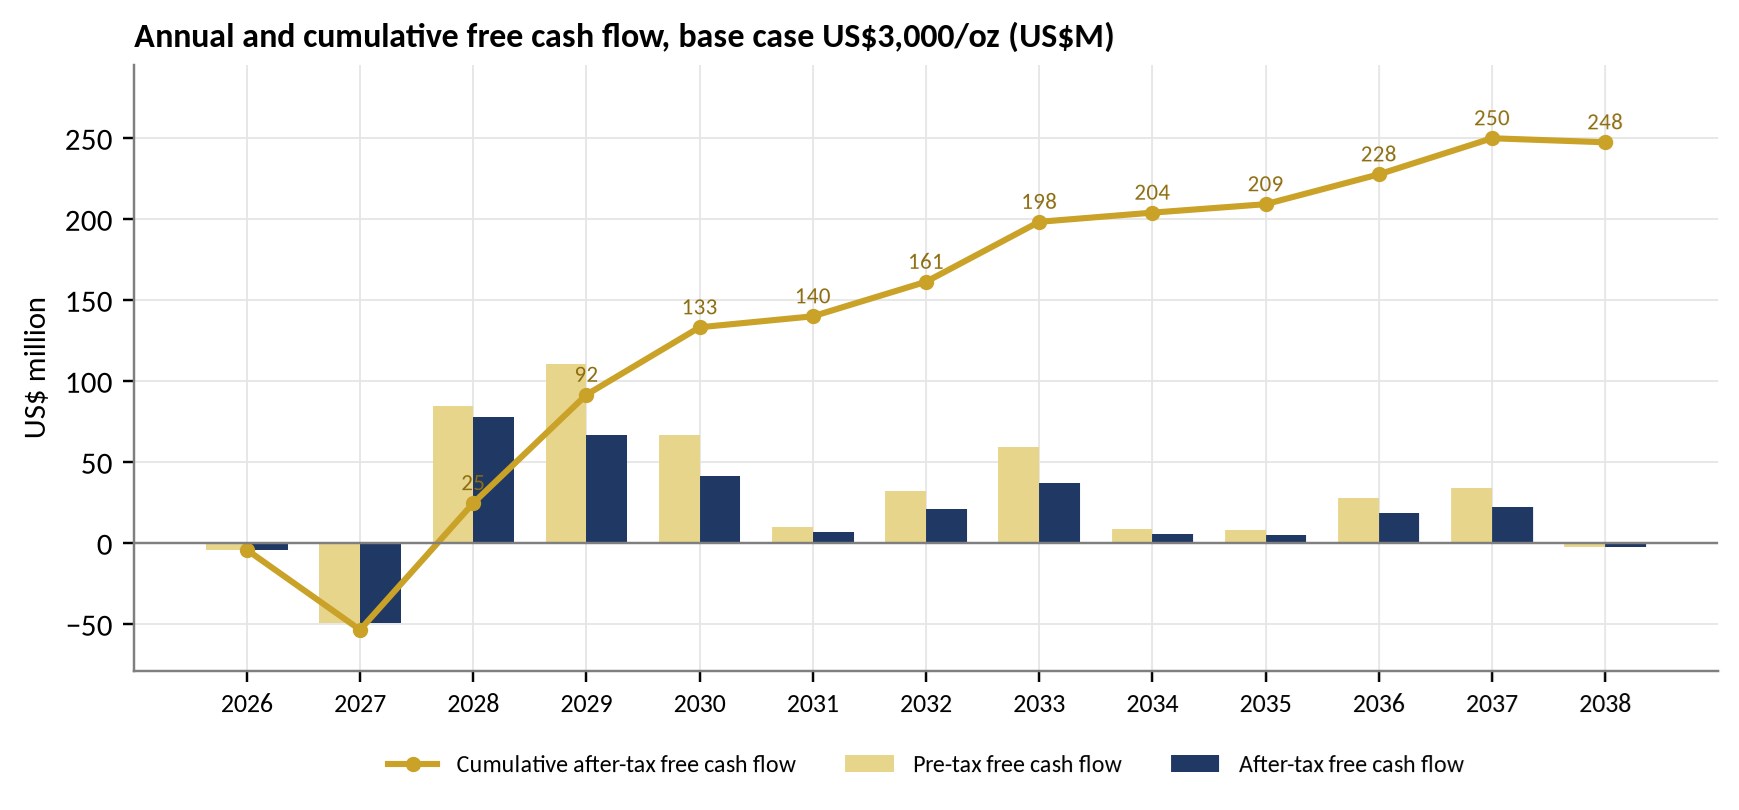
Figure 3: Annual and cumulative free cash flow, base case US
To view an enhanced version of this graphic, please visit:
https://images.newsfilecorp.com/files/3654/319014_0a4eaeb564451948_003full.jpg
Capital Costs
Pre-production capital is estimated at US
Table 3 - Capital cost summary (US$M)
| Category | Pre-production 2026-2027 | 2028 | 2029-2038 | LOM total |
| Initial - direct (incl. open-pit pre-strip) | 40.9 | 2.0 | - | 42.9 |
| Initial - contingency ( | 7.0 | - | - | 7.0 |
| Pre-production studies, owner's costs, approvals | 5.5 | - | - | 5.5 |
| Total initial (non-sustaining) capital | 53.4 | 2.0 | - | 55.4 |
| Sustaining capital | - | 29.9 | 18.0 | 47.9 |
| Sustaining - | - | 1.5 | 13.5 | 15.0 |
| Closure and reclamation | - | - | 2.6 | 2.6 |
| Total capital | 53.4 | 33.4 | 34.1 | 120.9 |
Totals may not add due to rounding.
Operating Costs
Open-pit mining costs are based on the pit optimisation (US
Table 4 - LOM operating costs
| Area | US$M | US$/t | US$/oz recovered from source |
| Open pit (direct) | 217.1 | 123.58 /t OP ore | 1,024 |
| Underground (direct) | 726.5 | 153.18 /t UG ore | 1,774 |
| Processing (incl. mill power) | 182.8 | 28.13 /t milled | - |
| Shared site, G&A, camp, community and other | 154.4 | 23.76 /t milled | - |
| Total operating cost | 1,280.8 | 197.08 /t milled | 2,061 |
Table 5 - LOM cash costs and AISC, base case (US$/oz sold)
| Component | US$/oz |
| Total operating cost | 2,061 |
| Refining, transport and selling | 32 |
| Royalty ( | 90 |
| Total cash cost¹ | 2,183 |
| Sustaining capital and closure | 105 |
| AISC¹ | 2,288 |
| Non-sustaining capital | 89 |
| All-in cost (AIC)¹ | 2,377 |
Per ounce sold, World Gold Council basis. No corporate G&A allocated; no by-product credits. ¹ Non-GAAP measure.
Taxes
The economic analysis includes Manitoba mining tax (graduated rates of
Sensitivity Analysis
The after-tax NPV5% and IRR were tested for changes of ±
Table 6 - After-tax sensitivity to key variables (change from base case)
| Variable | - | - | Base | + | + |
| After-tax NPV @ | |||||
| Gold price | 5.0 | 96.7 | 180.6 | 257.2 | 336.3 |
| Recovered gold (grade / recovery) | 7.3 | 97.6 | 180.6 | 256.3 | 334.8 |
| Operating cost | 288.0 | 234.0 | 180.6 | 122.1 | 60.5 |
| Capital cost | 192.6 | 186.3 | 180.6 | 173.8 | 167.0 |
| After-tax IRR | |||||
| Gold price | |||||
| Recovered gold (grade / recovery) | |||||
| Operating cost | |||||
| Capital cost | |||||
For cost variables, "+" is a cost increase. The +
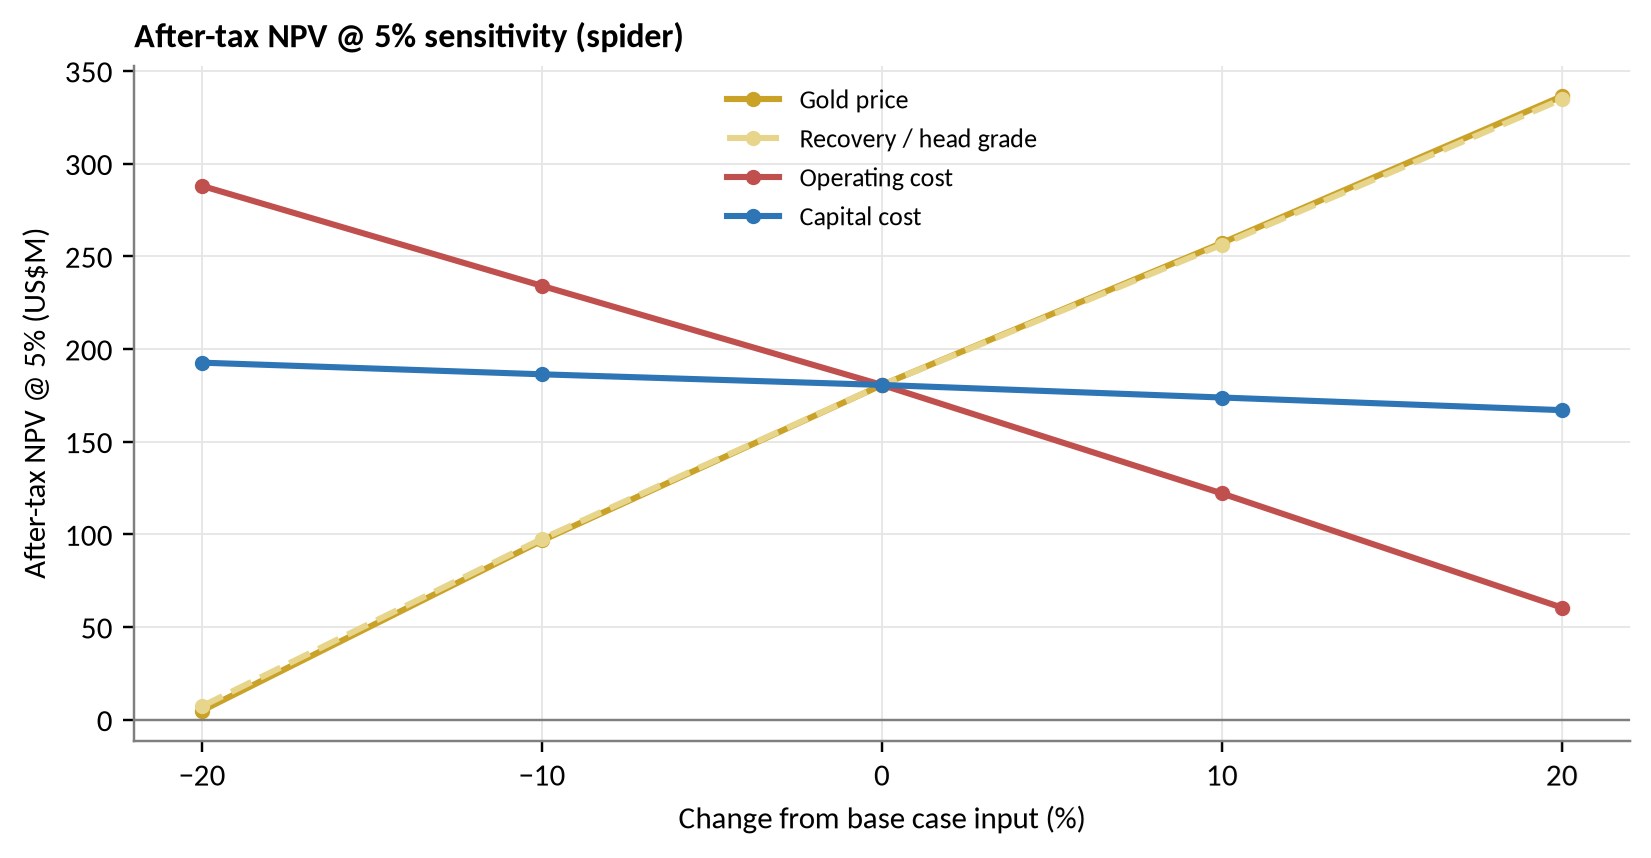
Figure 4: After-tax NPV5% sensitivity (US$M)
To view an enhanced version of this graphic, please visit:
https://images.newsfilecorp.com/files/3654/319014_0a4eaeb564451948_004full.jpg
Table 7 - After-tax sensitivity to gold price
| Gold price (US$/oz) | 2,500 | 2,750 | 3,000 (base) | 3,250 | 3,500 | 3,750 | 4,000 | 4,250 | 4,500 |
| After-tax NPV @ | 39 | 111 | 181 | 244 | 311 | 374 | 439 | 504 | 569 |
| After-tax IRR | |||||||||
| Payback (years) | 1.09 | 0.81 | 0.68 | 0.61 | 0.54 | 0.49 | 0.45 | 0.41 | 0.38 |
| LOM after-tax FCF (US$M) | 52 | 151 | 248 | 335 | 428 | 515 | 605 | 695 | 784 |
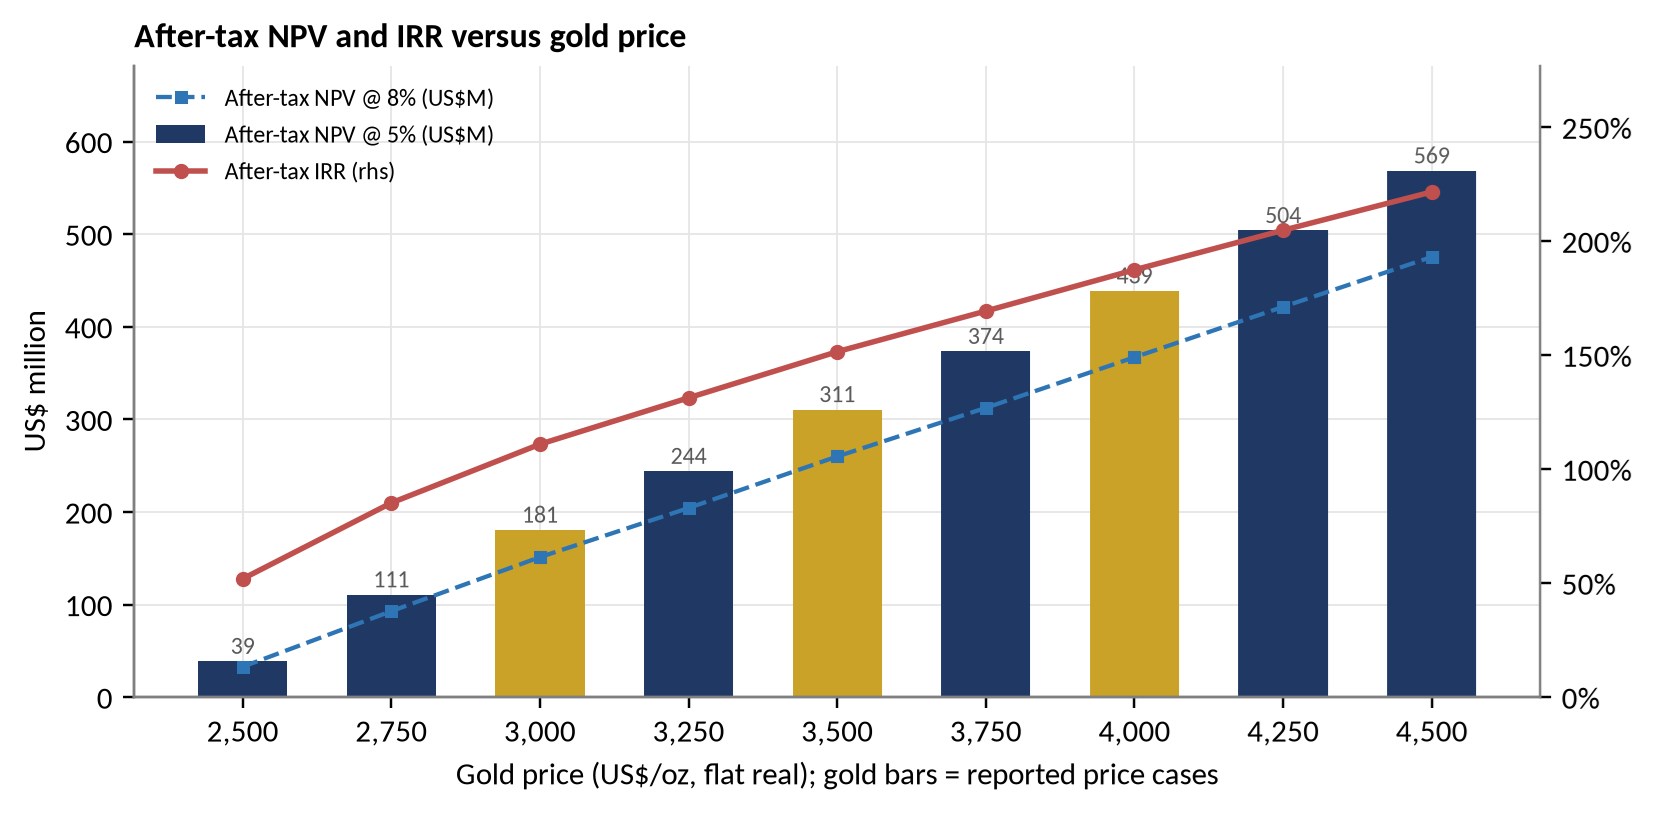
Figure 5: After-tax NPV and IRR versus gold price
To view an enhanced version of this graphic, please visit:
https://images.newsfilecorp.com/files/3654/319014_0a4eaeb564451948_005full.jpg
Mineral Resource Estimate
The PEA is based on the 2026 MRE for the PL Gold Mine prepared by A&B Global Mining ("ABGM") under the supervision of Nicholas Ross King, BSc (Hons) Geology, GDE (Mining Engineering), Pr.Sci.Nat., as announced on September 10, 2026 and summarised in Table 8. The 2026 MRE uses a gold price of US
Table 8 - PL Gold Deposit Mineral Resource Estimate (effective date September 10, 2026)
| Category | Tonnes | Au grade (g/t) | Contained Au (oz) |
| PL Deposit - Open Pit: cut-off grade 0.60 g/t Au | |||
| Measured | 1,288,360 | 5.35 | 221,575 |
| Indicated | 289,750 | 4.99 | 46,516 |
| Measured & Indicated | 1,578,110 | 5.28 | 268,091 |
| Inferred | 118,689 | 5.75 | 21,955 |
| PL Deposit - Underground: cut-off grades 1.92 g/t and 1.43 g/t Au | |||
| Measured | 1,343,678 | 5.06 | 218,603 |
| Indicated | 835,239 | 4.26 | 114,464 |
| Measured & Indicated | 2,178,916 | 4.75 | 333,066 |
| Inferred | 1,548,443 | 3.63 | 180,855 |
| PL Deposit - Open Pit and Underground: cut-off grades 0.60 g/t, 1.92 g/t and 1.43 g/t Au | |||
| Measured | 2,632,038 | 5.20 | 440,178 |
| Indicated | 1,124,989 | 4.45 | 160,980 |
| Measured & Indicated | 3,757,026 | 4.98 | 601,158 |
| Inferred | 1,667,132 | 3.78 | 202,810 |
1. Mineral Resources are reported in accordance with the 2014 CIM Definition Standards. Mineral Resources that are not Mineral Reserves do not have demonstrated economic viability.
2. Open-pit Mineral Resources: cut-off grade of 0.60 g/t Au based on mining costs of US
3. Underground Mineral Resources: cut-off grade of 1.92 g/t Au for economic mineralisation within MSO shapes and 1.43 g/t Au for marginal mineralisation, based on mining costs of US
4. Mineral Resources are in-situ, incorporate a
5. The effective date of the 2026 MRE is September 10, 2026. The QPs are Nicholas Ross King for the Mineral Resource Estimate and Ettienne Jaques Oosthuizen for the geological model. Numbers may not sum due to rounding.
The PEA plant feed and recovered gold are derived from Measured, Indicated and Inferred Mineral Resources in the proportions specified in the PEA, after accounting for the applicable mining dilution and mining recovery assumptions.
PEA Cautionary Statement: The PEA is preliminary in nature. It includes Inferred Mineral Resources that are considered too speculative geologically to have the economic considerations applied to them that would enable them to be categorized as Mineral Reserves, and there is no certainty that the PEA will be realized. Mineral Resources that are not Mineral Reserves do not have demonstrated economic viability. The PEA is not a pre-feasibility or feasibility study, and no Mineral Reserves have been estimated. No production decision has been made, and any such decision would be made only after further studies, including a feasibility study, and financing and permitting.
Key Assumptions and Basis of the PEA
- Gold price: US
$3,000 /oz base case; US$3,500 /oz and US$4,000 /oz alternative cases (flat, real). - Exchange rate CAD:USD 0.74; real (unescalated) US dollars; cost base date is 14 October 2026.
- Royalty
3% of gross revenue, refining, transport and selling US$31.68 /oz; - Pre-production 2026-2027; production 2028-2037; closure 2038.
100% equity; no working capital or salvage value modelled. - Capital and operating cost estimates are at the PEA level, with an expected accuracy range of approximately ±
30% to ±50% .
Next Steps
- Update the 2026 MRE with outstanding assays from the 2025-2026 drill program and resampling, as part of the planned Pre-Feasibility Study.
- Advance metallurgical test work, including ore sorting of lower-grade material and modern gravity recovery.
- Obtain firm contractor pricing for open-pit and underground mining; advance power supply (LNG and grid connection) arrangements.
- Prepare a costed closure plan and complete a detailed tax review.
- Continue drilling of the down-dip extensions below 200 m and at the Nokomis satellite deposit.
- Advance permitting activities and continue engagement with local communities in support of the Project's ongoing development.
NI 43-101 Technical Report
A technical report prepared in accordance with NI 43-101 supporting the PEA will be filed on SEDAR+ (www.sedarplus.ca) and on the Company's website within 45 days of the date of this news release.
Qualified Persons
The scientific and technical information in this news release relating to the Preliminary Economic Assessment (PEA) has been reviewed and approved by the following independent Qualified Persons of A&B Global (Pty) Ltd., South Africa, as defined under National Instrument 43-101 - Standards of Disclosure for Mineral Projects ("NI 43-101"). Each Qualified Person is responsible for the corresponding sections of the PEA:
- Ettienne Jaques Oosthuizen, Principal Mining Consultant, B. Tech. (Mining Engineering) - mining methods, mine plan, capital and operating costs
- Ettienne Jaques Oosthuizen, Principal Mining Consultant - economic analysis
- Gordon Ian Cunningham, Associate Principal Process Engineer, B. Eng. (Chemical Engineering) - metallurgy and recovery methods
- Nicholas Ross King, BSc (Hons) Geology, GDE (Mining Engineering) - 2026 Mineral Resource Estimate
Non-GAAP Financial Measures
This news release refers to total cash cost, AISC, all-in cost (AIC) and free cash flow, which are non-GAAP financial measures or ratios. These measures have no standardized meaning under IFRS and may not be comparable to similar measures presented by other issuers. Total cash cost per ounce comprises on-site mining, processing, G&A and community costs, refining, transport and selling costs and royalties, divided by payable ounces. AISC adds sustaining capital and closure costs; AIC adds non-sustaining capital. Free cash flow is net revenue, less operating costs, capital expenditures and taxes. As the Project is not in production, the prospective non-GAAP measures cannot be reconciled to the nearest comparable IFRS measures.
About Minnova Corp.
Minnova Corp. is a near-term gold producer focused on the restart and expansion of its
For more information please contact:
Minnova Corp.
Gord Glenn, President & Chief Executive Officer
For further information, please contact Investor Relations at: info@minnovacorp.ca
Visit our website at www.minnovacorp.ca
Forward-Looking Statements
This news release contains "forward-looking information" within the meaning of applicable Canadian securities legislation. Forward-looking information includes, but is not limited to, statements regarding the results of the PEA, including NPV, IRR, payback, production, grades, recoveries, capital and operating costs, AISC, cash flows and taxes; the timing of first production in 2028 and of the mine plan; the planned processing rate; the filing of the technical report; the planned Pre-Feasibility Study, drilling, test work and resource updates; and management's assessment of future plans and operations. Forward-looking information is based on assumptions, including gold prices, exchange rates, costs, the availability of financing, permits, power, labour and contractors, and the accuracy of Mineral Resource estimates and PEA assumptions, and involves risks associated with mining exploration and development, volatility of prices, currency fluctuations, uncertainties inherent in Mineral Resource estimates and preliminary economic assessments, environmental and permitting risks, access to labour and services, competition from other companies and the ability to access sufficient capital. As a consequence, actual results may differ materially from those anticipated. A feasibility study has not been completed and there is no certainty that the development objectives will be achieved or that the proposed operations will be economically viable. Although Minnova has attempted to identify important factors that could cause actual results to differ materially, there may be other factors that cause results not to be as anticipated, estimated or intended. Readers should not place undue reliance on forward-looking information. Minnova does not undertake to update any forward-looking information, except in accordance with applicable securities laws.
Neither TSX Venture Exchange nor its Regulation Services Provider (as that term is defined in the policies of the TSX Venture Exchange) accepts responsibility for the adequacy or accuracy of this release.
NOT FOR DISSEMINATION INTO THE UNITED STATES

To view the source version of this press release, please visit https://www.newsfilecorp.com/release/319014
FAQ
AI-generated questions and answers. How Rhea-AI works. Not financial advice.
What are the base-case economics of Minnova's PL Gold Mine restart?
At US$3,000/oz gold, the assessment projects US$180.6 million after-tax net present value at a 5% discount rate, a 111% internal rate of return and 0.68-year payback from the start of production. These are preliminary project estimates, not achieved operating results.
When does Minnova plan to restart gold production at PL?
Minnova plans to begin production in 2028, initially using high-grade open-pit feed. Underground mining is expected to begin in mid-2028 and supply all mill feed from 2031 through 2037. No production decision has been made; further work, including a feasibility study, financing and permitting, is required.
What mineral resources underpin Minnova's PL Gold Mine assessment?
The assessment uses the resource estimate effective September 10, 2026, containing 601,158 ounces of measured and indicated gold and 202,810 ounces of inferred gold. The measured and indicated resource comprises 3,757,026 tonnes grading 4.98 grams of gold per tonne; the inferred resource comprises 1,667,132 tonnes grading 3.78 grams per tonne.
What power supply does Minnova plan for the PL Gold Mine restart?
The operating-cost plan uses LNG-fuelled generators for the first three years and grid power from 2031. Sustaining capital includes 5 MW and 9 MW generators for site power before grid connection.
What assumptions are used to calculate Minnova's PL project valuation?
The valuation uses real, unescalated US dollars, a 100% equity basis and a CAD:USD exchange rate of 0.74. Net present value is discounted to the start of 2026 using end-of-year discounting. Payback is measured from the start of production in 2028.