BuildDirect Reports Third Quarter 2025 Financial Results
Rhea-AI Summary
BuildDirect (OTCQB: BDCTF) reported Q3 2025 revenue of $18.1M, up 6.5% YoY, with gross margin of 38.9% (up 60 bps). The company delivered adjusted EBITDA of $0.97M, a 23.2% YoY increase, marking its 15th consecutive quarter of positive adjusted EBITDA. Working capital rose by $5.9M to $8.6M at September 30, 2025. BuildDirect completed a C$7.0M capital raise and plans to accelerate Pro Center expansion, integrate recent acquisitions, and invest in e-commerce and operational efficiencies.
The company will host its Q3 2025 results call on November 27, 2025 at 10:30 AM PST / 1:30 PM EST.
AI-generated analysis. How Rhea-AI works. Not financial advice.
Positive
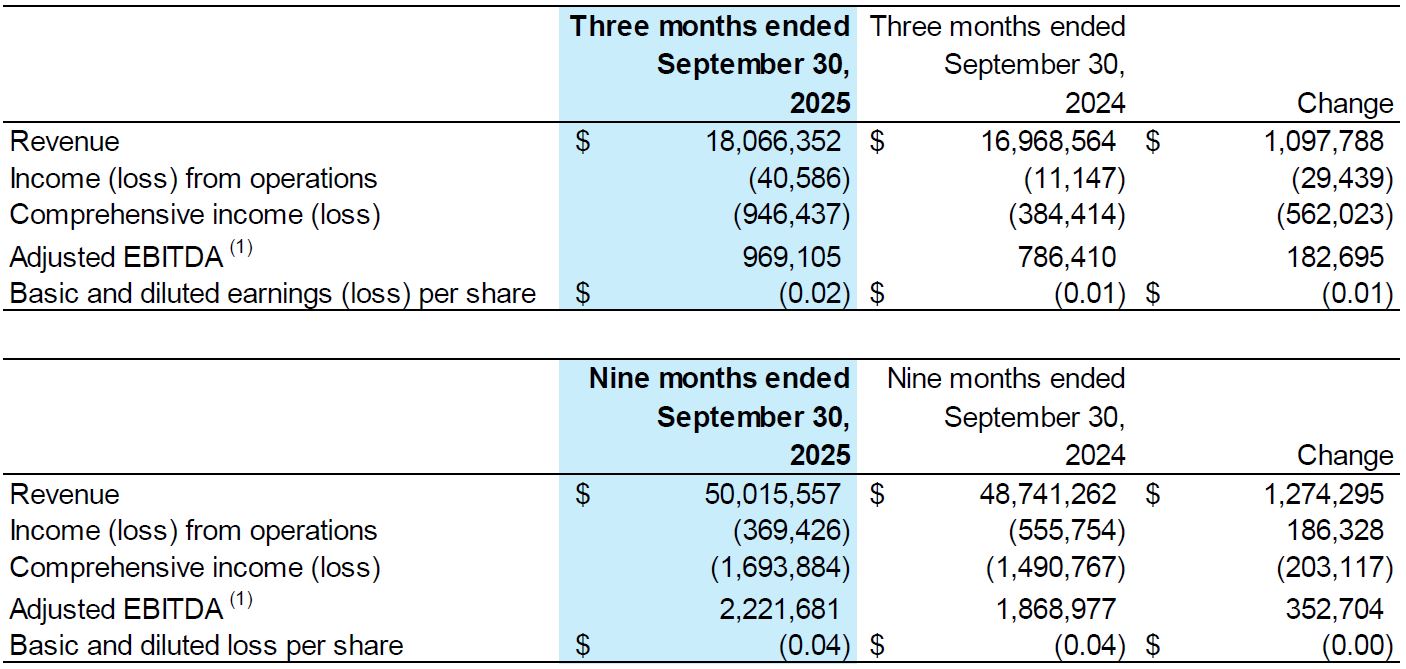
- Revenue of $18.1M in Q3 2025 (+6.5% YoY)
- Adjusted EBITDA of $0.97M in Q3 2025 (+23.2% YoY, 15 consecutive positive quarters)
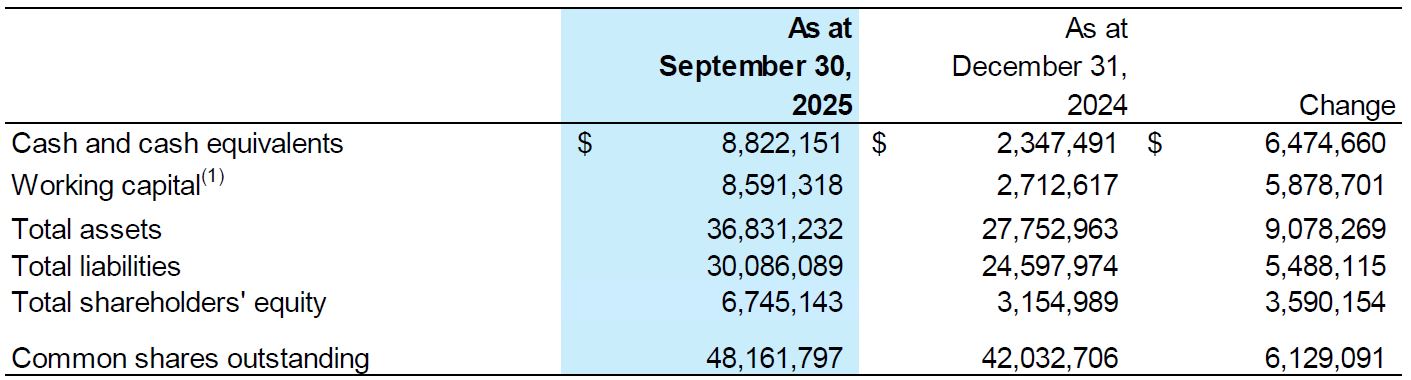
- Working capital increased by $5.9M to $8.6M at Sept 30, 2025
- Completed a C$7.0M capital raise to support growth
Negative
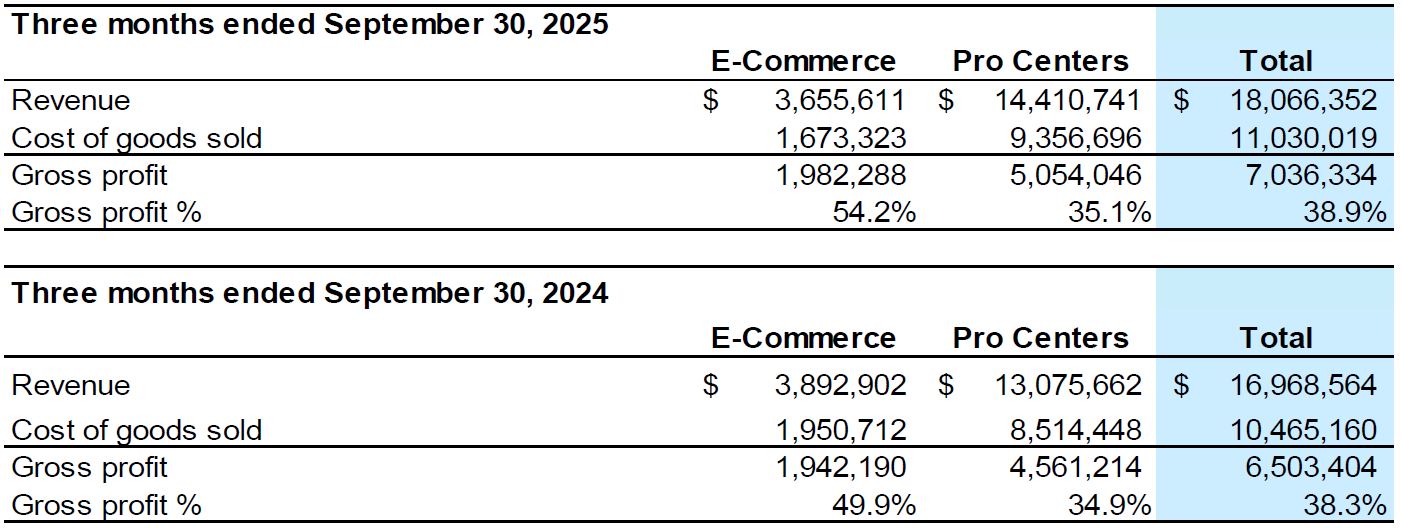
- E-commerce mix fell to 20% of sales in Q3 2025 (from 23% in Q3 2024)
- Revenue growth was modest at 6.5% YoY in Q3 2025
News Market Reaction – BDCTF
On the day this news was published, BDCTF declined 2.26%, reflecting a moderate negative market reaction.
Data tracked by StockTitan Argus on the day of publication.
Key Figures
Historical Context
| Date | Event | Sentiment | 24h Move | Catalyst |
|---|---|---|---|---|
| Aug 28 | Quarterly earnings | Positive | +1.4% | Q2 2025 revenue and margin growth with continued positive adjusted EBITDA. |
| Aug 11 | Listing update | Positive | +1.9% | U.S. OTCQB listing aimed at increasing visibility and capital access. |
24h Move is the share-price change in the day after each event; other market factors may also have contributed.
Recent earnings and listing-related news both saw modest positive price reactions, suggesting the stock has historically responded constructively to operational and capital markets milestones.
This announcement continues a 2025 pattern of operational progress and capital markets activity. In Q2 2025, BuildDirect reported revenue growth, improved gross margin, and its 14th consecutive quarter of positive adjusted EBITDA, alongside a C$7M financing to support expansion. On Aug 11, the company gained a U.S. OTCQB listing to broaden investor access. The current Q3 2025 update extends revenue growth, margin stability, and positive adjusted EBITDA, reinforcing the multi-quarter profitability streak.
Key Terms
ifrs accounting standards regulatory
adjusted ebitda financial
non-ifrs measures financial
AI-generated analysis. How Rhea-AI works. Not financial advice.
- Revenue of
$18.1M in Q3 2025, an increase of6.5% from$17.0M in Q3 2024. - Gross margin of
38.9% in Q3 2025, an increase of 60 bps from38.3% in Q3 2024. - Delivered
$0.97M in adjusted EBITDA in Q3 2025, an increase of23.2% from$0.79M in Q3 2024, extending the Company's track record to 15 straight quarters of positive performance. - Working capital increased by
$5.9M to$8.6M at September 30, 2025. - Company to host Third Quarter 2025 financial results conference call on Thursday, November 27, 2025 at 10:30 AM (PST) / 1:30 PM (EST).
BuildDirect reports in US dollars and in accordance with IFRS Accounting Standards.
Vancouver, British Columbia--(Newsfile Corp. - November 27, 2025) - BuildDirect.com Technologies Inc. (TSXV: BILD) (OTCQB: BDCTF) ("BuildDirect" or the "Company") a leading omnichannel building material retailer, today announced its financial results for the Third Quarter Ended September 30, 2025 ("Q3 2025").
"Q3 2025 was another step forward in strengthening BuildDirect's operating model, with revenue up
Shawn added, "With a stronger balance sheet and the successful C
BuildDirect Third Quarter 2025 Financial Results Conference Call
Date: Thursday, November 27, 2025
Time: 10:30 AM (PST) / 1:30 PM (EST)
Live Webinar: https://us02web.zoom.us/webinar/register/WN_7WpK4ILVQGq4DkGtCCE-NQ
The replay will be available approximately 24 hours after the completion of the conference call. In addition, an archived replay will be available on the Investor Relations section of the Company's website at https://ir.builddirect.com/financials/quarterly-results/.
Among other things, the Company will discuss the long-term financial outlook on the conference call and related materials will be available on the Company's website at https://ir.builddirect.com/financials/quarterly-results/. Investors should carefully review the factors, assumptions, risks, and uncertainties included in such related materials concerning the long-term financial outlook.
Third Quarter 2025 Financial Highlights
A. Financial Position
The following table summarizes the Company's financial position at September 30, 2025 and December 31, 2024.
To view an enhanced version of this graphic, please visit:
https://images.newsfilecorp.com/files/7497/276162_table1.jpg
1A non-IFRS measure. See "Non-IFRS measures" for definitions and reconciliation of non-IFRS measures to the relevant IFRS Accounting Standards.
B. Financial Results
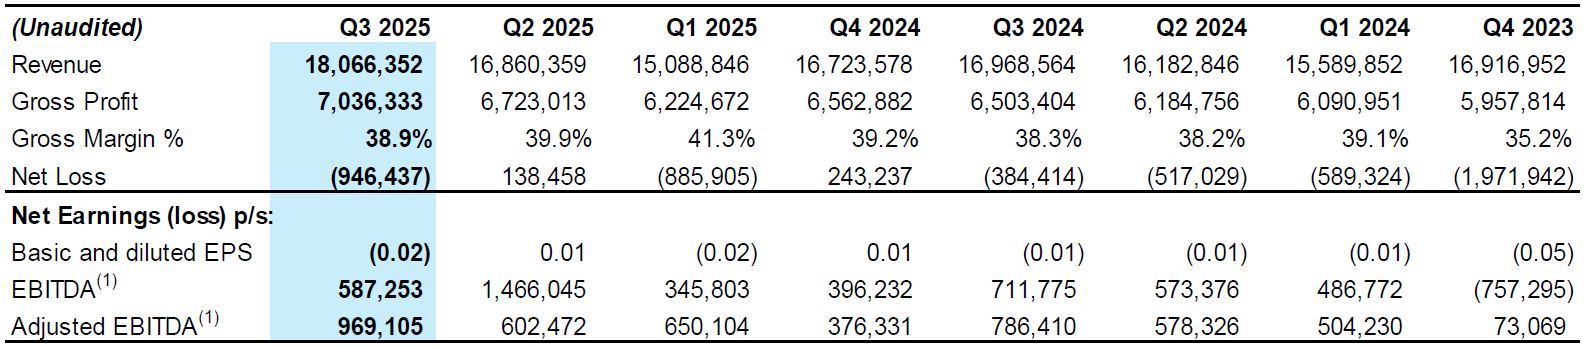
The following table summarizes the Company's selected financial results for the three months and nine months ended September 30, 2025 and 2024.
To view an enhanced version of this graphic, please visit:
https://images.newsfilecorp.com/files/7497/276162_table2and3.jpg
C. Revenue and Gross Profit per Segment
The Company reports results in two segments: (1) E-Commerce and (2) Pro Centers. We measure each reportable operating segment's performance based on revenue. The E-Commerce segment relates to our online platform while the Pro Center segment includes sales and installation revenue from brick and mortar locations.
The E-Commerce and Pro Center segments contributed
The following table summarizes revenue and gross profit per Segment for Q3 2025 and Q3 2024:
To view an enhanced version of this graphic, please visit:
https://images.newsfilecorp.com/files/7497/276162_table3and4.jpg
D. Working Capital
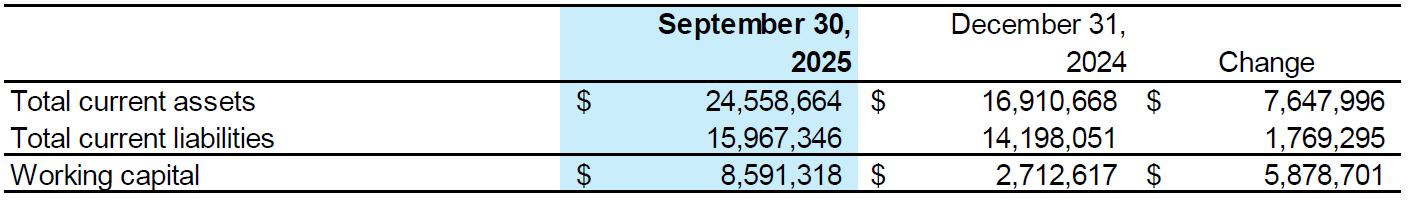
To view an enhanced version of this graphic, please visit:
https://images.newsfilecorp.com/files/7497/276162_table5.jpg
E. Quarterly Financial Information
To view an enhanced version of this graphic, please visit:
https://images.newsfilecorp.com/files/7497/276162_table6.jpg
1A non-IFRS measure. See "Non-IFRS measures" for definitions and reconciliation of non-IFRS measures to the relevant IFRS Accounting Standards.
2025/2026 Outlook
BuildDirect plans to continue strengthening revenue, margins, and cash flow as it scales its Pro Center network, grows its profitable E-commerce segment, and enhances operational efficiency. The Company is focused on expanding its footprint through acquisitions and new locations, advancing its digital capabilities, and fully integrating recent acquisitions to capture synergies and reinforce its position as a leading omni-channel flooring provider in North America.
Pro Center Expansion: The Company plans to grow its Pro Center network through targeted acquisitions and new builds, supported by standardized operating procedures and upgraded infrastructure.
Profitable E-Commerce Growth: BuildDirect plans to enhance its website, improve in-stock levels, strengthen digital marketing, and continue routing fulfillment through Pro Centers to improve margins.
Operational Efficiency: The Company plans to drive further efficiency through shared services, disciplined procurement, and unified inventory systems.
Integration Synergies: The Company plans to realize additional revenue and margin benefits from integrating Anchor & Yorkshore, the California Pro Center, and other operational improvements.
About BuildDirect
BuildDirect (TSXV: BILD) (OTCQB: BDCTF) is an expanding omnichannel building materials retailer, specializing in Pro Centers-strategic distribution hubs designed to serve professional contractors and trades. The Company is actively scaling its footprint through a combination of organic growth and strategic acquisitions, driving efficiency and market expansion. For more information, visit www.BuildDirect.com.
Forward-Looking Information:
This press release contains statements which constitute "forward-looking statements" and "forward-looking information" within the meaning of applicable securities laws (collectively, "forward-looking statements"), including statements regarding the plans, intentions, beliefs and current expectations of the Company with respect to future business activities and operating performance. Forward-looking statements are often identified by the words "may", "would", "could", "should", "will", "intend", "plan", "anticipate", "believe", "estimate", "expect" or similar expressions. These statements reflect management's current beliefs and expectations and are based on information currently available to management as at the date hereof.
Forward-looking statements in this press release may include, without limitation, statements relating to BuildDirect being in a strong position to keep building; BuildDirect's ongoing pursuit of a model focused on growing the Pro Center network, creating operating leverage and staying disciplined on returns; the Company building or acquiring strong locations, expanding its commercial reach, and growing EBITDA through better execution; the Company's acceleration of growth through the exploration of a combination of new location builds and targeted strategic acquisitions; the Company's expansion of its geographic footprint, deepening supplier relationships, and enhancing its service capabilities for professional customers; the Company's delivery of strong returns and capturing market share in both core and emerging regions; the Company's focus on driving EBITDA growth through improved operational efficiency and the continued development of its commercial sales channel; the Company being well-positioned to scale profitably while maintaining a high standard of customer service; and BuildDirect's unwavering commitment to pursue sustainable growth, operational excellence, and long-term value creation for its stakeholders.
Forward-looking statements involve significant risk, uncertainties and assumptions. Many factors could cause actual results, performance or achievements to differ materially from the results discussed or implied in the forward-looking statements. Among those factors are changes in consumer spending, inflation, availability of mortgage financing and consumer credit, changes in the housing market, changes in trade policies, tariffs or other applicable laws and regulations both locally and in foreign jurisdictions, availability and cost of goods from suppliers, fuel prices and other energy costs, interest rate and currency fluctuations, retention of key personnel and changes in general economic, business and political conditions and other factors referenced under the "Risks and Uncertainties" section of our MD&A. These forward-looking statements may be affected by risks and uncertainties in the business of the Company and general market conditions.
These factors should be considered carefully, and readers should not place undue reliance on the forward-looking statements. Although the forward-looking statements contained in this press release reflect the Company's expectations, estimates or projections concerning future results or events based on the opinions, assumptions and estimates of management considered reasonable at the date the statements are made, the Company cannot assure readers that actual results will be consistent with these forward-looking statements. These forward-looking statements are made as of the date of this press release, and BuildDirect assumes no obligation to update or revise them to reflect new events or circumstances, except as required by law.
NON-IFRS MEASURES
This announcement refers to certain non-IFRS measures. These measures are not recognized measures under IFRS, and do not have a standardized meaning prescribed by IFRS Accounting Standards and are therefore unlikely to be comparable to similar measures presented by other companies. Rather, these measures are provided as additional information to complement those IFRS Accounting Standards measures by providing further understanding of our results of operations from management's perspective. Accordingly, these measures should not be considered in isolation nor as a substitute for analysis of our financial information reported under IFRS Accounting Standards. We use non-IFRS measures including "EBITDA" and "Adjusted EBITDA". Management uses these non-IFRS measures to facilitate operating performance comparisons from period to period, to prepare annual operating budgets and forecasts, and to determine components of management compensation. As required by Canadian securities laws, we reconcile these non-IFRS measures to the most comparable IFRS Accounting Standards measures in this announcement. See below regarding definitions and reconciliation of these non-IFRS measures to the relevant reported measures.
We define EBITDA as net income or loss before interest, income taxes and amortization. Adjusted EBITDA removes fair value adjustments to warrants or inventory and share-based compensation determined by option pricing models. Non-recurring items, such as restructuring costs, bad debt expense, finance fees or government grants are removed. Similarly, foreign exchange gains/losses and gains/losses on disposal of assets are excluded. We are presenting these measures because we believe that our current and potential investors, and many analysts, use them to assess our current and future operating results and to make investment decisions. Management uses these measures in managing the business and making decisions. EBITDA and adjusted EBITDA are not intended as substitutes for IFRS measures.
EBITDA and Adjusted EBITDA for the three months ended September 30, 2025, and 2024
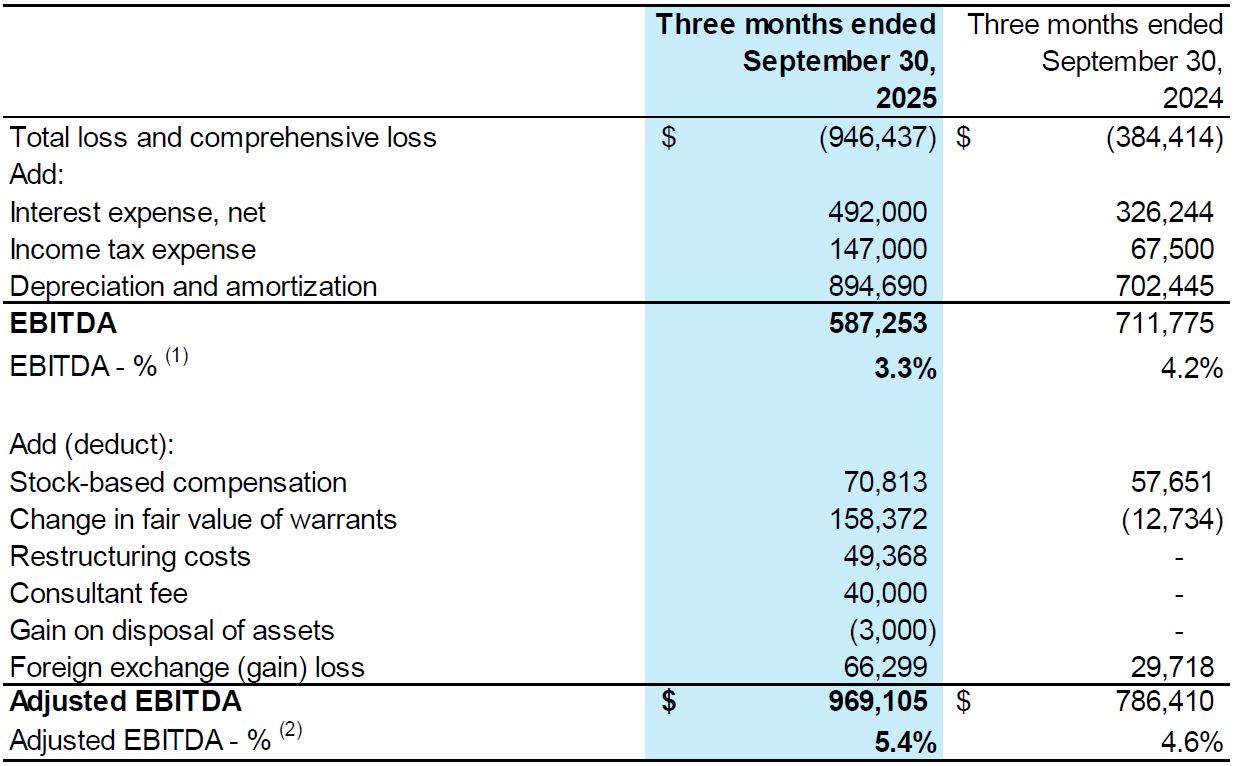
To view an enhanced version of this graphic, please visit:
https://images.newsfilecorp.com/files/7497/276162_table7.jpg
(1) EBITDA % is a ratio of EBITDA divided by Total Revenue
(2) Adjusted EBITDA % is a ratio of Adjusted EBITDA divided by Total Revenue
EBITDA and Adjusted EBITDA for the nine months ended September 30, 2025, and 2024
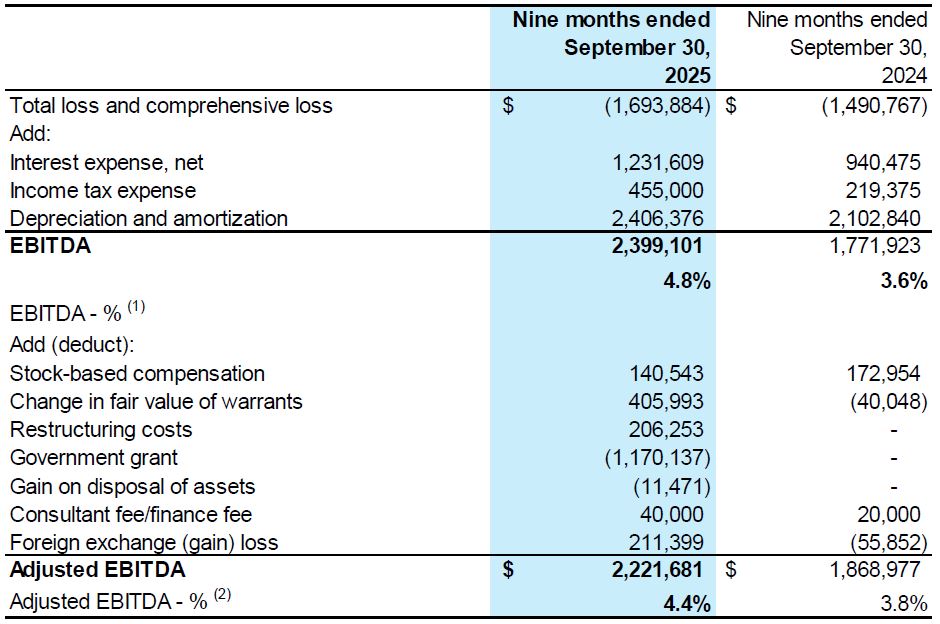
To view an enhanced version of this graphic, please visit:
https://images.newsfilecorp.com/files/7497/276162_table8.jpg
(1) EBITDA % is a ratio of EBITDA divided by Total Revenue
(2) Adjusted EBITDA % is a ratio of Adjusted EBITDA divided by Total Revenue
Neither TSX Venture Exchange nor its Regulation Services Provider (as that term is defined in policies of the TSX Venture Exchange) accepts responsibility for the adequacy or accuracy of this release.
For further information:
Shawn Wilson, CEO
shawnwilson@builddirect.com
BuildDirect Investor Relations
ir@builddirect.com
Condensed Consolidated Interim Statements of Financial Position
(Unaudited)
(Expressed in United States dollars)
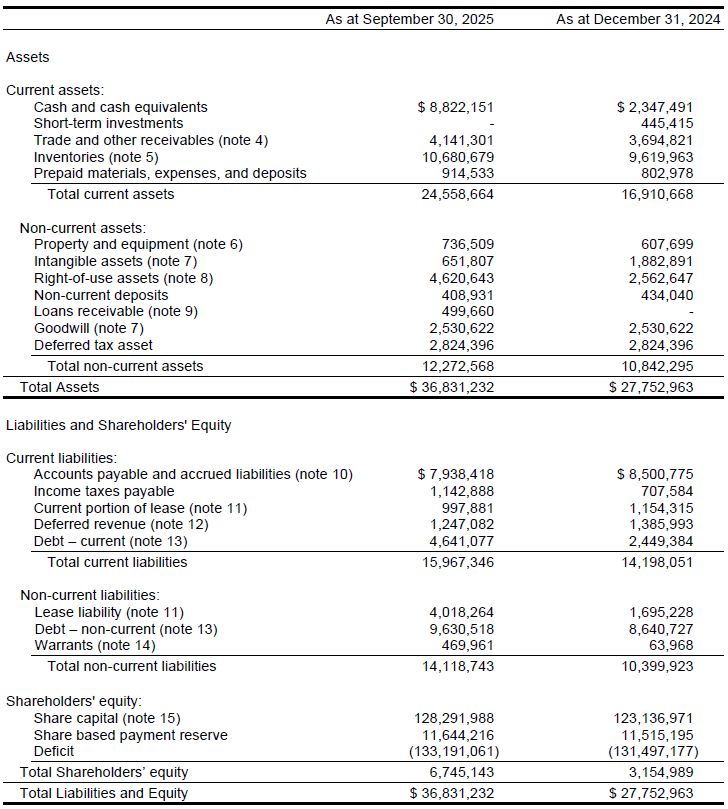
To view an enhanced version of this graphic, please visit:
https://images.newsfilecorp.com/files/7497/276162_table9.jpg
Condensed Consolidated Interim Statements of Operations and Comprehensive Loss
(Unaudited)
(Expressed in United States dollars)
| For the three months ended | For the nine months ended | |||||||||||||
| September 30 | September 30 | |||||||||||||
| 2025 | 2024 | 2025 | 2024 | |||||||||||
| Revenue (note 16) | $ | 18,066,352 | $ | 16,968,564 | $ | 50,015,557 | $ | 48,741,262 | ||||||
| Cost of goods sold (note 5) | 11,030,019 | 10,465,160 | 30,031,539 | 29,962,151 | ||||||||||
| Gross Profit | 7,036,333 | 6,503,404 | 19,984,018 | 18,779,111 | ||||||||||
| Operating expenses: | ||||||||||||||
| Fulfillment costs | 941,622 | 916,051 | 2,742,600 | 2,921,603 | ||||||||||
| Selling and marketing | 1,483,825 | 1,425,072 | 4,365,102 | 4,172,207 | ||||||||||
| Administration | 3,756,782 | 3,470,983 | 10,839,366 | 10,138,215 | ||||||||||
| Depreciation and amortization | 894,690 | 702,445 | 2,406,376 | 2,102,840 | ||||||||||
| 7,076,919 | 6,514,551 | 20,353,444 | 19,334,865 | |||||||||||
| Profit (loss) from operations | (40,586 | ) | (11,147 | ) | (369,426 | ) | (555,754 | ) | ||||||
| Other income (expense): | ||||||||||||||
| Interest income | 2,168 | 5,771 | 18,496 | 43,147 | ||||||||||
| Interest expense | (494,169 | ) | (332,015 | ) | (1,250,106 | ) | (983,622 | ) | ||||||
| Rental income | 4,188 | 37,461 | 4,188 | 148,937 | ||||||||||
| Fair value adjustment of warrants (note 14) | (158,372 | ) | 12,734 | (405,993 | ) | 40,048 | ||||||||
| Government grant (note 22) | - | - | 1,170,137 | - | ||||||||||
| Restructuring costs (note 21) | (49,368 | ) | - | (206,253 | ) | - | ||||||||
| Finance fee | - | - | - | (20,000 | ) | |||||||||
| Foreign exchange gain (loss) | (66,299 | ) | (29,718 | ) | (211,399 | ) | 55,852 | |||||||
| Gain on disposal of equipment | 3,000 | - | 11,471 | - | ||||||||||
| (758,851 | ) | (305,767 | ) | (869,458 | ) | (715,638 | ) | |||||||
| Income (loss) before income taxes | (799,437 | ) | (316,914 | ) | (1,238,884 | ) | (1,271,392 | ) | ||||||
| Income tax expense | (147,000 | ) | (67,500 | ) | (455,000 | ) | (219,375 | ) | ||||||
| Total income (loss) and comprehensive income (loss) for the period | (946,437 | ) | (384,414 | ) | (1,693,884 | ) | (1,490,767 | ) | ||||||
| Deficit, beginning of period | (132,244,624 | ) | (131,356,000 | ) | (131,497,177 | ) | (130,249,647 | ) | ||||||
| Deficit, end of period | $ | (133,191,061 | ) | $ | (131,740,414 | ) | $ | (133,191,061 | ) | $ | (131,740,414 | ) | ||
| Profit (loss) per share: | ||||||||||||||
| Basic and diluted profit (loss) per share (note 23) | (0.02 | ) | (0.01 | ) | (0.04 | ) | (0.04 | ) | ||||||
Condensed Consolidated Interim Statement of Changes in Equity (Deficiency)
(Unaudited)
(Expressed in United States dollars)
For the nine months ended September 30, 2025 and 2024
| Common Shares | Share based payment reserve | Deficit | Total | |||||||||||||
| Number | Amount | |||||||||||||||
| Balance - December 31, 2023 | 41,941,535 | $ | 123,109,599 | $ | 11,323,580 | $ | (130,249,647 | ) | $ | 4,183,532 | ||||||
| Exercise of deferred share units (note 15) | 91,171 | - | - | - | - | |||||||||||
| Exercise of stock options (note 15) | - | 27,372 | - | - | 27,372 | |||||||||||
| Loss and comprehensive loss for the period | - | - | - | (1,490,767 | ) | (1,490,767 | ) | |||||||||
| Share-based payment expense (note 15) | - | - | 172,954 | - | 172,954 | |||||||||||
| Balance - September 30, 2024 | 42,032,706 | 123,136,971 | 11,496,534 | (131,740,414 | ) | 2,893,091 | ||||||||||
| Balance - December 31, 2024 | 42,032,706 | $ | 123,136,971 | $ | 11,515,195 | $ | (131,497,177 | ) | $ | 3,154,989 | ||||||
| Exercise of stock options (note 15) | 41,918 | 28,057 | (11,522 | ) | - | 16,535 | ||||||||||
| Issuance of share capital, net (note 15) | 6,087,173 | 5,126,960 | - | - | 5,126,960 | |||||||||||
| Loss and comprehensive loss for the period | - | - | - | (1,693,884 | ) | (1,693,884 | ) | |||||||||
| Share-based payment expense (note 15) | - | - | 140,543 | - | 140,543 | |||||||||||
| Balance - September 30, 2025 | 48,161,797 | $ | 128,291,988 | $ | 11,644,216 | $ | (133,191,061 | ) | $ | 6,745,143 | ||||||
Condensed Consolidated Interim Statement of Cash Flows
(Unaudited)
(Expressed in United States dollars)
| For the three months ended | For the nine months ended | |||||||||||||
| September 30 | September 30 | |||||||||||||
| 2025 | 2024 | 2025 | 2024 | |||||||||||
| Cash provided by (used in): | ||||||||||||||
| Operating activities: | ||||||||||||||
| Income (loss) for the period | $ | (946,437 | ) | $ | (384,414 | ) | $ | (1,693,884 | ) | $ | (1,490,767 | ) | ||
| Add (deduct) items not affecting cash: | ||||||||||||||
| Depreciation | 894,690 | 702,445 | 2,406,376 | 2,102,840 | ||||||||||
| Income tax expense | 147,000 | 67,500 | 455,000 | 219,375 | ||||||||||
| Stock-based compensation expense | 70,813 | 57,651 | 140,543 | 172,953 | ||||||||||
| Gain on disposal of property and equipment | (3,000 | ) | - | (11,471 | ) | - | ||||||||
| Interest on capital leases | 117,567 | 24,360 | 191,813 | 86,310 | ||||||||||
| Other interest and finance cost | 281,328 | 303,662 | 826,183 | 874,157 | ||||||||||
| Amortization of financing costs (note 13) | 13,950 | - | 32,692 | - | ||||||||||
| Change in fair value of warrants (note 14) | 158,372 | (12,733 | ) | 405,993 | (40,047 | ) | ||||||||
| Unrealized foreign exchange | (63,185 | ) | 29,842 | 41,886 | (49,650 | ) | ||||||||
| Change in non-cash working capital (note 18) | (842,788 | ) | 264,163 | (1,123,621 | ) | 439,150 | ||||||||
| Income taxes paid | - | - | (19,696 | ) | (1,000 | ) | ||||||||
| Total operating activities | (171,691 | ) | 1,052,476 | 1,651,813 | 2,313,321 | |||||||||
| Investing activities: | ||||||||||||||
| Purchase of property and equipment (note 6) | (79,287 | ) | (49,218 | ) | (168,565 | ) | (98,147 | ) | ||||||
| Proceeds on disposal of equipment (note 6) | 3,000 | - | 25,500 | - | ||||||||||
| Acquisition of assets (note 3) | - | - | (593,396 | ) | - | |||||||||
| Payments on capital lease receivables | - | 49,007 | - | 191,709 | ||||||||||
| Total investing activities | (76,287 | ) | (211 | ) | (736,461 | ) | 93,562 | |||||||
| Financing activities: | ||||||||||||||
| Proceeds from exercise of options (note 15) | - | - | 16,535 | 27,372 | ||||||||||
| Proceeds from issuance of share capital (note 15) | 5,193,044 | - | 5,193,044 | - | ||||||||||
| Share issue costs (note 15) | (66,084 | ) | - | (66,084 | ) | - | ||||||||
| Deferred financing costs (note 13) | (21,257 | ) | - | (140,474 | ) | - | ||||||||
| Interest paid | (79,195 | ) | (63,576 | ) | (199,326 | ) | (250,334 | ) | ||||||
| Capital lease payments (note 11) | (493,296 | ) | (322,097 | ) | (1,165,924 | ) | (1,020,304 | ) | ||||||
| Promissory note repayment (note 13) | (311,250 | ) | (311,250 | ) | (933,750 | ) | (933,750 | ) | ||||||
| Deferred consideration repayment (note 13) | - | - | - | (675,000 | ) | |||||||||
| Loan receivable - advance (note 9) | - | - | (568,075 | ) | - | |||||||||
| Loan receivable - repayment (note 9) | 59,397 | - | 59,397 | - | ||||||||||
| Loans payable - advance (note 13) | 777,576 | 34,026 | 3,426,442 | 1,034,026 | ||||||||||
| Loans payable - repayment (note 13) | (59,769 | ) | (75,133 | ) | (62,477 | ) | (553,036 | ) | ||||||
| Total financing activities | 4,999,166 | (738,030 | ) | 5,559,308 | (2,371,026 | ) | ||||||||
| Increase (decrease) in cash and cash equivalents | 4,751,187 | 314,235 | 6,474,660 | 35,857 | ||||||||||
| Cash and cash equivalents, beginning | 4,070,963 | 2,323,515 | 2,347,491 | 2,601,893 | ||||||||||
| Cash and cash equivalents, end | $ | 8,822,151 | $ | 2,637,750 | $ | 8,822,151 | $ | 2,637,750 | ||||||
![]()
To view the source version of this press release, please visit https://www.newsfilecorp.com/release/276162