
Bank Hapoalim Announces First Quarter 2026 Results
Bank Hapoalim (OTC:BKHPF) reported first quarter 2026 results showing net profit of NIS 2,124 million and ROE of 13.0%, despite a special banks tax that reduced ROE by 130–140 bps annually.
Sentiment and the balance of points
Rhea-AI Sentiment reads the wording of the document, how positive or negative its language is on a 1 to 5 scale. The balance of points shown with the takes weighs what the document actually discloses, so the two can disagree, for example when a trial that missed its main goal is described in upbeat language.
Rhea-AI Summary
Bank Hapoalim (OTC:BKHPF) reported first quarter 2026 results showing net profit of NIS 2,124 million and ROE of 13.0%, despite a special banks tax that reduced ROE by 130–140 bps annually.
Credit grew 3.3% QoQ and 14.0% YoY; the NPL ratio fell to 0.44% with 330% coverage. Credit loss expenses were 0.03%. The Board approved a 50% payout: NIS 850 million dividend (NIS 0.65 per share) and NIS 212 million in buybacks.
Income from regular financing activity rose 2% QoQ; the financial margin edged up to 2.44%. Fee income increased 0.5% QoQ and 5.3% YoY. Expenses declined 10.3% QoQ (1.6% excluding a Q4 2025 one-off), with a cost-income ratio of 36.6%.
Net credit to the public reached NIS 519 billion and deposits NIS 603 billion. The CET1 ratio was 11.71%, above regulatory and internal targets, and LCR stood at 128%. The allowance for credit losses totaled NIS 8.9 billion, 1.68% of total credit.
Positive
- Net profit NIS 2,124m with 13.0% ROE in Q1 2026
- Credit portfolio up 3.3% QoQ and 14.0% YoY
- NPL ratio 0.44% with 330% coverage and 0.03% credit loss expense
- 50% payout: NIS 850m dividend and NIS 212m share buybacks
- Total expenses down 10.3% QoQ; cost-income ratio 36.6%
- CET1 ratio 11.71% vs 10.23% regulatory minimum and 11.0% internal target
Negative
- Special banks tax reduced ROE by approximately 130–140 bps annually
- Non-regular financing activity recorded a small loss in the quarter
- Two rate cuts since November reduced the average rate by about 40 bps vs Q4
Details
News Market Reaction – BKHYY
On May 14, the day this news came out, BKHYY closed 3.86% below the previous close.
Data tracked by StockTitan Argus for the May 14 session.
Key Figures
- Net profit
- NIS 2,124 million
- First quarter of 2026
- ROE
- 13.0%
- First quarter of 2026, including special banks tax impact
- Credit growth QoQ
- 3.3%
- Credit growth in the quarter
- Credit growth YoY
- 14.0%
- Year-over-year credit growth
- NPL ratio
- 0.44%
- Non-performing loans ratio, first quarter 2026
- Coverage ratio
- 330%
- Coverage ratio on credit portfolio
- CET-1 ratio
- 11.71%
- Common Equity Tier 1 vs 10.23% regulatory minimum and 11.0% internal target
- Cost-income ratio
- 36.6%
- First quarter 2026 operating efficiency metric
Key Terms
roe financial
npl ratio financial
credit loss expenses financial
cost-income ratio financial
cet-1 ratio financial
lcr financial
mark-to-market financial
AI-generated analysis. How Rhea-AI works. Not financial advice.




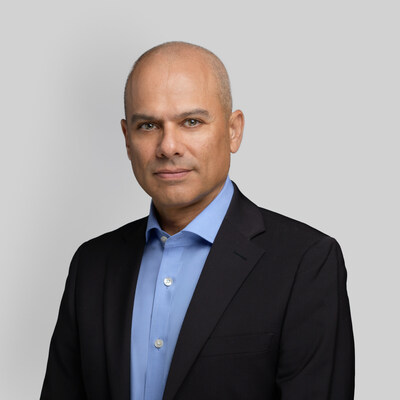
Yadin Antebi, CEO: "Bank Hapoalim's performance reflects the resilience and financial strength of the Israeli economy which has continued to show stability, even during the period of war. In the first quarter, the Bank continued to demonstrate strong business growth, while maintaining high credit quality. Looking ahead, Bank Hapoalim will continue to play a leading role in supporting
- Net profit in the quarter totaled
NIS 2,124 million , with ROE of13.0% . The results include the impact of a special banks tax, which reduced ROE by approximately 130–140 basis points, on an annual basis. Excluding this effect, ROE exceeded14% . - Credit growth remained strong and well diversified, increasing by
3.3% in the quarter and14.0% year-over-year, well above the Bank's target range. At the same time, credit quality metrics continued to improve, with the NPL ratio declining to0.44% and a high coverage ratio of330% . Credit loss expenses were low, at0.03% , supported by improved risk indicators and recoveries. - The Board of Directors declared a distribution of
50% of net profit, including a cash dividend of NIS 850 million,NIS 0.65 per share, and the remainder (NIS 212 million ) through share buybacks, in line with the Bank's payout target. - Income from regular financing activity increased by
2% quarter-over-quarter, supported by business growth and a less negative CPI impact. This was partly offset by two rate cuts since November, reducing the average rate by approximately 40 basis points versus Q4. Non-regular financing activity recorded a small loss. The reduction versus the previous quarter is mainly due to mark-to-market of shares and fair value adjustments on derivatives. - The financial margin remains a relative strength, rising slightly to
2.44% . While impacted by lower rates, the CPI effect was more moderate this quarter. - Fee income continued its steady upward trend, rising by
0.5% quarter-over-quarter and5.3% year-over-year, driven by higher activity in securities and credit-related services. - The Bank maintained strong cost discipline, with total expenses declining by
10.3% compared to the prior quarter. Excluding a one-off expense recorded in Q4 2025, expenses declined by1.6% . The cost-income ratio stood at36.6% . - On the balance sheet, net credit to the public reached NIS 519 billion, while deposits totaled
NIS 603 billion . Capital and liquidity ratios remain strong, with a CET-1 ratio of11.71% , well above the10.23% minimum regulatory requirement and11.0% minimum internal target. LCR stood at128% . - The allowance for credit losses stood at
NIS 8.9 billion as at March 31, 2026, of whichNIS 8.6 billion attributed to the collective allowance. The total allowance constitutes1.68% of total credit. - The Bank continues to benefit from the resilience of
Israel's economy and remains well positioned for continued growth across its core business segments. - The full report is available at the following link: https://www.bankhapoalim.com/en/investor-relations/financial-information/reports
Contact info:
Tamar Koblenz
Head of Investor Relations
Investor.Relations@poalim.co.il
Dr. Sharona Mazalian-Levi
Spokesperson
sml@poalim.co.il
This press release contains forward-looking statements, as defined in the Israeli Securities Law, relating to future events or future performance.
This press release is provided for convenience purposes only and does not constitute a substitute for a full review of the Bank's latest periodic/quarterly reports, as filed with the Israel Securities Authority.
Photo: https://mma.prnewswire.com/media/2978199/Yadin_Antebi.jpg
Logo: https://mma.prnewswire.com/media/2978200/Bank_Hapoalim_logo.jpg

 View original content to download multimedia:https://www.prnewswire.com/news-releases/bank-hapoalim-announces-first-quarter-2026-results-302772039.html
SOURCE Bank Hapoalim
FAQ
AI-generated questions and answers. How Rhea-AI works. Not financial advice.