Bowlero Corp. Announces Record-Breaking Results for the Second Quarter of Fiscal Year 2023
-
Revenue was a record-breaking
$273.4 million $68.2 million 33.2% , year-over-year, and$88.5 million 47.9% , relative to the corresponding pre-pandemic period.1 Same-store revenue increased$54.4 million 27.3% , year-over-year, and grew$53.9 million 30.2% , vs. the comparable pre-pandemic period.2 -
Net income in the second the quarter was
$1.4 million $30.8 million $32.2 million -
Adjusted EBITDA in the second quarter was
$97.0 million $30.2 million 45.2% , higher vs. the prior year's quarter, and$44.1 million 83.3% , higher relative to pre-pandemic performance. -
Trailing Twelve Month (TTM) Revenue was
$1.03 billion $151 million 17% higher than the corresponding projection provided in theDecember 2021 go-public transaction. -
TTM Adjusted EBITDA was
$353.0 million 34.3% margin and increased$158 million 80.8% compared to prior year TTM period. -
MoneyBowl™, the Company’s proprietary skill-based gamification app, is active in 37 centers as of
February 15, 2023 , which represents over11% of the center population. -
The Company added 8 new centers during the quarter. Total centers in operation as of
January 1, 2023 were 326. Subsequent to the quarter-end, the Company acquired an additional 1 center bringing the updated center count to 327, and signed leases for another 6 locations to be newly constructed.
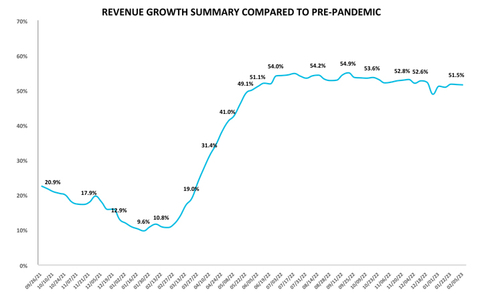
Bowling Center Trailing 13-week Revenue Growth Trend (Graphic: Business Wire)
"The Company’s second quarter top-line and bottom-line growth was extraordinary. The re-investment in our people that we made in the first quarter prepared us for a record holiday season that delivered on every facet. Event Revenue continued to drive revenue growth with event sales up
Second-Quarter 2023 Operating Results
Tremendous growth in Revenue during the second quarter, totaling
Net income for the quarter was
Financial Position
As of
Share Repurchase Program
The Company repurchased 629,677 shares of Class A common stock during the second quarter at an average price of
Bowling Center Trailing 13-week Revenue Growth Trend3
[Please see the Bowling Center Trailing 13-week Revenue Growth Trend Chart]
Investor Webcast Information
Listeners may access an investor webcast hosted by
About
Forward Looking Statements
Some of the statements contained in this press release are forward-looking statements within the meaning of Section 27A of the Securities Act of 1933, as amended, and Section 21E of the Securities Exchange Act of 1934, as amended. These forward-looking statements are generally identified by the use of words such as "anticipate," "believe," "could," "estimate," "expect," "intend," "may," "plan," "potential," "predict," "project," "should," "target," "will," "would" and, in each case, their negative or other various or comparable terminology and include preliminary results. These forward-looking statements reflect our views with respect to future events as of the date of this release and are based on our management’s current expectations, estimates, forecasts, projections, assumptions, beliefs and information. Although management believes that the expectations reflected in these forward-looking statements are reasonable, it can give no assurance that these expectations will prove to have been correct. All such forward-looking statements are subject to risks and uncertainties, many of which are outside of our control, and could cause future events or results to be materially different from those stated or implied in this document. It is not possible to predict or identify all such risks. These risks include, but are not limited to: the impact of COVID-19 or other adverse public health developments on our business; our ability to grow and manage growth profitably, maintain relationships with customers, compete within our industry and retain our key employees; changes in consumer preferences and buying patterns; the possibility that we may be adversely affected by other economic, business, and/or competitive factors; the risk that the market for our entertainment offerings may not develop on the timeframe or in the manner that we currently anticipate; general economic conditions and uncertainties affecting markets in which we operate and economic volatility that could adversely impact our business, including the COVID-19 pandemic and other factors described under the section titled “Risk Factors” in the Company's Annual Report on Form 10-K filed with the
Non-GAAP Financial Measures
To provide investors with information in addition to our results as determined under Generally Accepted Accounting Principles (“GAAP”), we disclose net income, normalized for extraordinary and non-recurring items, cash generated from Adjusted Operating Activities, net, Adjusted EBITDA, and trailing twelve month Adjusted EBITDA as “non-GAAP measures” that management believes provide useful information to investors because each measure assists both investors and management in analyzing and benchmarking the performance and value of our business. Accordingly, management believes that these measurements are useful for comparing general operating performance from period to period, and management relies on these measures for planning and forecasting of future periods. Additionally, these measures allow management to compare our results with those of other companies that have different financing and capital structures. These measures are not financial measures calculated in accordance with GAAP and should not be considered as a substitute for revenue, net income, net cash provided (used) by operating activities or any other operating performance or liquidity measure calculated in accordance with GAAP, and may not be comparable to a similarly titled measure reported by other companies.
Net income normalized for extraordinary and non-recurring items represents Net income (loss) before non-cash expenses or income related to Changes in the value of earnouts and warrants. Cash generated from Adjusted Operating Activities, net represents Net cash provided by operating activities before cash interest. Adjusted EBITDA represents Net income (loss) before Interest, Income Taxes, Depreciation and Amortization, Share-based Compensation, EBITDA from Closed Centers, Foreign Currency Exchange Loss (Gain), Asset Disposition Loss (Gain), Transactional and other advisory costs, Charges attributed to new initiatives, Extraordinary unusual non-recurring gains or losses and Changes in the value of earnouts and warrants and settlement costs. Trailing twelve month Adjusted EBITDA represents Adjusted EBITDA over the most recent twelve month period.
The Company considers net income normalized for extraordinary and non-recurring items as an important financial measure because it provides an indicator of performance that is not affected by fluctuations in certain costs or other items. However, this measure has limitations as an analytical tool, and you should not consider it in isolation or as a substitute for analysis of our results as reported under GAAP. Some of these limitations are that it does not reflect every cash expenditure and is not adjusted for all non-cash income or expense items that are reflected in our statements of cash flows.
The Company considers Cash generated from Adjusted Operating Activities, net as an important financial measure because it provides an indicator of cash flow that is not affected by how the Company finances its operations. However, this measure has limitations as an analytical tool, and you should not consider it in isolation or as a substitute for analysis of cash generation as reported under GAAP.
The Company considers Adjusted EBITDA as an important financial measure because it provides a financial measure of the quality of the Company’s earnings. Other companies may calculate Adjusted EBITDA differently than we do, which might limit its usefulness as a comparative measure. Adjusted EBITDA is used by management in addition to and in conjunction with the results presented in accordance with GAAP. Additionally, we believe trailing twelve month Adjusted EBITDA provides the current run-rate for trending purposes, rather than annualizing the respective quarters, as the Company’s business is seasonal, with the second and third fiscal quarters being higher than the first and last quarters.
We have presented Adjusted EBITDA solely as a supplemental disclosure because we believe it allows for a more complete analysis of results of operations and assists investors and analysts in comparing our operating performance across reporting periods on a consistent basis by excluding items that we do not believe are indicative of our core operating performance.
Adjusted EBITDA has limitations as an analytical tool, and you should not consider it in isolation or as a substitute for analysis of our results as reported under GAAP. Some of these limitations are that Adjusted EBITDA and trailing twelve month Adjusted EBITDA: do not reflect every expenditure, future requirements for capital expenditures or contractual commitments; do not reflect changes in our working capital needs; do not reflect the interest expense, or the amounts necessary to service interest or principal payments, on our outstanding debt; do not reflect income tax (benefit) expense, and because the payment of taxes is part of our operations, tax expense is a necessary element of our costs and ability to operate; do not reflect non-cash equity compensation, which will remain a key element of our overall equity based compensation package; and do not reflect the impact of earnings or charges resulting from matters we consider not to be indicative of our ongoing operations.
|
|||||||
Condensed Consolidated Balance Sheets |
|||||||
(Amounts in thousands, except share and per share amounts) |
|||||||
(Unaudited) |
|||||||
|
|
|
|
||||
Assets |
|
|
|
||||
Current assets: |
|
|
|
||||
Cash and cash equivalents |
$ |
79,446 |
|
|
$ |
132,236 |
|
Restricted cash |
|
10,363 |
|
|
|
— |
|
Marketable securities |
|
12,125 |
|
|
|
— |
|
Accounts and notes receivable, net of allowance for doubtful accounts
|
|
8,807 |
|
|
|
5,227 |
|
Inventories, net |
|
11,407 |
|
|
|
10,310 |
|
Prepaid expenses and other current assets |
|
14,206 |
|
|
|
12,732 |
|
Assets held-for-sale |
|
2,552 |
|
|
|
8,789 |
|
Total current assets |
|
138,906 |
|
|
|
169,294 |
|
|
|
|
|
||||
Property and equipment, net |
|
652,847 |
|
|
|
534,721 |
|
Internal use software, net |
|
14,901 |
|
|
|
11,423 |
|
Property and equipment under capital leases, net |
|
254,583 |
|
|
|
262,703 |
|
Intangible assets, net |
|
92,795 |
|
|
|
92,593 |
|
|
|
748,594 |
|
|
|
742,669 |
|
Other assets |
|
38,643 |
|
|
|
41,022 |
|
Total assets |
$ |
1,941,269 |
|
|
$ |
1,854,425 |
|
|
|
|
|
||||
Liabilities, Temporary Equity and Stockholders’ Deficit |
|
|
|
||||
Current liabilities: |
|
|
|
||||
Accounts payable |
$ |
44,590 |
|
|
$ |
38,217 |
|
Accrued expenses |
|
76,612 |
|
|
|
62,854 |
|
Current maturities of long-term debt |
|
5,821 |
|
|
|
4,966 |
|
Other current liabilities |
|
11,995 |
|
|
|
13,123 |
|
Total current liabilities |
|
139,018 |
|
|
|
119,160 |
|
|
|
|
|
||||
Long-term debt, net |
|
876,856 |
|
|
|
865,090 |
|
Long-term obligations under capital leases |
|
394,836 |
|
|
|
397,603 |
|
Earnout liability |
|
282,557 |
|
|
|
210,952 |
|
Other long-term liabilities |
|
79,354 |
|
|
|
54,418 |
|
Deferred income tax liabilities |
|
15,213 |
|
|
|
14,882 |
|
Total liabilities |
|
1,787,834 |
|
|
|
1,662,105 |
|
|
|
|
|
||||
Commitments and Contingencies (Note 10) |
|
|
|
||||
|
|
|
|
||||
Temporary Equity |
|
|
|
||||
Series A preferred stock |
|
211,667 |
|
|
|
206,002 |
|
|
|
|
|
||||
Stockholders’ Deficit |
|
|
|
||||
Class A common stock |
$ |
11 |
|
|
$ |
11 |
|
Class B common stock |
|
6 |
|
|
|
6 |
|
Additional paid-in capital |
|
336,261 |
|
|
|
335,015 |
|
|
|
(47,968 |
) |
|
|
(34,557 |
) |
Accumulated deficit |
|
(344,950 |
) |
|
|
(312,851 |
) |
Accumulated other comprehensive loss |
|
(1,592 |
) |
|
|
(1,306 |
) |
Total stockholders’ deficit |
|
(58,232 |
) |
|
|
(13,682 |
) |
Total liabilities, temporary equity and stockholders’ deficit |
$ |
1,941,269 |
|
|
$ |
1,854,425 |
|
|
|||||||||||||||
Condensed Consolidated Statements of Operations |
|||||||||||||||
(Amounts in thousands) |
|||||||||||||||
(Unaudited) |
|||||||||||||||
|
Three Months Ended |
|
Six Months Ended |
||||||||||||
|
|
|
|
|
|
|
|
||||||||
Revenues |
$ |
273,385 |
|
|
$ |
205,190 |
|
|
$ |
503,645 |
|
|
$ |
386,168 |
|
Costs of revenues |
|
179,706 |
|
|
|
141,383 |
|
|
|
344,908 |
|
|
|
268,251 |
|
Gross profit |
|
93,679 |
|
|
|
63,807 |
|
|
|
158,737 |
|
|
|
117,917 |
|
|
|
|
|
|
|
|
|
||||||||
Operating (income) expenses: |
|
|
|
|
|
|
|
||||||||
Selling, general and administrative expenses |
|
34,452 |
|
|
|
93,283 |
|
|
|
66,946 |
|
|
|
114,698 |
|
Asset impairment |
|
— |
|
|
|
— |
|
|
|
84 |
|
|
|
— |
|
Gain on sale of assets |
|
(1,823 |
) |
|
|
(124 |
) |
|
|
(1,978 |
) |
|
|
(154 |
) |
Other operating expense |
|
614 |
|
|
|
3,332 |
|
|
|
1,976 |
|
|
|
3,809 |
|
Total operating expense |
|
33,243 |
|
|
|
96,491 |
|
|
|
67,028 |
|
|
|
118,353 |
|
|
|
|
|
|
|
|
|
||||||||
Operating profit (loss) |
|
60,436 |
|
|
|
(32,684 |
) |
|
|
91,709 |
|
|
|
(436 |
) |
|
|
|
|
|
|
|
|
||||||||
Other expenses: |
|
|
|
|
|
|
|
||||||||
Interest expense, net |
|
27,379 |
|
|
|
23,880 |
|
|
|
50,949 |
|
|
|
46,808 |
|
Change in fair value of earnout liability |
|
30,776 |
|
|
|
(22,542 |
) |
|
|
71,536 |
|
|
|
(22,542 |
) |
Change in fair value of warrant liability |
|
— |
|
|
|
70 |
|
|
|
— |
|
|
|
70 |
|
Other income |
|
(678 |
) |
|
|
— |
|
|
|
(630 |
) |
|
|
— |
|
Total other expense |
|
57,477 |
|
|
|
1,408 |
|
|
|
121,855 |
|
|
|
24,336 |
|
|
|
|
|
|
|
|
|
||||||||
Income (loss) before income tax expense
|
|
2,959 |
|
|
|
(34,092 |
) |
|
|
(30,146 |
) |
|
|
(24,772 |
) |
|
|
|
|
|
|
|
|
||||||||
Income tax expense (benefit) |
|
1,524 |
|
|
|
362 |
|
|
|
1,953 |
|
|
|
(5,882 |
) |
Net income (loss) |
$ |
1,435 |
|
|
$ |
(34,454 |
) |
|
$ |
(32,099 |
) |
|
$ |
(18,890 |
) |
|
|||||||||||||||
Condensed Consolidated Statements of Cash Flows |
|||||||||||||||
(Amounts in thousands) |
|||||||||||||||
(Unaudited) |
|||||||||||||||
|
Three Months Ended |
|
Six Months Ended |
||||||||||||
|
|
|
|
|
|
|
|
||||||||
Net cash provided by operating activities |
$ |
80,306 |
|
|
$ |
27,745 |
|
|
$ |
115,879 |
|
|
$ |
59,285 |
|
Net cash used in investing activities |
|
(100,513 |
) |
|
|
(65,124 |
) |
|
|
(163,005 |
) |
|
|
(160,848 |
) |
Net cash (used in) provided by financing
|
|
(41 |
) |
|
|
31,121 |
|
|
|
5,126 |
|
|
|
30,213 |
|
Effect of exchange rate changes on cash |
|
(304 |
) |
|
|
(145 |
) |
|
|
(427 |
) |
|
|
(84 |
) |
Net decrease in cash, cash equivalents and
|
|
(20,552 |
) |
|
|
(6,403 |
) |
|
|
(42,427 |
) |
|
|
(71,434 |
) |
|
|
|
|
|
|
|
|
||||||||
Cash, cash equivalents and restricted cash at
|
|
110,361 |
|
|
|
122,062 |
|
|
|
132,236 |
|
|
|
187,093 |
|
|
|
|
|
|
|
|
|
||||||||
Cash, cash equivalents and restricted cash
|
$ |
89,809 |
|
|
$ |
115,659 |
|
|
$ |
89,809 |
|
|
$ |
115,659 |
|
GAAP to non-GAAP Reconciliations |
||||||||||||||||||||
|
|
Adjusted EBITDA Reconciliation |
||||||||||||||||||
|
|
Three Months Ended |
|
Six Months Ended |
||||||||||||||||
(in thousands) |
|
|
December
|
December
|
|
|
December
|
December
|
||||||||||||
Consolidated |
|
|
|
|
|
|
|
|
||||||||||||
Revenues |
|
$ |
273,385 |
|
$ |
205,190 |
|
$ |
184,842 |
|
|
$ |
503,645 |
|
$ |
386,168 |
|
$ |
333,412 |
|
Net income (loss) - GAAP |
|
|
1,435 |
|
|
(34,454 |
) |
|
6,448 |
|
|
|
(32,099 |
) |
|
(18,890 |
) |
|
(13,271 |
) |
Adjustments: |
|
|
|
|
|
|
|
|
||||||||||||
Interest expense |
|
|
27,379 |
|
|
23,880 |
|
|
19,805 |
|
|
|
50,949 |
|
|
46,808 |
|
|
39,470 |
|
Income tax expense (benefit) |
|
|
1,524 |
|
|
362 |
|
|
153 |
|
|
|
1,953 |
|
|
(5,882 |
) |
|
306 |
|
Depreciation, amortization and
|
|
|
29,303 |
|
|
25,660 |
|
|
21,772 |
|
|
|
55,654 |
|
|
48,501 |
|
|
42,874 |
|
Share-based compensation |
|
|
4,036 |
|
|
42,555 |
|
|
852 |
|
|
|
7,684 |
|
|
43,356 |
|
|
1,721 |
|
Closed center EBITDA (1) |
|
|
768 |
|
|
398 |
|
|
1,885 |
|
|
|
1,147 |
|
|
818 |
|
|
3,001 |
|
Foreign currency exchange (gain) loss |
|
|
(182 |
) |
|
86 |
|
|
(236 |
) |
|
|
(253 |
) |
|
121 |
|
|
(236 |
) |
Asset disposition (gain) loss |
|
|
(1,823 |
) |
|
(123 |
) |
|
219 |
|
|
|
(1,978 |
) |
|
(153 |
) |
|
285 |
|
Transactional and other advisory
|
|
|
5,880 |
|
|
29,149 |
|
|
1,087 |
|
|
|
8,106 |
|
|
31,978 |
|
|
2,395 |
|
Charges attributed to new initiatives (3) |
|
|
40 |
|
|
65 |
|
|
230 |
|
|
|
85 |
|
|
206 |
|
|
529 |
|
Extraordinary unusual non-recurring
|
|
|
(2,181 |
) |
|
1,662 |
|
|
673 |
|
|
|
(520 |
) |
|
1,221 |
|
|
745 |
|
Changes in the value of earnouts and
|
|
|
30,776 |
|
|
(22,472 |
) |
|
— |
|
|
|
71,536 |
|
|
(22,472 |
) |
|
— |
|
Adjusted EBITDA |
|
$ |
96,955 |
|
$ |
66,768 |
|
$ |
52,888 |
|
|
$ |
162,264 |
|
$ |
125,612 |
|
$ |
77,819 |
|
Adjusted EBITDA Margin |
|
|
35.5 |
% |
|
32.5 |
% |
|
28.6 |
% |
|
|
32.2 |
% |
|
32.5 |
% |
|
23.3 |
% |
|
|
|
|
|
|
|
|
|
||||||||||||
Bowling Operations SG&A Expense |
|
|
26,366 |
|
|
20,219 |
|
|
19,617 |
|
|
|
50,861 |
|
|
37,133 |
|
|
38,974 |
|
Media & Other Income |
|
|
(5,323 |
) |
|
(4,228 |
) |
|
(316 |
) |
|
|
(9,068 |
) |
|
(8,397 |
) |
|
(500 |
) |
Center EBITDA |
|
$ |
117,998 |
|
$ |
82,759 |
|
$ |
72,189 |
|
|
$ |
204,057 |
|
$ |
154,348 |
|
$ |
116,293 |
|
- The closed center adjustment is to remove EBITDA for closed centers. Closed centers are those centers that are closed for a variety of reasons, including permanent closure, newly acquired or built centers prior to opening, centers closed for renovation or rebranding and conversion. Closed centers do not include centers closed in compliance with local, state and federal government restrictions due to COVID-19. If a center is not open on the last day of the reporting period, it will be considered closed for that reporting period. If the center is closed on the first day of the reporting period for permanent closure, the center will be considered closed for that reporting period.
- The adjustment for transaction costs and other advisory costs is to remove charges incurred in connection with any transaction, including mergers, acquisitions, refinancing, amendment or modification to indebtedness, dispositions and costs in connection with an initial public offering, in each case, regardless of whether consummated.
- The adjustment for charges is to remove charges attributed to new initiatives include charges with the undertaking and/or implementation of new initiatives, business optimization activities, cost savings initiatives, cost rationalization programs, operating expense reductions and/or synergies and/or similar initiatives and/or programs (including in connection with any integration, restructuring or transition, any reconstruction, decommissioning, recommissioning, or reconfiguration of fixed assets for alternative uses, any office or facility opening and/or pre-opening), including any inventory optimization program and/or any curtailment, any business optimization charge, any restructuring charge (including any charges relating to any tax restructuring), any charge relating to the closure or consolidation of any office or facility (including but not limited to rent terminations, moving costs and legal costs), any systems implementation charge, any severance charge, any one time compensation charge, any charge relating to entry into a new market, any charge relating to any strategic initiative or contract, any charge relating to any entry into new markets and contracts, any lease run-off charge, any charge associated with improvements to information technology (IT) or accounting functions, losses related to temporary decreases in work volume and expenses related to maintaining underutilized personnel, any charge relating to a new contract, any consulting charge and/or any corporate development charge; provided, that, in this case of any such charge, the results of any such action relating to such charge are projected by in good faith to be achieved with 24 months of undertaking.
- The adjustment for extraordinary unusual non-recurring gains or losses is to remove extraordinary gains and losses, which include any gain or charge from any extraordinary item as determined in good faith by the Company and/or any non-recurring or unusual item as determined in good faith by the Company and/or any charge associated with and/or payment of any legal settlement, fine, judgment or order.
- The adjustment for changes in the value of earnouts and warrants is to remove the impact of the revaluation of the earnouts and warrants. As a result of the Company's de-SPAC transaction, the Company recorded liabilities for earnouts and warrants. Changes in the fair value of the earnout and warrant liabilities are recognized in the statement of operations. Decreases in the liability will have a favorable impact on the income statement and increases in the liability will have an unfavorable impact.
Trailing twelve month Adjusted EBITDA Reconciliation |
|||||||||||||||||||||
Net loss - GAAP and Adjusted EBITDA |
|
||||||||||||||||||||
(in thousands) |
|
September
|
December
|
|
|
|
|
||||||||||||||
Consolidated |
|
|
|
|
|
|
|
||||||||||||||
Revenues |
$ |
395,234 |
|
$ |
526,281 |
|
$ |
657,483 |
|
$ |
803,091 |
|
$ |
911,705 |
|
$ |
960,987 |
|
$ |
1,029,182 |
|
Net loss - GAAP |
$ |
(126,461 |
) |
$ |
(70,125 |
) |
$ |
(55,442 |
) |
$ |
(50,338 |
) |
$ |
(29,934 |
) |
$ |
(79,032 |
) |
$ |
(43,143 |
) |
Adjustments: |
|
|
|
|
|
|
|
||||||||||||||
Interest expense |
|
88,857 |
|
|
90,612 |
|
|
92,239 |
|
|
92,229 |
|
|
94,460 |
|
|
95,102 |
|
|
98,601 |
|
Income tax (benefit) expense |
|
(1,035 |
) |
|
(7,403 |
) |
|
(7,147 |
) |
|
(7,457 |
) |
|
(690 |
) |
|
5,983 |
|
|
7,145 |
|
Depreciation, amortization
|
|
91,851 |
|
|
92,241 |
|
|
95,363 |
|
|
102,359 |
|
|
108,505 |
|
|
112,015 |
|
|
115,658 |
|
Share-based compensation |
|
3,164 |
|
|
3,116 |
|
|
44,975 |
|
|
47,169 |
|
|
50,236 |
|
|
53,083 |
|
|
14,564 |
|
Closed center EBITDA (1) |
|
4,039 |
|
|
3,880 |
|
|
3,374 |
|
|
3,179 |
|
|
1,480 |
|
|
1,439 |
|
|
1,809 |
|
Foreign currency exchange
|
|
(188 |
) |
|
(155 |
) |
|
126 |
|
|
(68 |
) |
|
5 |
|
|
(101 |
) |
|
(369 |
) |
Asset disposition (gain) loss |
|
(46 |
) |
|
(77 |
) |
|
(58 |
) |
|
(1,723 |
) |
|
(4,109 |
) |
|
(4,234 |
) |
|
(5,934 |
) |
Transactional and other
|
|
10,737 |
|
|
12,056 |
|
|
40,474 |
|
|
43,379 |
|
|
38,140 |
|
|
37,537 |
|
|
14,268 |
|
Charges attributed to new
|
|
531 |
|
|
540 |
|
|
489 |
|
|
396 |
|
|
362 |
|
|
266 |
|
|
241 |
|
Extraordinary unusual non-
|
|
1,670 |
|
|
65 |
|
|
3,374 |
|
|
3,009 |
|
|
5,131 |
|
|
7,233 |
|
|
3,390 |
|
Changes in the value of
|
|
— |
|
|
— |
|
|
(22,472 |
) |
|
44,145 |
|
|
52,789 |
|
|
93,549 |
|
|
146,797 |
|
Adjusted EBITDA |
$ |
73,119 |
|
$ |
124,750 |
|
$ |
195,295 |
|
$ |
276,279 |
|
$ |
316,375 |
|
$ |
322,840 |
|
$ |
353,027 |
|
Adjusted EBITDA Margin |
|
18.5 |
% |
|
23.7 |
% |
|
29.7 |
% |
|
34.4 |
% |
|
34.7 |
% |
|
33.6 |
% |
|
34.3 |
% |
- The closed center adjustment is to remove EBITDA for closed centers. Closed centers are those centers that are closed for a variety of reasons, including permanent closure, newly acquired or built centers prior to opening, centers closed for renovation or rebranding and conversion. Closed centers do not include centers closed in compliance with local, state and federal government restrictions due to COVID-19. If a center is not open on the last day of the reporting period, it will be considered closed for that reporting period.If the center is closed on the first day of the reporting period for permanent closure, the center will be considered closed for that reporting period.
- The adjustment for transaction costs and other advisory costs is to remove charges incurred in connection with any transaction, including mergers, acquisitions, refinancing, amendment or modification to indebtedness, dispositions and costs in connection with an initial public offering, in each case, regardless of whether consummated.
- The adjustment for charges is to remove charges attributed to new initiatives include charges with the undertaking and/or implementation of new initiatives, business optimization activities, cost savings initiatives, cost rationalization programs, operating expense reductions and/or synergies and/or similar initiatives and/or programs (including in connection with any integration, restructuring or transition, any reconstruction, decommissioning, recommissioning, or reconfiguration of fixed assets for alternative uses, any office or facility opening and/or pre-opening), including any inventory optimization program and/or any curtailment, any business optimization charge, any restructuring charge (including any charges relating to any tax restructuring), any charge relating to the closure or consolidation of any office or facility (including but not limited to rent terminations, moving costs and legal costs), any systems implementation charge, any severance charge, any one time compensation charge, any charge relating to entry into a new market, any charge relating to any strategic initiative or contract, any charge relating to any entry into new markets and contracts, any lease run-off charge, any charge associated with improvements to information technology (IT) or accounting functions, losses related to temporary decreases in work volume and expenses related to maintaining underutilized personnel, any charge relating to a new contract, any consulting charge and/or any corporate development charge; provided, that, in this case of any such charge, the results of any such action relating to such charge are projected by in good faith to be achieved with 24 months of undertaking.
- The adjustment for extraordinary unusual non-recurring gains or losses is to remove extraordinary gains and losses, which include any gain or charge from any extraordinary item as determined in good faith by the Company and/or any non-recurring or unusual item as determined in good faith by the Company and/or any charge associated with and/or payment of any legal settlement, fine, judgment or order.
- The adjustment for changes in the value of earnouts and warrants is to remove the impact of the revaluation of the earnouts and warrants. As a result of the Company's de-SPAC transaction, the Company recorded liabilities for earnouts and warrants. Changes in the fair value of the earnout and warrant liabilities are recognized in the statement of operations. Decreases in the liability will have a favorable impact on the income statement and increases in the liability will have an unfavorable impact. The adjustment also includes realized costs associated with the settlement of warrants during past reporting periods.
NORMALIZED NET INCOME RECONCILIATION |
|||||||||||||||
|
|
|
|||||||||||||
|
|
Three Months Ended |
|
Six Months Ended |
|||||||||||
(in thousands) |
|
|
|
|
|
|
|
|
|||||||
|
|
|
|
|
|
|
|
|
|||||||
Net Income (loss) - GAAP |
|
$ |
1,435 |
|
$ |
(34,454 |
) |
|
$ |
(32,099 |
) |
|
$ |
(18,890 |
) |
|
|
|
|
|
|
|
|
|
|||||||
Change in fair value of earnouts and warrants |
|
|
30,776 |
|
|
(22,472 |
) |
|
|
71,536 |
|
|
|
(22,472 |
) |
Share-based compensation |
|
|
— |
|
|
42,212 |
|
|
|
— |
|
|
|
42,212 |
|
Transactional and other advisory costs |
|
|
— |
|
|
29,149 |
|
|
|
— |
|
|
|
29,149 |
|
|
|
|
|
|
|
|
|
|
|||||||
Normalized Net Income |
|
$ |
32,211 |
|
$ |
14,435 |
|
|
$ |
39,437 |
|
|
$ |
29,999 |
|
NET OPERATING ACTIVITIES RECONCILIATION |
||||||
|
|
|
|
|
||
|
|
Three Months Ended |
||||
(in thousands) |
|
|
|
|
||
|
|
|
|
|
||
Net Cash Provided by Operating Activities - GAAP |
|
$ |
80,306 |
|
$ |
27,745 |
|
|
|
|
|
||
Cash Paid for Interest |
|
|
25,694 |
|
|
20,820 |
|
|
|
|
|
||
Adjusted Operating Activities, net |
|
$ |
106,000 |
|
$ |
48,565 |
1 The pre-pandemic comparable period for quarter ended
2 Same-store sales are measured by comparing revenues for centers open for the entire duration of both the current and comparable measurement periods.
3 Revenue growth is calculated as the growth in Bowling Center Revenue compared to the comparable week during the pre-pandemic 52-week period beginning
View source version on businesswire.com: https://www.businesswire.com/news/home/20230215005382/en/
For Media:
PR@BowleroCorp.com
For Investors:
IRSupport@BowleroCorp.com
Ashley.DeSimone@icrinc.com
Source: