
Equity Metals Announces a Significant Increase to the Mineral Resource Estimate at the Silver Queen Project, BC
Equity Metals’ 2026 Silver Queen update shows large growth in inferred tonnage and precious‑metal‑weighted resources using a C$122/t NSR cut-off.
Rhea-AI Summary
Equity Metals (EQMEF) announced a new NI 43‑101 Mineral Resource Estimate for the Silver Queen project in British Columbia effective September 11, 2026, using a C$122/t NSR cut-off.
Indicated Resources total 3.57Mt grading 184g/t Ag, 1.8g/t Au, 0.3% Cu, 0.7% Pb and 3.8% Zn (425g/t AgEq or 6.4g/t AuEq), containing 21.0Moz Ag, 210koz Au, 21Mlb Cu, 55Mlb Pb and 299Mlb Zn, equivalent to 48.7Moz AgEq or 737koz AuEq. Inferred Resources total 5.16Mt grading 104g/t Ag, 0.7g/t Au, 0.2% Cu, 0.4% Pb and 1.7% Zn (211g/t AgEq or 3.2g/t AuEq), containing 17.3Moz Ag, 117koz Au, 21Mlb Cu, 46Mlb Pb and 188Mlb Zn, equivalent to 35.0Moz AgEq or 529koz AuEq.
Compared with the 2022 historical estimate, Indicated and Inferred tonnages increased about 3% and 169% respectively, with Inferred tonnage rising from 1.92Mt to 5.16Mt and notable Inferred gains in contained silver (+68%), gold (+132%) and zinc (+124%). The resource is dominated by precious metals, which contribute about 72% of total NSR value, and incorporates 87 additional drill holes (34,482m) plus updated metal prices, recoveries and rigorous stope-based RPEEE evaluation across the No. 3, NG-3, Camp, Sveinson and newly added George Lake vein systems.
Positive
- Indicated resource 3.57Mt at 425g/t AgEq (6.4g/t AuEq), 48.7Moz AgEq or 737koz AuEq
- Inferred resource 5.16Mt at 211g/t AgEq (3.2g/t AuEq), 35.0Moz AgEq or 529koz AuEq
- Tonnage growth Indicated +~3%, Inferred +~169% versus 2022 historical estimate
- Inferred contained metals silver +68%, gold +132%, zinc +124% versus 2022 historical estimate
- Additional drilling 87 new holes for 34,482m incorporated since 2022
- Precious‑metal bias gold and silver contribute ~72% of total NSR value
Negative
- Resource confidence ~59% of tonnage classified as Inferred, with lower confidence than Indicated
- No reserves resources are not Mineral Reserves and do not have demonstrated economic viability
News Explained
The completed estimate replaces the 2022 resource, but it is not a reserve and does not demonstrate economic viability.
As of
The release states that mineral resources are not mineral reserves until they have demonstrated economic viability, while Inferred Resources have lower confidence than Indicated Resources and must not be converted to reserves.
The next specified milestone is a NI 43-101 technical report to be filed on SEDAR within 45 days of the release; the release also says no mining study has been completed.
AI-generated analysis. How Rhea-AI works. Not financial advice.




Highlights
Indicated Mineral Resource: 48.7Mozs AgEq or 737kozs AuEq: 21.0Mozs Ag, 210kozs Au, 21Mlbs Cu, 55Mlbs Pb and 299Mlbs Zn Contained in 3.57 Mt
Inferred Mineral Resource: 35.0Mozs AgEq or 529kozs AuEq: 17.3Mozs Ag, 117kozs Au, 21Mlbs Cu, 46Mlbs Pb and 188Mlbs Zn Contained in 5.16 Mt
Vancouver, British Columbia--(Newsfile Corp. - September 16, 2026) - Equity Metals Corporation (TSXV: EQTY) ("Equity" or "Company") reports that Kirkham Geosystems Ltd ("KGL") and P&E Mining Consultants Inc. ("P&E") have completed an updated Independent Mineral Resource Estimate ("MRE") in accordance with National Instrument 43-101 ("NI 43-101") with an effective date of September 11, 2026 for the Silver Queen Ag-Au Project, British Columbia, Canada. The MRE features lateral and down-dip extensions of the No. 3, NG-3, Camp, and Sveinson Vein sets originally included in the 2022 MRE, and newly added mineralization from the George Lake Zone. The MRE utilizes a Net Smelter Return ("NSR") cut-off at C
President Joe Kizis comments, "After verifying and expanding Silver Queen's Indicated Mineral Resource in our December 2022 Mineral Resource Update, our exploration mandate shifted to grow the total Mineral Resource by drill-testing other target ideas with drill spacing acceptable for Inferred Mineral Resources. As a result, Inferred Mineral Resources significantly expanded in the current MRE. As we continue to advance our understanding of the Silver Queen Deposits, other attractive targets have been identified to further expand Silver Queen's Mineral Resource potential and make development of the property more attractive."
Silver Queen Resource Estimate Highlights:
The 2026 Mineral Resource Estimate, at a C
- Indicated Mineral Resources of 3.57Mt averaging 184g/t Silver, 1.8g/t Gold,
0.3% Copper,0.7% Lead and3.8% Zinc (425g/t AgEq or 6.4g/t AuEq) containing:
21.0 million ounces of silver; 210 thousand ounces of gold; 21 million pounds of copper; 55 million pounds of lead; and 299 million pounds of zinc.
This equates to 48.7 million ounces silver equivalent or 737 thousand ounces of gold equivalent; and
- Inferred Mineral Resources of 5.16Mt averaging 104g/t Silver, 0.7g/t Gold,
0.2% Copper,0.4% Lead and1.7% Zinc (211g/t AgEq or 3.2g/t AuEq) containing:
17.3 million ounces of silver; 117 thousand ounces of gold; 21 million pounds of copper; 46 million pounds of lead; and 188 million pounds of zinc.
This equates to 35.0 million ounces silver equivalent or 529 thousand ounces of gold equivalent.
The updated MRE incorporates an additional 87 holes for 34,482 metres of core drilling completed since the 2022 MRE (2022 historical estimate), updated metal recoveries and pricing, and a robust RPEEE evaluation. The 2022 historical estimate referred to in this news release has an effective date of December 1, 2022 and is described in the technical report titled "Technical Report and Updated Mineral Resource Estimate of The Silver Queen Property, Omineca Mining Division, British Columbia, Canada," dated January 16, 2023 filed under the Company's profile on SEDAR+. The updated 2026 Mineral Resource Estimate supersedes and replaces the 2022 historical estimate in its entirety.
Silver Queen Project Highlights
A total of 165 drill holes for 60,162 metres were completed by the Company on the Silver Queen Project from 2020 to 2025 and used in the updated resource estimate. Five separate target areas have been tested and thick intervals of high-grade gold, silver and base-metal mineralization have been identified in each of the Camp, Sveinson, No. 3, NG-3, and George Lake Vein systems.
Mineralized intercepts in 224 historical drill holes totaling
32% of total project drilling were also utilized in the Mineral Resource estimation of No-3, and NG-3 Vein sets. Assay data was independently verified from laboratory analytical certificates.
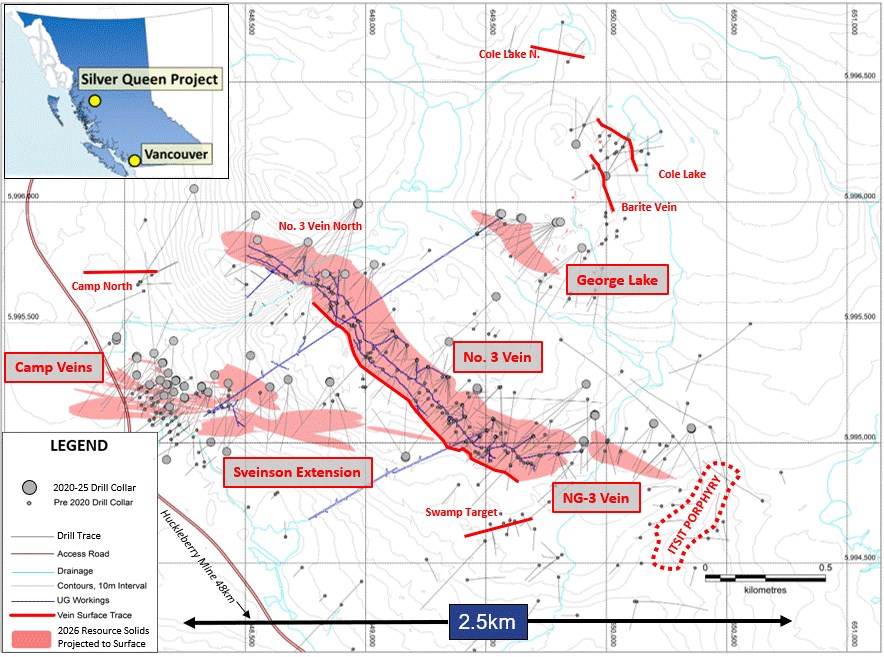
Figure 1: Plan map of targets and deposits on the Silver Queen vein system, BC
To view an enhanced version of this graphic, please visit:
https://images.newsfilecorp.com/files/5566/314577_eef4a956c46a291f_002full.jpg
The updated MRE increases Indicated and Inferred tonnages by approximately
3% and169% respectively with the increase being from the result of the northward extension to the No. 3 Vein set, the incorporation of verified mineralization in the George Lake Deposit, and lesser additions to mineralization in the Camp and Sveinson Vein sets.Approximately
41% of the Mineral Resources are classified as Indicated Resources on a per tonnage basis and58% of the total on a AgEq metal basis reflecting the overall higher average grade (425g/t AgEq) of the MRE in the Indicated Resource classification.Approximately
59% of the Mineral Resources are classified as Inferred Resources on a tonnage basis. This reflects a significant increase in Inferred Resource tonnage (1.92Mt to 5.16Mt) compared to the 2022 historical Resource estimate reflecting Equity Metals' focus over the last several years on exploration drilling and systematic Mineral Resource growth on the project rather than infill or definition drilling designed to upgrade Mineral Resource classification.The Inferred Mineral Resources feature a significant increase in both tonnage, as well as in contained silver (+
68% ), gold (+132% ) and zinc (+124% ).The Mineral Resource has a dominantly precious-metal bias with gold and silver accounting for approximately
72% of the total NSR value.Silver and gold equivalencies were calculated from the NSR formula explained in the Notes of Table 1 and incorporate both metal recoveries and assumed smelter payables. The Mineral Resource features updated consensus metal pricing.
The updated Mineral Resource Estimate utilizes a stope optimization protocol to define mining shapes to meet the criteria for Reasonable Prospects for Eventual Economic Extraction ("RPEEE"). The net effect of this protocol is to add internal dilution to the model (increased tonnage) to maintain a minimal mineable width, which can in turn decrease the average grades of the deposit. Very high-grade, narrow veins like some of those encountered at Silver Queen can often allow significant mining dilution and remain profitable; thus, a rigorous RPEEE protocol is used to provide a greater level of confidence that Mineral Resources can potentially be converted into Mineral Reserves in preparation for mining.
Vein Target Specifics
Since the previous 2022 historical estimate, drilling at the Camp-Sveinson Deposit extended mineralization approximately 100 metres laterally westward, filled several gaps within the vein set, identified several new hanging wall veins and extended mineralization to depths of up to 465 metres below surface in two veins. Veins are subvertical, dipping steeply both northward and southward.
Drilling from 2023 to 2025 extended the No. 3 Vein set laterally to the northwest approximately 450 metres. The vein set comprises the historically identified No. 2 and No. 3 Veins and smaller hanging wall and footwall veins.
The No. 3 Vein system strikes northwest and dips to the northeast at approximately 60 degrees. The average width of the veins is 0.9 to 1.2 metres with local increases up to about 4.6 metres. The No. 3 Vein can be traced on surface and in drilling for over a 1.7 kilometre strike length where it transitions across an oblique structure and into the NG-3 Vein set. Historical underground development may provide future access to much of the No. 3 Vein system. No mining study has been completed on the Project and there is no certainty that these workings could be used to access any part of the current Mineral Resource.
A single vein was delineated at the George Lake Target. The George Lake Vein extends about 450 metres laterally and can be traced to approximately 340 metres below surface. The Bulkley Cross-cut historically connected access between the No.3 underground workings and George Lake mineralization.
Mineral Resources that are not Mineral Reserves do not have demonstrated economic viability. Inferred Resources are considered too speculative geologically to have economic considerations applied to them that would enable them to be classified as Mineral Reserves. An Inferred Mineral Resource has a lower level of confidence than that applying to an Indicated Mineral Resource and must not be converted to a Mineral Reserve. It is reasonably expected that the majority of Inferred Mineral Resources could be upgraded to Indicated Mineral Resources with continued exploration.
A Technical Report completed in accordance with NI 43-101 will be posted on the Company's SEDAR profile (www.sedarplus.ca) within 45 days of this news release.
Table 1: Base Case Mineral Resource Estimate for the Silver Queen Project Utilizing a C
| Indicated Resources | Average Grade | |||||||
| Tonnes | Ag | Au | Cu | Pb | Zn | AgEq | AuEq | |
| Zone | (kt) | (g/t) | (g/t) | (%) | (%) | (%) | (g/t) | (g/t) |
| No. 3 - NG3 | 2,977 | 152 | 2.15 | 0.29 | 0.8 | 4.3 | 429 | 6.5 |
| Camp - Sveinson | 588 | 344 | 0.24 | 0.12 | 0.3 | 1.1 | 401 | 6.1 |
| Total | 3,565 | 184 | 1.8 | 0.3 | 0.7 | 3.8 | 425 | 6.4 |
| Inferred Resources | Average Grade | |||||||
| Tonnes | Ag | Au | Cu | Pb | Zn | AgEq | AuEq | |
| Zone | (kt) | (g/t) | (g/t) | (%) | (%) | (%) | (g/t) | (g/t) |
| No. 3 - NG3 | 2,693 | 61 | 0.79 | 0.17 | 0.4 | 1.9 | 177 | 2.7 |
| George Lk. | 592 | 66 | 0.90 | 0.21 | 0.6 | 1.5 | 187 | 2.8 |
| Camp - Sveinson | 1,872 | 179 | 0.52 | 0.19 | 0.4 | 1.4 | 267 | 4.0 |
| Total | 5,157 | 104 | 0.7 | 0.2 | 0.4 | 1.7 | 211 | 3.2 |
| Indicated Resources | Contained Metal | |||||||
| Tonnes | Ag TrOz | Au TrOz | Cu | Pb | Zn | AgEq TrOz | AuEq TrOz | |
| Zone | (kt) | (kozs) | (kozs) | (Mlbs) | (Mlbs) | (Mlbs) | (kozs) | (kozs) |
| No. 3 - NG3 | 2,977 | 14,532 | 206 | 19.0 | 51.0 | 284.6 | 41,091 | 622 |
| Camp - Sveinson | 588 | 6,505 | 5 | 1.6 | 3.9 | 14.7 | 7,580 | 115 |
| Total | 3,565 | 21,037 | 210 | 21 | 55 | 299 | 48,671 | 737 |
| Inferred Resources | Contained Metal | |||||||
| Tonnes | Ag TrOz | Au TrOz | Cu | Pb | Zn | AgEq TrOz | AuEq TrOz | |
| Zone | (kt) | (kozs) | (kozs) | (Mlbs) | (Mlbs) | (Mlbs) | (kozs) | (kozs) |
| No. 3 - NG3 | 2,693 | 5,293 | 69 | 9.9 | 22.8 | 112.9 | 15,341 | 232 |
| George Lk. | 592 | 1,262 | 17 | 2.8 | 7.8 | 19.5 | 3,567 | 54 |
| Camp - Sveinson | 1,872 | 10,759 | 31 | 8.0 | 15.6 | 55.9 | 16,042 | 243 |
| Total | 5,157 | 17,314 | 117 | 21 | 46 | 188 | 34,950 | 529 |
1) The current Mineral Resource Estimate was prepared by Garth Kirkham, P.Geo., of Kirkham Geosystems Ltd and Eugene Puritch, P. Eng., FEC, CET and Fred Brown, P, Geo. of P&E Mining Consultants Inc. ("P&E"), Independent Qualified Persons ("QP"), as defined by National instrument 43-101.
2) All Mineral Resources have been estimated in accordance with Canadian Institute of Mining and Metallurgy and Petroleum ("CIM") definition standards for Mineral Resources and Mineral Reserves (May 2014), as referenced in NI 43-101.
3) Mineral Resources were constrained using continuous mining stope shape units demonstrating reasonable prospects of eventual economic extraction.
4) Silver and Gold Equivalents were calculated from the interpolated block values process recoveries, payables and prices between the component metals and silver to determine a final AgEq and AuEq values.
5) Silver and Gold Equivalents and NSR C$/t values were calculated using average long-term prices of
6) Grade capping was performed on 1m composites for the No. 3 and NG-3 Veins and whole vein composites for the Camp and Sveinson Veins. For the No. 3 and NG-3 Veins Inverse distance cubed (I/d3) was utilized for grade interpolation for Au and Ag and inverse distance squared (I/d2) was utilized for Cu, Pb and Zn. Inverse distance squared (I/d2) was used for all metals in the Camp Vein while ordinary kriging was employed for the Sveinson Veins.
7) For tonnage calculations in the No. 3 and NG-3 veins the median bulk density by vein was applied, with an average of 3.36 tonnes per cubic metre overall. A variable bulk density with a 3.15 tonnes per cubic metre average was used for the Camp and Sveinson Veins.
8) Mineral Resources are not Mineral Reserves until they have demonstrated economic viability. Mineral Resource Estimates do not account for a Mineral Resource's mineability, selectivity, mining loss, or mining dilution. Underground stope shape optimization internal dilution has been included.
9) Mineral Resources that are not Mineral Reserves do not have demonstrated economic viability. Inferred Resources are considered too speculative geologically to have economic considerations applied to them that would enable them to be classified as Mineral Reserves.
10) An Inferred Mineral Resource has a lower level of confidence than that applying to an Indicated Mineral Resource and must not be converted to a Mineral Reserve. It is reasonably expected that the majority of Inferred Mineral Resources could be upgraded to Indicated Mineral Resources with continued exploration.
11) All figures are rounded to reflect the relative accuracy of the estimate and therefore numbers may not appear to sum precisely.
Silver, Gold Equivalencies and C$NSR Calculations
Silver and Gold Equivalents and NSR C$/t values were calculated using average long-term prices of
NSR C$/t = (Cu% x 99.21) + (Pb% x 17.69) + (Zn% x 25.19) + (Au g/t x 73.96) + (Ag g/t x 1.12)
AgEq = NSR value/1.12
AuEq = NSR value/73.96
The C
Quality Assurance and Quality Control (QA/QC)
Established QA/QC quality protocols were implemented by Equity Metals throughout the drill program including "blind" insertions of various standard pulps, blanks, and field duplicates. Certified standards and prepared blanks were used, as well as local quarry rock. Overall ~
Qualified Persons
The independent Qualified Persons for the Mineral Resource Estimate disclosure for the Project are Garth Kirkham, P.Geo., Principal, Kirkham Geosystems Ltd. and Eugene Puritch, P.Eng., FEC, CET and Fred Brown, P.Geo., of P&E Mining Consultants Inc. ("P&E"), Independent Qualified Persons ("QP"), as defined by NI 43-101 who have prepared and approved the scientific and technical information related to the Mineral Resource Estimate disclosed in this news release. Robert Macdonald, P.Geo., Vice President Exploration, the Qualified Person for the Company, has reviewed and approved the other scientific and technical information disclosed in this news release.
Risk Factors
Equity Metals Corporation is aware that this Project is subject to the same types of risks that large precious metal projects experience at an early stage of development in British Columbia. The Company has engaged experienced management and specialized consultants to identify, manage and mitigate those risks. However, the types of risks will change as the project evolves and more information becomes available.
Further details regarding the foregoing Mineral Resource Estimate, including the estimation methods and procedures, will be detailed in the upcoming Technical Report, which will be filed on SEDAR (www.sedarplus.ca) under the Company's profile within 45 days from the date of this news release completed in accordance with NI 43-101.
About Silver Queen Project
The Silver Queen Project is a premier gold-silver property with over 100 years of historical exploration and development and is located adjacent to power, roads and rail with significant mining infrastructure that was developed under previous operators Bradina JV (Bralorne Mines) and Houston Metals Corp. (a Hunt Brothers company). The Property contains two historical declines into the No. 3 Vein, camp infrastructure, and a maintained Tailings Facility.
The Silver Queen Property consists of 47 mineral claims, 17 crown grants, and two surface crown grants totalling 18,871ha with no underlying royalties. Mineralization is hosted by a series of epithermal veins distributed over a 6 sq km area. More than 20 different veins have been identified on the Property, forming an extensive network of zoned Cretaceous- to Tertiary-age epithermal veins. The Property remains largely under explored.
About Equity Metals Corporation
Equity Metals Corporation is a member of the Malaspina-Manex Group. The Company owns
On behalf of the Board of Directors
"Joseph Anthony Kizis, Jr."
Joseph Anthony Kizis, Jr., P.Geo
President, Director, Equity Metals Corporation
For further information, visit the website at https://www.equitymetalscorporation.com; or contact us at 604.641.2759 or by email at ir@mnxltd.com.
Neither TSX Venture Exchange nor its Regulation Services Provider (as that term is defined in the policies of the TSX Venture Exchange) accepts responsibility for the adequacy or accuracy of this release. This news release may contain forward-looking statements. Forward-looking statements address future events and conditions and therefore involve inherent risks and uncertainties. Actual results may differ materially from those currently anticipated in such statements. Factors that could cause actual results to differ materially from those in forward-looking statements include the timing and receipt of government and regulatory approvals, and continued availability of capital and financing and general economic, market or business conditions. Equity Metals Corporation does not assume any obligation to update or revise its forward-looking statements, whether as a result of new information, future events or otherwise, except to the extent required by applicable law.

To view the source version of this press release, please visit https://www.newsfilecorp.com/release/314577
FAQ
AI-generated questions and answers. How Rhea-AI works. Not financial advice.
What mineralized zones are included in the updated Silver Queen resource model?
The 2026 Mineral Resource Estimate covers lateral and down‑dip extensions of the No. 3, NG-3, Camp and Sveinson vein sets that were included in the 2022 historical estimate, and adds newly modelled mineralization from the George Lake zone.
How much drilling supports the updated Silver Queen Mineral Resource Estimate?
The estimate uses 165 Company drill holes totaling 60,162m completed from 2020 to 2025 across five target areas, plus mineralized intercepts from 224 historical drill holes, which represent about 32% of total project drilling in the No. 3 and NG-3 veins.
What metal prices and NSR cut-off were used to constrain the Silver Queen resource?
The NSR cut-off is C$122/t$38/oz silver, $3,200/oz gold, $4.75/lb copper, $0.95/lb lead and $1.35/lb zinc, all in USD, with process recoveries from 2022 metallurgical test work and smelting, refining and freight costs incorporated into the NSR and AgEq/AuEq calculations.
When will the full NI 43-101 technical report for the updated resource be available?
A Technical Report prepared in accordance with NI 43-101 for the updated Silver Queen Mineral Resource Estimate is expected to be filed on the company’s SEDAR+ profile within 45 days of the September 16, 2026 news release.