
General Dynamics Reports Second-Quarter 2026 Financial Results
General Dynamics (NYSE: GD) reported second-quarter 2026 revenue of $14.1 billion, up 8.1% year over year, with operating earnings of $1.46 billion and diluted EPS of $4.24, up 11.9% and 13.4%, respectively.
Rhea-AI Summary
General Dynamics (NYSE: GD) reported second-quarter 2026 revenue of $14.1 billion, up 8.1% year over year, with operating earnings of $1.46 billion and diluted EPS of $4.24, up 11.9% and 13.4%, respectively. Operating margin rose 40 basis points to 10.4%.
Net cash from operating activities was $1.9 billion, equal to 162% of net earnings, supporting $429 million in dividends, $234 million in capex, and a $498 million debt reduction. Orders totaled $20 billion with a 1.4x company-wide book-to-bill, lifting backlog to $136.5 billion and total estimated contract value to $186.9 billion. Aerospace and Marine Systems posted double-digit revenue growth and margin expansion, while net debt declined to $3.2 billion.
Positive
- Q2 2026 revenue $14.1B, up 8.1% year over year
- Diluted EPS $4.24 in Q2 2026, up 13.4% versus 2025
- Operating margin expansion to 10.4%, up 40 basis points year over year
- Operating cash flow $1.9B in Q2, 162% of net earnings
- Free cash flow $3.6B for six months 2026 versus $1.1B in 2025
- Backlog $136.5B with total estimated contract value $186.9B
- Company-wide book-to-bill 1.4x in Q2; Aerospace 1.5x
- Net debt reduction to $3.2B from $5.7B at year-end 2025
Negative
- Combat Systems Q2 operating earnings down 1.9% year over year
- Combat Systems and Technologies margins declined modestly versus prior-year quarter
Details
Market reaction after 2Q26 earnings report: GD -3.11% in the Jul 29 session
In the Jul 29 session, GD declined 3.11%, reflecting a moderate negative market reaction.
Data tracked by StockTitan Argus on the day of publication.
Key Figures
- Revenue
- $14.1 billion
- Second-quarter 2026
- Diluted EPS
- $4.24
- Second-quarter 2026, up 13.4% versus prior year
- Operating earnings
- $1.5 billion
- Second-quarter 2026
- Operating margin
- 10.4%
- Second-quarter 2026, 40-basis-point expansion year over year
- Cash from operating activities
- $1.9 billion
- Second-quarter 2026, 162% of net earnings
- Orders
- $20 billion
- Second-quarter 2026 across defense and Aerospace segments
- Backlog
- $136.5 billion
- End of second-quarter 2026
- Debt reduction
- $498 million
- Second-quarter 2026
Previous Earnings Reports
-
Revenue and EPS growth, strong cash flow, orders, and backlog accompanied quarterly results.
-
Quarterly and full-year earnings growth coincided with a negative 24-hour price reaction.
-
Revenue and EPS growth, margin expansion, and aerospace strength preceded a positive reaction.
-
Revenue, EPS, margin, cash flow, orders, and backlog all showed strong quarterly performance.
-
Revenue, earnings, aerospace growth, margin expansion, and backlog accompanied a negative reaction.
24h Move is the share-price change in the day after each event; other market factors may also have contributed.
Key Terms
book-to-bill financial
idiq technical
free cash flow financial
net debt financial
AI-generated analysis. How Rhea-AI works. Not financial advice.




- Revenue
$14.1 billion 8.1% versus prior year - Diluted EPS
$4.24 13.4% versus prior year $1.9 billion 162% of net earnings- 1.4-to-1 book-to-bill, with strong order activity in all segments
"Our businesses delivered solid results in the quarter, with revenue growth across all four segments – including double-digit increases in revenue and noteworthy margin expansion in Aerospace and Marine Systems – reflecting our ongoing efforts to increase the pace of execution and deliver on our backlog," said Phebe Novakovic, chairman and chief executive officer. "We are well positioned to support our customers' needs and are continuing to make significant investments to increase output to meet strong and growing demand."
Cash and Capital Deployment
Net cash provided by operating activities in the quarter totaled
Orders and Backlog
Orders received in the quarter totaled
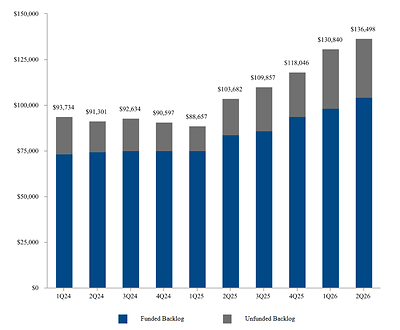
Backlog at the end of the quarter was
About General Dynamics
Headquartered in
WEBCAST INFORMATION: General Dynamics' financial results conference call will be held on Wednesday, July 29, 2026, at 9:00 a.m. EDT. A link to the live webcast will be available at www.gd.com and will be available for replay following the call. Corresponding presentation slides will be available for download prior to the call.
This press release may contain forward-looking statements (FLS), including statements about the company's future operational and financial performance, which are based on management's expectations, estimates, projections and assumptions. Words such as "expects," "anticipates," "plans," "believes," "forecasts," "scheduled," "outlook," "estimates," "should" and variations of these words and similar expressions are intended to identify FLS. In making FLS, we rely on assumptions and analyses based on our experience and perception of historical trends; current conditions and expected future developments; and other factors, estimates and judgments we consider reasonable and appropriate based on information available to us at the time. FLS are made pursuant to the safe harbor provisions of the Private Securities Litigation Reform Act of 1995, as amended. FLS are not guarantees of future performance and involve factors, risks and uncertainties that are difficult to predict. Actual future results and trends may differ materially from what is forecast in the FLS. All FLS speak only as of the date they were made. We do not undertake any obligation to update or publicly release revisions to FLS to reflect events, circumstances or changes in expectations after the date of this press release. Additional information regarding these factors is contained in the company's filings with the SEC, and these factors may be revised or supplemented in future SEC filings. In addition, this press release may contain some financial measures not prepared in accordance with
EXHIBIT A CONSOLIDATED STATEMENT OF EARNINGS - (UNAUDITED) DOLLARS IN MILLIONS, EXCEPT PER SHARE AMOUNTS | |||||||||
Three Months Ended | Variance | ||||||||
July 5, 2026 | June 29, 2025 | $ | % | ||||||
Revenue | $ 14,094 | $ 13,041 | $ 1,053 | 8.1 % | |||||
Operating costs and expenses | (12,634) | (11,736) | (898) | ||||||
Operating earnings | 1,460 | 1,305 | 155 | 11.9 % | |||||
Other, net | (4) | 15 | (19) | ||||||
Interest, net | (49) | (88) | 39 | ||||||
Earnings before income tax | 1,407 | 1,232 | 175 | 14.2 % | |||||
Provision for income tax, net | (247) | (218) | (29) | ||||||
Net earnings | $ 1,160 | $ 1,014 | $ 146 | 14.4 % | |||||
Earnings per share—basic | $ 4.29 | $ 3.78 | $ 0.51 | 13.5 % | |||||
Basic weighted average shares outstanding | 270.2 | 268.1 | |||||||
Earnings per share—diluted | $ 4.24 | $ 3.74 | $ 0.50 | 13.4 % | |||||
Diluted weighted average shares outstanding | 273.5 | 270.9 | |||||||
EXHIBIT B CONSOLIDATED STATEMENT OF EARNINGS - (UNAUDITED) DOLLARS IN MILLIONS, EXCEPT PER SHARE AMOUNTS | |||||||||
Six Months Ended | Variance | ||||||||
July 5, 2026 | June 29, 2025 | $ | % | ||||||
Revenue | $ 27,575 | $ 25,264 | $ 2,311 | 9.1 % | |||||
Operating costs and expenses | (24,695) | (22,691) | (2,004) | ||||||
Operating earnings | 2,880 | 2,573 | 307 | 11.9 % | |||||
Other, net | 14 | 36 | (22) | ||||||
Interest, net | (118) | (177) | 59 | ||||||
Earnings before income tax | 2,776 | 2,432 | 344 | 14.1 % | |||||
Provision for income tax, net | (491) | (424) | (67) | ||||||
Net earnings | $ 2,285 | $ 2,008 | $ 277 | 13.8 % | |||||
Earnings per share—basic | $ 8.46 | $ 7.48 | $ 0.98 | 13.1 % | |||||
Basic weighted average shares outstanding | 270.2 | 268.6 | |||||||
Earnings per share—diluted | $ 8.35 | $ 7.40 | $ 0.95 | 12.8 % | |||||
Diluted weighted average shares outstanding | 273.8 | 271.3 | |||||||
EXHIBIT C REVENUE AND OPERATING EARNINGS BY SEGMENT - (UNAUDITED) DOLLARS IN MILLIONS | |||||||||
Three Months Ended | Variance | ||||||||
July 5, 2026 | June 29, 2025 | $ | % | ||||||
Revenue: | |||||||||
Aerospace | $ 3,525 | $ 3,062 | $ 463 | 15.1 % | |||||
Marine Systems | 4,660 | 4,220 | 440 | 10.4 % | |||||
Combat Systems | 2,290 | 2,283 | 7 | 0.3 % | |||||
Technologies | 3,619 | 3,476 | 143 | 4.1 % | |||||
Total | $ 14,094 | $ 13,041 | $ 1,053 | 8.1 % | |||||
Operating earnings: | |||||||||
Aerospace | $ 510 | $ 403 | $ 107 | 26.6 % | |||||
Marine Systems | 342 | 291 | 51 | 17.5 % | |||||
Combat Systems | 318 | 324 | (6) | (1.9) % | |||||
Technologies | 339 | 332 | 7 | 2.1 % | |||||
Corporate | (49) | (45) | (4) | (8.9) % | |||||
Total | $ 1,460 | $ 1,305 | $ 155 | 11.9 % | |||||
Operating margin: | |||||||||
Aerospace | 14.5 % | 13.2 % | |||||||
Marine Systems | 7.3 % | 6.9 % | |||||||
Combat Systems | 13.9 % | 14.2 % | |||||||
Technologies | 9.4 % | 9.6 % | |||||||
Total | 10.4 % | 10.0 % | |||||||
EXHIBIT D REVENUE AND OPERATING EARNINGS BY SEGMENT - (UNAUDITED) DOLLARS IN MILLIONS | |||||||||
Six Months Ended | Variance | ||||||||
July 5, 2026 | June 29, 2025 | $ | % | ||||||
Revenue: | |||||||||
Aerospace | $ 6,804 | $ 6,088 | $ 716 | 11.8 % | |||||
Marine Systems | 9,003 | 7,809 | 1,194 | 15.3 % | |||||
Combat Systems | 4,573 | 4,459 | 114 | 2.6 % | |||||
Technologies | 7,195 | 6,908 | 287 | 4.2 % | |||||
Total | $ 27,575 | $ 25,264 | $ 2,311 | 9.1 % | |||||
Operating earnings: | |||||||||
Aerospace | $ 1,003 | $ 835 | $ 168 | 20.1 % | |||||
Marine Systems | 658 | 541 | 117 | 21.6 % | |||||
Combat Systems | 628 | 615 | 13 | 2.1 % | |||||
Technologies | 678 | 660 | 18 | 2.7 % | |||||
Corporate | (87) | (78) | (9) | (11.5) % | |||||
Total | $ 2,880 | $ 2,573 | $ 307 | 11.9 % | |||||
Operating margin: | |||||||||
Aerospace | 14.7 % | 13.7 % | |||||||
Marine Systems | 7.3 % | 6.9 % | |||||||
Combat Systems | 13.7 % | 13.8 % | |||||||
Technologies | 9.4 % | 9.6 % | |||||||
Total | 10.4 % | 10.2 % | |||||||
EXHIBIT E CONSOLIDATED BALANCE SHEET DOLLARS IN MILLIONS | |||
(Unaudited) | |||
July 5, 2026 | December 31, 2025 | ||
ASSETS | |||
Current assets: | |||
Cash and equivalents | $ 4,333 | $ 2,333 | |
Accounts receivable | 2,398 | 2,406 | |
Unbilled receivables | 9,255 | 8,380 | |
Inventories | 9,097 | 9,232 | |
Other current assets | 1,955 | 1,897 | |
Total current assets | 27,038 | 24,248 | |
Noncurrent assets: | |||
Property, plant and equipment, net | 7,575 | 7,525 | |
Intangible assets, net | 1,281 | 1,375 | |
Goodwill | 20,927 | 21,009 | |
Other assets | 3,342 | 3,092 | |
Total noncurrent assets | 33,125 | 33,001 | |
Total assets | $ 60,163 | $ 57,249 | |
LIABILITIES AND SHAREHOLDERS' EQUITY | |||
Current liabilities: | |||
Short-term debt and current portion of long-term debt | $ 1,256 | $ 1,006 | |
Accounts payable | 2,874 | 2,678 | |
Customer advances and deposits | 11,034 | 9,824 | |
Other current liabilities | 3,601 | 3,288 | |
Total current liabilities | 18,765 | 16,796 | |
Noncurrent liabilities: | |||
Long-term debt | 6,260 | 7,007 | |
Other liabilities | 8,312 | 7,824 | |
Total noncurrent liabilities | 14,572 | 14,831 | |
Shareholders' equity: | |||
Common stock | 482 | 482 | |
Surplus | 4,535 | 4,403 | |
Retained earnings | 45,502 | 44,080 | |
Treasury stock | (23,110) | (22,860) | |
Accumulated other comprehensive loss | (583) | (483) | |
Total shareholders' equity | 26,826 | 25,622 | |
Total liabilities and shareholders' equity | $ 60,163 | $ 57,249 | |
EXHIBIT F CONSOLIDATED STATEMENT OF CASH FLOWS - (UNAUDITED) DOLLARS IN MILLIONS | |||
Six Months Ended | |||
July 5, 2026 | June 29, 2025 | ||
Cash flows from operating activities—continuing operations: | |||
Net earnings | $ 2,285 | $ 2,008 | |
Adjustments to reconcile net earnings to net cash from operating activities: | |||
Depreciation of property, plant and equipment | 348 | 325 | |
Amortization of intangible and finance lease right-of-use assets | 115 | 121 | |
Equity-based compensation expense | 107 | 89 | |
Deferred income tax provision (benefit) | 365 | (98) | |
(Increase) decrease in assets, net of effects of business acquisitions: | |||
Accounts receivable | 8 | (612) | |
Unbilled receivables | (846) | (200) | |
Inventories | 135 | (207) | |
Increase (decrease) in liabilities, net of effects of business acquisitions: | |||
Accounts payable | 196 | (261) | |
Customer advances and deposits | 1,168 | 106 | |
Other, net | 154 | 179 | |
Net cash provided by operating activities | 4,035 | 1,450 | |
Cash flows from investing activities: | |||
Capital expenditures | (437) | (340) | |
Other, net | 13 | 124 | |
Net cash used by investing activities | (424) | (216) | |
Cash flows from financing activities: | |||
Dividends paid | (834) | (785) | |
Repayment of fixed-rate notes | (500) | (1,500) | |
Purchases of common stock | (319) | (600) | |
Proceeds from commercial paper, net | — | 696 | |
Proceeds from fixed-rate notes | — | 747 | |
Other, net | 48 | 39 | |
Net cash used by financing activities | (1,605) | (1,403) | |
Net cash used by discontinued operations | (6) | (5) | |
Net increase (decrease) in cash and equivalents | 2,000 | (174) | |
Cash and equivalents at beginning of period | 2,333 | 1,697 | |
Cash and equivalents at end of period | $ 4,333 | $ 1,523 | |
EXHIBIT G ADDITIONAL FINANCIAL INFORMATION - (UNAUDITED) DOLLARS IN MILLIONS, EXCEPT PER SHARE AMOUNTS | |||||||
Non-GAAP Financial Measures: | |||||||
Second Quarter | Six Months | ||||||
2026 | 2025 | 2026 | 2025 | ||||
Free cash flow: | |||||||
Net cash provided by operating activities | $ 1,880 | $ 1,598 | $ 4,035 | $ 1,450 | |||
Capital expenditures | (234) | (198) | (437) | (340) | |||
Free cash flow (a) | $ 1,646 | $ 1,400 | $ 3,598 | $ 1,110 | |||
July 5, 2026 | December 31, 2025 | ||||||
Net debt: | |||||||
Total debt | $ 7,516 | $ 8,013 | |||||
Less cash and equivalents | 4,333 | 2,333 | |||||
Net debt (b) | $ 3,183 | $ 5,680 | |||||
Supplemental Aerospace Data: | |||||||
Second Quarter | Six Months | ||||||
2026 | 2025 | 2026 | 2025 | ||||
Gulfstream Aircraft Deliveries (units): | |||||||
Large-cabin aircraft | 35 | 32 | 66 | 62 | |||
Mid-cabin aircraft | 6 | 6 | 13 | 12 | |||
Total | 41 | 38 | 79 | 74 | |||
Aerospace Book-to-Bill: | |||||||
Orders (c) | $ 5,278 | $ 4,003 | $ 9,121 | $ 6,364 | |||
Revenue | 3,525 | 3,062 | 6,804 | 6,088 | |||
Book-to-Bill Ratio | 1.5x | 1.3x | 1.3x | 1.0x | |||
(a) | We define free cash flow as net cash from operating activities less capital expenditures. We believe free cash flow is a useful measure for investors because it portrays our ability to generate cash from our businesses for purposes such as repaying debt, funding business acquisitions, paying dividends and repurchasing our common stock to cover dilution. We use free cash flow to assess the quality of our earnings and as a key performance measure in evaluating management. |
(b) | We define net debt as short- and long-term debt (total debt) less cash and equivalents. We believe net debt is a useful measure for investors because it reflects the borrowings that support our operations and capital deployment strategy. We use net debt as an important indicator of liquidity and financial position. |
(c) | Excludes customer defaults, liquidated damages, cancellations, foreign exchange fluctuations and other backlog adjustments. |
EXHIBIT H BACKLOG - (UNAUDITED) DOLLARS IN MILLIONS | ||||||||||
Funded | Unfunded | Total Backlog | Estimated Potential Contract Value* | Total Estimated Contract Value | ||||||
Second Quarter 2026: | ||||||||||
Aerospace | $ 22,992 | $ 985 | $ 23,977 | $ 1,170 | $ 25,147 | |||||
Marine Systems | 42,356 | 22,826 | 65,182 | 7,442 | 72,624 | |||||
Combat Systems | 27,507 | 1,843 | 29,350 | 10,847 | 40,197 | |||||
Technologies | 11,256 | 6,733 | 17,989 | 30,945 | 48,934 | |||||
Total | $ 104,111 | $ 32,387 | $ 136,498 | $ 50,404 | $ 186,902 | |||||
First Quarter 2026: | ||||||||||
Aerospace | $ 21,172 | $ 1,095 | $ 22,267 | $ 1,040 | $ 23,307 | |||||
Marine Systems | 40,598 | 23,373 | 63,971 | 12,519 | 76,490 | |||||
Combat Systems | 25,532 | 1,383 | 26,915 | 11,770 | 38,685 | |||||
Technologies | 10,818 | 6,869 | 17,687 | 32,272 | 49,959 | |||||
Total | $ 98,120 | $ 32,720 | $ 130,840 | $ 57,601 | $ 188,441 | |||||
Second Quarter 2025: | ||||||||||
Aerospace | $ 18,676 | $ 1,227 | $ 19,903 | $ 1,165 | $ 21,068 | |||||
Marine Systems | 39,298 | 13,674 | 52,972 | 14,708 | 67,680 | |||||
Combat Systems | 15,961 | 616 | 16,577 | 9,592 | 26,169 | |||||
Technologies | 9,945 | 4,285 | 14,230 | 32,011 | 46,241 | |||||
Total | $ 83,880 | $ 19,802 | $ 103,682 | $ 57,476 | $ 161,158 | |||||
* | The estimated potential contract value includes work awarded on unfunded indefinite delivery, indefinite quantity (IDIQ) contracts and unexercised options associated with existing firm contracts, including options and other agreements with existing customers to purchase new aircraft and aircraft services. We recognize options in backlog when the customer exercises the option and establishes a firm order. For IDIQ contracts, we evaluate the amount of funding we expect to receive and include this amount in our estimated potential contract value. The actual amount of funding received in the future may be higher or lower than our estimate of potential contract value. |
EXHIBIT H-1 |
BACKLOG - (UNAUDITED) |
DOLLARS IN MILLIONS |
https://mmx.prnewswire.com/media/MS1959817/GD-Q2.jpg?id=OA2797589

 View original content to download multimedia:https://www.prnewswire.com/news-releases/general-dynamics-reports-second-quarter-2026-financial-results-302836859.html
SOURCE General Dynamics
FAQ
AI-generated questions and answers. How Rhea-AI works. Not financial advice.