Granite Announces Fourth Quarter and Year End Results for 2022 and Provides Development Update
FOURTH QUARTER 2022 HIGHLIGHTS
Highlights for the three month period and year ended
Financial:
-
Granite's net operating income ("NOI") was
$102.4 million $86.3 million $16.1 million -
Same property NOI - cash basis(4) increased by
6.0% for the fourth quarter of 2022, excluding the impact of foreign exchange; -
Funds from operations ("FFO")(1) was
$77.2 million $1.20 $66.8 million $1.02 -
FFO was
$289.3 million $4.43 December 31, 2022 as compared to$255.8 million $4.00 $4.5 million December 31, 2021 ; -
Adjusted funds from operations ("AFFO")(2) was
$67.0 million $1.05 $59.2 million $0.90 -
AFFO was
$264.2 million $4.05 December 31, 2022 as compared to$239.7 million $3.75 $4.5 million December 31, 2021 ; -
During both the three month period and year ended
December 31, 2022 , the Canadian dollar weakened against the US dollar and strengthened against the Euro. The impact of foreign exchange for FFO for the three month period and year endedDecember 31, 2022 , relative to the same period in 2021, was$0.04 $0.03 $0.02 -
AFFO payout ratio(3) was
75% for the fourth quarter of 2022 compared to84% in the fourth quarter of 2021; -
Granite recognized
$229.9 million $219.7 million December 31, 2022 ) which were attributable to various factors including the expansion in discount and terminal capitalization rates across all of Granite's markets in response to rising interest rates, partially offset by fair market rent increases across theGreater Toronto Area inOntario (the "GTA") and selective US and European markets reflecting current market fundamentals. The value of investment properties was increased by unrealized foreign exchange gains of$80.0 million $338.2 million December 31, 2022 ) primarily resulting from the relative weakening of the Canadian dollar against the US dollar as atDecember 31, 2022 ; and -
Granite's net loss in the fourth quarter of 2022 was
$126.3 million $341.2 million $579.0 million $16.1 million $95.7 million
Developments:
During the fourth quarter of 2022 and in 2023 to date, Granite achieved the following milestones with respect to its development and expansion pipeline:
-
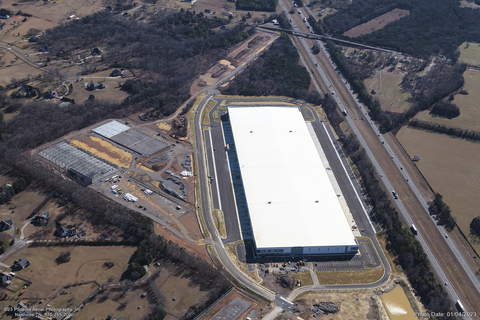
Granite achieved substantial completion of its 844,000 square foot, 40’ clear height, state-of-the-art modern distribution facility in
Murfreesboro, Tennessee that was leased startingDecember 1, 2022 to a leading investment-grade producer of specialized commercial vehicles for the entire space, for a term of 10.4 years.
-
Granite has signed leases with third-party logistics operators for approximately 521,000 square feet of its phase one development at
13220 and 13230 Crosby Freeway inHouston, Texas . The leases executed range in length between 5 and 7 years. Phase one, which consists of two buildings totaling 669,000 square feet, reached substantial completion inMarch 2023 .
-
On
January 30, 2023 , Granite achieved substantial completion of its phase two development, comprising of one building that is approximately 689,000 square feet at 13250 Crosby Fairway inHouston, Texas . Concurrent with completion, the lease with a leading e-commerce retailer, commenced for an initial term of 10.9 years.
The
5400 E. 500 S.,
-
On
January 19, 2023 , Granite completed the 329,000 square foot, value-enhancing expansion of its approximate 633,000 square foot modern distribution facility inWhitestown, Indiana . Upon completion the lease for the entire facility was extended for a ten year term.
Operations:
-
During the fourth quarter of 2022, Granite achieved average rental rate spreads on new and renewal leasing of
24% over prior or expiring rents, driven primarily by renewals inCanada executed at78% over expiring rent, by new leases and renewals inthe United States executed at an average of24% over prior or expiring rents, and the impact of consumer price index rent escalations on leases renewing inNetherlands at an average of9% , reflecting the continued strong demand for industrial space in these regions.
-
As at
December 31, 2022 , two income-producing properties located inCanada andthe United States were classified as assets held for sale with a combined fair value of$41.2 million
-
Today, Granite released its Green Bond use of proceeds report with respect to the allocation of net proceeds of Granite’s
3.062% $500.0 million 2.194% $500.0 million December 31, 2022 , Granite has allocated a total of$862.3 million 100% and73.5% of the net proceeds of the 2027 Green Bond and the 2028 Green Bond, respectively. Sustainalytics, a leading provider of ESG and corporate governance research and ratings to investors, conducted the verification of Granite’s Green Bond use of proceeds. The Green Bond use of proceeds report can be found on Granite’s website.
Financing:
-
During the fourth quarter of 2022, Granite repurchased 1,022,000 stapled units at an average stapled unit cost of
$67.60 $69.1 million $71.81 $155.5 million December 31, 2022 ).
-
On
March 3, 2023 , Granite amended its existing unsecured revolving credit facility (the "Credit Facility") agreement to extend the maturity date for a new five-year term toMarch 31, 2028 .
GRANITE’S FINANCIAL, OPERATING AND PROPERTY HIGHLIGHTS
|
Three Months Ended |
|
Years Ended
|
||||||||||
(in millions, except as noted) |
|
2022 |
|
|
2021 |
|
|
|
2022 |
|
|
2021 |
|
|
|
|
|
|
|
||||||||
Revenue(4) |
$ |
125.6 |
|
$ |
105.3 |
|
|
$ |
455.6 |
|
$ |
393.5 |
|
Net operating income ("NOI") |
$ |
102.4 |
|
$ |
86.3 |
|
|
$ |
380.4 |
|
$ |
332.7 |
|
Net (loss) income attributable to stapled unitholders |
$ |
(126.3 |
) |
$ |
341.2 |
|
|
$ |
155.8 |
|
$ |
1,310.0 |
|
Funds from operations ("FFO")(1) |
$ |
77.2 |
|
$ |
66.8 |
|
|
$ |
289.3 |
|
$ |
251.3 |
|
Adjusted funds from operations ("AFFO")(2) |
$ |
67.0 |
|
$ |
59.2 |
|
|
$ |
264.2 |
|
$ |
235.2 |
|
Diluted FFO per stapled unit(1) |
$ |
1.20 |
|
$ |
1.02 |
|
|
$ |
4.43 |
|
$ |
3.93 |
|
Diluted AFFO per stapled unit(2) |
$ |
1.05 |
|
$ |
0.90 |
|
|
$ |
4.05 |
|
$ |
3.68 |
|
Monthly distributions paid per stapled unit |
$ |
0.78 |
|
$ |
0.75 |
|
|
$ |
3.10 |
|
$ |
3.00 |
|
AFFO payout ratio(3) |
|
75 |
% |
|
84 |
% |
|
|
77 |
% |
|
80 |
% |
|
|
|
|
|
|
||||||||
As at |
|
|
|
|
2022 |
|
|
2021 |
|
||||
Fair value of investment properties(9) |
|
|
|
$ |
8,839.6 |
|
$ |
7,971.2 |
|
||||
Assets held for sale(9) |
|
|
|
$ |
41.2 |
|
$ |
64.6 |
|
||||
Cash and cash equivalents |
|
|
|
$ |
135.1 |
|
$ |
402.5 |
|
||||
Total debt(5) |
|
|
|
$ |
2,930.3 |
|
$ |
2,414.0 |
|
||||
Net leverage ratio(6) |
|
|
|
|
32 |
% |
|
25 |
% |
||||
Number of income-producing properties(9) |
|
|
|
|
128 |
|
|
119 |
|
||||
Gross leasable area (“GLA”), square feet(9) |
|
|
|
|
59.4 |
|
|
55.1 |
|
||||
Occupancy, by GLA |
|
|
|
|
99.6 |
% |
|
99.7 |
% |
||||
Magna as a percentage of annualized revenue(8) |
|
|
|
|
26 |
% |
|
29 |
% |
||||
Magna as a percentage of GLA |
|
|
|
|
20 |
% |
|
22 |
% |
||||
Weighted average lease term in years, by GLA |
|
|
|
|
5.9 |
|
|
5.8 |
|
||||
Overall capitalization rate(7) |
|
|
|
|
4.9 |
% |
|
4.5 |
% |
||||
A more detailed discussion of Granite’s combined financial results for the three months and years ended
CONFERENCE CALL
Granite will hold a conference call on
OTHER INFORMATION
Additional property statistics as at
Granite has filed its annual report on Form 40-F for the year ended
Investor Inquiries
Toronto-Dominion Centre
M5K 1H1
Granite is a Canadian-based REIT engaged in the acquisition, development, ownership and management of logistics, warehouse and industrial properties in
For further information, please see our website at www.granitereit.com or contact
NON-IFRS MEASURES, RATIOS AND RECONCILIATIONS
Readers are cautioned that certain terms used in this press release such as FFO, AFFO, AFFO payout ratio, same property NOI - cash basis, total debt and net debt, net leverage ratio, available liquidity, and any related per unit amounts used by management to measure, compare and explain the operating results and financial performance of the Trust do not have standardized meanings prescribed under International Financial Reporting Standards (“IFRS”) and, therefore, should not be construed as alternatives to net income, cash provided by operating activities or any other measure calculated in accordance with IFRS. Additionally, because these terms do not have a standardized meaning prescribed by IFRS, they may not be comparable to similarly titled measures presented by other publicly traded entities.
(1) FFO is a non-IFRS performance measure that is widely used by the real estate industry in evaluating the operating performance of real estate entities. Granite calculates FFO as net income attributable to stapled unitholders excluding fair value gains (losses) on investment properties and financial instruments, gains (losses) on sale of investment properties including the associated current income tax, deferred income taxes and certain other items, net of non-controlling interests in such items. The Trust’s determination of FFO follows the definition prescribed by the
(2) AFFO is a non-IFRS performance measure that is widely used by the real estate industry in evaluating the recurring economic earnings performance of real estate entities after considering certain costs associated with sustaining such earnings. Granite calculates AFFO as net income attributable to stapled unitholders including all adjustments used to calculate FFO and further adjusts for actual maintenance capital expenditures that are required to sustain Granite’s productive capacity, leasing costs such as leasing commissions and tenant allowances incurred and non-cash straight-line rent and tenant incentive amortization, net of non-controlling interests in such items. The Trust's determination of AFFO follows the definition prescribed by the REALPAC Guidelines. Granite considers AFFO to be a meaningful supplemental measure that can be used to determine the Trust’s ability to service debt, fund expansion capital expenditures, fund property development and provide distributions to stapled unitholders after considering costs associated with sustaining operating earnings. AFFO is also reconciled to net income, which is the most directly comparable IFRS measure (see below). AFFO should not be construed as an alternative to net income or cash flow generated from operating activities determined in accordance with IFRS.
|
|
Three Months Ended |
|
Years Ended
|
||||||||||
(in millions, except per unit amounts) |
|
|
2022 |
|
|
2021 |
|
|
|
2022 |
|
|
2021 |
|
|
|
|
|
|
|
|
||||||||
Net (loss) income attributable to stapled unitholders |
|
$ |
(126.3 |
) |
$ |
341.2 |
|
|
$ |
155.8 |
|
$ |
1,310.0 |
|
Add (deduct): |
|
|
|
|
|
|
||||||||
Fair value losses (gains) on investment properties, net |
|
|
229.9 |
|
|
(349.1 |
) |
|
|
219.7 |
|
|
(1,298.9 |
) |
Fair value (gains) losses on financial instruments, net |
|
|
(2.1 |
) |
|
(0.6 |
) |
|
|
(11.4 |
) |
|
1.2 |
|
Loss on sale of investment properties |
|
|
— |
|
|
0.2 |
|
|
|
0.7 |
|
|
0.8 |
|
Current income tax expense associated with the sale of investment properties |
|
|
— |
|
|
2.8 |
|
|
|
— |
|
|
5.1 |
|
Deferred tax (recovery) expense |
|
|
(24.4 |
) |
|
69.9 |
|
|
|
(71.0 |
) |
|
229.0 |
|
Fair value remeasurement of the Executive Deferred Stapled Unit Plan |
|
|
— |
|
|
2.3 |
|
|
|
(2.7 |
) |
|
3.8 |
|
Fair value remeasurement of the Directors Deferred Stapled Unit Plan(1) |
|
|
0.1 |
|
|
— |
|
|
|
(1.8 |
) |
|
— |
|
Non-controlling interests relating to the above |
|
|
— |
|
|
0.1 |
|
|
|
— |
|
|
0.3 |
|
FFO |
[A] |
$ |
77.2 |
|
$ |
66.8 |
|
|
$ |
289.3 |
|
$ |
251.3 |
|
Add (deduct): |
|
|
|
|
|
|
||||||||
Maintenance or improvement capital expenditures incurred |
|
|
(2.7 |
) |
|
(6.7 |
) |
|
|
(8.6 |
) |
|
(9.4 |
) |
Leasing costs |
|
|
(4.5 |
) |
|
— |
|
|
|
(9.4 |
) |
|
(2.5 |
) |
Tenant allowances |
|
|
(0.2 |
) |
|
(0.3 |
) |
|
|
(0.6 |
) |
|
(0.5 |
) |
Tenant incentive amortization |
|
|
0.8 |
|
|
1.2 |
|
|
|
4.1 |
|
|
5.1 |
|
Straight-line rent amortization |
|
|
(3.6 |
) |
|
(1.8 |
) |
|
|
(10.6 |
) |
|
(8.8 |
) |
AFFO |
[B] |
$ |
67.0 |
|
$ |
59.2 |
|
|
$ |
264.2 |
|
$ |
235.2 |
|
Basic FFO per stapled unit |
[A]/[C] |
$ |
1.21 |
|
$ |
1.02 |
|
|
$ |
4.44 |
|
$ |
3.93 |
|
Diluted FFO per stapled unit |
[A]/[D] |
$ |
1.20 |
|
$ |
1.02 |
|
|
$ |
4.43 |
|
$ |
3.93 |
|
Basic and Diluted AFFO per stapled unit |
[B]/[C] and [B]/[D] |
$ |
1.05 |
|
$ |
0.90 |
|
|
$ |
4.05 |
|
$ |
3.68 |
|
Basic weighted average number of stapled units |
[C] |
|
63.9 |
|
|
65.7 |
|
|
|
65.2 |
|
|
64.0 |
|
Diluted weighted average number of stapled units |
[D] |
|
64.1 |
|
|
65.8 |
|
|
|
65.3 |
|
|
64.0 |
|
(1) On
(3) AFFO payout ratio is calculated as monthly distributions, which exclude special distributions, declared to unitholders divided by AFFO in a period. AFFO payout ratio may exclude revenue or expenses incurred during a period that can be a source of variance between periods. The AFFO payout ratio is a non-IFRS ratio widely used by analysts and investors in evaluating the sustainability of the Trust’s monthly distributions to stapled unitholders.
|
|
Three Months Ended |
|
Years Ended |
||||||||||
(in millions, except as noted) |
|
|
2022 |
|
|
2021 |
|
|
|
2022 |
|
|
2021 |
|
Monthly distributions declared to unitholders |
[A] |
$ |
50.0 |
|
$ |
49.8 |
|
|
$ |
202.3 |
|
$ |
192.6 |
|
|
|
|
|
|
|
|
||||||||
FFO |
|
|
77.2 |
|
|
66.8 |
|
|
|
289.3 |
|
|
251.3 |
|
Add (deduct): |
|
|
|
|
|
|
||||||||
Early redemption premium related to 2021 Debentures |
|
|
— |
|
|
— |
|
|
|
— |
|
|
4.0 |
|
Accelerated amortization of Credit Facility deferred finance fees |
|
|
— |
|
|
— |
|
|
|
— |
|
|
0.5 |
|
FFO adjusted for the above |
[B] |
$ |
77.2 |
|
$ |
66.8 |
|
|
$ |
289.3 |
|
$ |
255.8 |
|
|
|
|
|
|
|
|
||||||||
AFFO |
|
|
67.0 |
|
|
59.2 |
|
|
|
264.2 |
|
|
235.2 |
|
Add (deduct): |
|
|
|
|
|
|
||||||||
Early redemption premium related to 2021 Debentures |
|
|
— |
|
|
— |
|
|
|
— |
|
|
4.0 |
|
Accelerated amortization of Credit Facility deferred finance fees |
|
|
— |
|
|
— |
|
|
|
— |
|
|
0.5 |
|
AFFO adjusted for the above |
[C] |
$ |
67.0 |
|
$ |
59.2 |
|
|
$ |
264.2 |
|
$ |
239.7 |
|
AFFO payout ratio |
[A]/[C] |
|
75 |
% |
|
84 |
% |
|
|
77 |
% |
|
80 |
% |
(4) Same property NOI — cash basis refers to the NOI — cash basis (NOI excluding lease termination and close-out fees, and the non-cash impact from straight-line rent and tenant incentive amortization) for those properties owned by Granite throughout the entire current and prior year periods under comparison. Same property NOI — cash basis excludes properties that were acquired, disposed of, classified as properties under or held for development or assets held for sale during the periods under comparison. Granite believes that same property NOI — cash basis is a useful measure in understanding period-over-period organic changes in NOI — cash basis from the same stock of properties owned.
|
Sq ft(1) |
Three Months Ended
|
Sq ft(1) |
Years Ended
|
||||||||||||||||||
|
(in millions) |
|
2022 |
|
|
2021 |
|
$ change |
% change |
(in millions) |
|
2022 |
|
|
2021 |
|
$ change |
% change |
||||
Revenue |
|
$ |
125.6 |
|
$ |
105.3 |
|
20.3 |
|
|
|
$ |
455.6 |
|
$ |
393.5 |
|
62.1 |
|
|
||
Less: Property operating costs |
|
|
23.2 |
|
|
19.0 |
|
4.2 |
|
|
|
|
75.2 |
|
|
60.8 |
|
14.4 |
|
|
||
NOI |
|
$ |
102.4 |
|
$ |
86.3 |
|
16.1 |
|
18.7 |
% |
|
$ |
380.4 |
|
$ |
332.7 |
|
47.7 |
|
14.3 |
% |
Add (deduct): |
|
|
|
|
|
|
|
|
|
|
||||||||||||
Straight-line rent amortization |
|
|
(3.6 |
) |
|
(1.8 |
) |
(1.8 |
) |
|
|
|
(10.6 |
) |
|
(8.8 |
) |
(1.8 |
) |
|
||
Tenant incentive amortization |
|
|
0.8 |
|
|
1.2 |
|
(0.4 |
) |
|
|
|
4.1 |
|
|
5.1 |
|
(1.0 |
) |
|
||
NOI - cash basis |
59.4 |
$ |
99.6 |
|
$ |
85.7 |
|
13.9 |
|
16.2 |
% |
59.4 |
$ |
373.9 |
|
$ |
329.0 |
|
44.9 |
|
13.6 |
% |
Less NOI - cash basis for: |
|
|
|
|
|
|
|
|
|
|
||||||||||||
Acquisitions |
4.8 |
|
(7.8 |
) |
|
(0.5 |
) |
(7.3 |
) |
|
10.5 |
|
(50.8 |
) |
|
(9.2 |
) |
(41.6 |
) |
|
||
Developments |
0.9 |
|
(0.6 |
) |
|
— |
|
(0.6 |
) |
|
0.9 |
|
(0.5 |
) |
|
(0.1 |
) |
(0.4 |
) |
|
||
Dispositions and assets held for sale |
1.1 |
|
(0.6 |
) |
|
(1.9 |
) |
1.3 |
|
|
1.1 |
|
(3.7 |
) |
|
(8.1 |
) |
4.4 |
|
|
||
Same property NOI - cash basis |
53.7 |
$ |
90.6 |
|
$ |
83.3 |
|
7.3 |
|
8.8 |
% |
48.0 |
$ |
318.9 |
|
$ |
311.6 |
|
7.3 |
|
2.3 |
% |
Constant currency same property NOI - cash basis(2) |
53.7 |
$ |
90.6 |
|
$ |
85.5 |
|
5.1 |
|
6.0 |
% |
48.0 |
$ |
318.9 |
|
$ |
308.5 |
|
10.4 |
|
3.4 |
% |
(1) The square footage relating to the NOI — cash basis represents GLA of 59.4 million square feet as at
(2) Constant currency same property NOI - cash basis is calculated by converting the comparative same property NOI - cash basis at current period average foreign exchange rates.
(5) Total debt is calculated as the sum of all current and non-current debt, the net mark to market fair value of derivatives and lease obligations as per the consolidated financial statements. Net debt subtracts cash and cash equivalents from total debt. Granite believes that it is useful to include the derivatives and lease obligations for the purposes of monitoring the Trust’s debt levels.
(6) The net leverage ratio is calculated as the net debt (a non-IFRS performance measure defined above) divided by the fair value of investment properties. The net leverage ratio is a non-IFRS ratio used in evaluating the Trust’s degree of financial leverage, borrowing capacity and the relative strength of its balance sheet.
As at |
|
|
2022 |
|
|
2021 |
|
Unsecured debt, net |
|
$ |
2,983.6 |
|
$ |
2,425.1 |
|
Derivatives, net |
|
|
(138.4 |
) |
|
(44.1 |
) |
Lease obligations |
|
|
33.7 |
|
|
32.2 |
|
Secured debt |
|
|
51.4 |
|
|
0.8 |
|
Total debt |
|
$ |
2,930.3 |
|
$ |
2,414.0 |
|
Less: cash and cash equivalents |
|
|
135.1 |
|
|
402.5 |
|
Net debt |
[A] |
$ |
2,795.2 |
|
$ |
2,011.5 |
|
Investment properties |
[B] |
$ |
8,839.6 |
|
$ |
7,971.2 |
|
Net leverage ratio |
[A]/[B] |
|
32 |
% |
|
25 |
% |
(7) Overall capitalization rate is calculated as stabilized net operating income (property revenue less property expenses) divided by the fair value of the property.
(8) Annualized revenue for each period presented is calculated as the contractual base rent for the month subsequent to the quarterly reporting period multiplied by 12 months. Annualized revenue excludes revenue from properties classified as assets held for sale.
(9) Assets held for sale are excluded from investment properties and related property metrics. Accordingly, two such assets that were held for sale at
(10) Available liquidity is a non-IFRS performance measure defined as the sum of cash and cash equivalents and the unused portion of the Credit Facility. Granite believes that available liquidity is a useful measure to investors in determining the Trust’s resources available as at period-end to meet its ongoing obligations and future commitments.
FORWARD-LOOKING STATEMENTS
This press release may contain statements that, to the extent they are not recitations of historical fact, constitute “forward-looking statements” or “forward-looking information” within the meaning of applicable securities legislation, including the United States Securities Act of 1933, as amended, the United States Securities Exchange Act of 1934, as amended, and applicable Canadian securities legislation. Forward-looking statements and forward-looking information may include, among others, statements regarding Granite’s future plans, goals, strategies, intentions, beliefs, estimates, costs, objectives, capital structure, cost of capital, tenant base, tax consequences, economic performance or expectations, or the assumptions underlying any of the foregoing. Words such as “outlook”, “may”, “would”, “could”, “should”, “will”, “likely”, “expect”, “anticipate”, “believe”, “intend”, “plan”, “forecast”, “project”, “estimate”, “seek” and similar expressions are used to identify forward-looking statements and forward-looking information. Forward-looking statements and forward-looking information should not be read as guarantees of future events, performance or results and will not necessarily be accurate indications of whether or the times at or by which such future performance will be achieved. Undue reliance should not be placed on such statements. There can also be no assurance that Granite’s expectations regarding various matters, including the following, will be realized in a timely manner, with the expected impact or at all: the effectiveness of measures intended to mitigate such impact, and Granite’s ability to deliver cash flow stability and growth and create long-term value for unitholders; Granite’s ability to implement its ESG+R program and related targets and goals; the expansion and diversification of Granite’s real estate portfolio and the reduction in Granite’s exposure to Magna and the special purpose properties; Granite’s ability to accelerate growth and to grow its net asset value and FFO and AFFO per unit; Granite’s ability to find and integrate satisfactory acquisition, joint venture and development opportunities and to strategically deploy the proceeds from recently sold properties and financing initiatives; Granite’s sale from time to time of stapled units under its ATM Program; the potential for expansion and rental growth at the properties in
View source version on businesswire.com: https://www.businesswire.com/news/home/20230308005713/en/
Source: