
Hycroft Delivers $10 Billion NPV from Technical Report at Spot Prices While Advancing High-Grade Brimstone and Vortex Silver Discoveries
Hycroft (Nasdaq: HYMC) released an S‑K 1300 Technical Report and Initial Assessment for the Hycroft Mine in Nevada, outlining a large-scale, long-life gold and silver project using POX and heap leach processing.
Rhea-AI Summary
Hycroft (Nasdaq: HYMC) released an S‑K 1300 Technical Report and Initial Assessment for the Hycroft Mine in Nevada, outlining a large-scale, long-life gold and silver project using POX and heap leach processing.
Base case post-tax NPV5 is $4.3 billion with 16.9% IRR, rising to $10.0 billion NPV5 and 30.1% IRR at spot prices, with a 51‑year mine life and average annual production of 204,000 ounces of gold and 6.8 million ounces of silver.
Positive
- Post-tax NPV5 of $4.3 billion at $3,600/oz gold and $48/oz silver
- Post-tax NPV5 of $10.0 billion and 30.1% IRR at spot prices
- 51-year mine life with 10.4 Moz gold and 347.5 Moz silver LOM output
- Average annual production of 295,000 ounces AuEq, >330,000 AuEq first 10 years
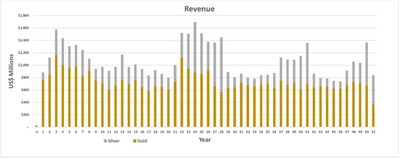
- Base case gross revenues of $54.2 billion over life of mine
- Initial capital cost of $2.4 billion with existing on-site infrastructure
Negative
- LOM average cash cost of $1,924/oz AuEq and AISC of $2,147/oz AuEq
- Initial capital costs of $2.4 billion plus $3.1 billion sustaining capital
- Initial Assessment is preliminary and does not demonstrate economic viability
- Mineral resources are not classified as reserves and no reserves are disclosed
- Inferred resources are excluded from the mine plan and carry high uncertainty
Details
News Market Reaction – HYMC
In the Jun 3 session, HYMC declined 4.94%, reflecting a moderate negative market reaction.
Data tracked by StockTitan Argus on the day of publication.
Key Figures
- Base case NPV5
- $5.4B pre-tax / $4.3B post-tax
- TRS base case economics at 5% discount rate
- Spot price NPV5
- $10.0B post-tax
- TRS economics at May 25, 2026 spot prices
- Post-tax IRR
- 16.9% base case / 30.1% at spot
- TRS initial assessment for Hycroft Mine
- Gross revenues
- $54.2B
- Life-of-mine revenue at base case prices
- Mine life
- 51 years
- Projected life-of-mine in TRS
- Average annual production
- 204k oz Au, 6.8M oz Ag, 295k oz AuEq
- Average yearly output over mine life
- Operating costs
- $1,924/oz cash cost, $2,147/oz AISC (AuEq)
- Life-of-mine averages for AuEq production
- Capital costs
- $2.4B initial, $3.1B sustaining
- TRS projected capital profile
Historical Context
-
Announcement of upcoming addition to the Russell 3000® Index.
-
CEO also appointed Executive Chairman and plan to add directors.
-
Larger quarterly loss alongside resource growth and project updates.
-
Clarified technical-report authorship and confirmed Initial Assessment timeline.
-
Engaged RESPEC on underground options and noted GDXJ inclusion.
24h Move is the share-price change in the day after each event; other market factors may also have contributed.
Key Terms
net present value financial
internal rate of return financial
heap leach technical
pressure oxidation technical
initial assessment regulatory
measured and indicated mineral resources technical
inferred mineral resources technical
all-in sustaining cost financial
AI-generated analysis. How Rhea-AI works. Not financial advice.




The TRS demonstrates that Hycroft hosts a large-scale, long-life precious metals project with compelling economics and strong leverage to rising gold and silver prices, reinforcing its position as a multi-generational, world-class asset in a Tier-1 jurisdiction. The TRS is being filed concurrently with the SEC on EDGAR and is available on the Company's website.
Basis of the Technical Report
- Base case commodity prices:
$3,600 $48.00 - Spot prices(1):
$4,569 $77.94 - Mine plan based on the 2026 Mineral Resource Estimate (16.4 million ounces of gold and 562.6 million ounces of silver Measured and Indicated)
- Inferred mineral resources of 5.0 million ounces of gold and 132.8 million ounces of silver are not included in the mine plan and represent an upside to the TRS economics
- Drill results from the 2025-2026 exploration program are not included in the mine plan and represents further upside
Highlights:
- Robust Economics Demonstrate the Scale and Value of the Hycroft Mine:
- Base Case Net Present Value at
5% ("NPV5") of$5.4 billion $4.3 billion - Internal Rate of Return ("IRR") of
18.9% (pre-tax) and16.9% (post-tax) - NPV5 at spot prices of
$10.0 billion 30.1% (post-tax) - Post-Tax Payback: 4.7 years at Base case prices and 2.9 years at spot prices
- Gross revenues:
$54.2 billion
- Base Case Net Present Value at
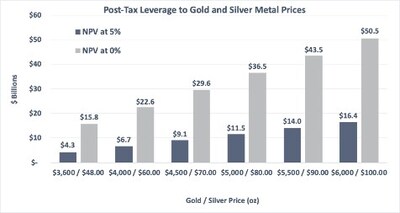
- Significant Leverage to Commodity Prices:
- For every
$100 $300 million - For every
$5.00 $460 million
- For every
- Multi-Decade Production Profile at Meaningful Scale:
- 51 year mine life
- Average annual production:
- 204,000 ounces of gold
- 6.8 million ounces of silver
- 295,000 ounces gold equivalent(2) ("AuEq")
- First 10 years deliver enhanced production averaging more than 330,000 ounces AuEq
- Life of Mine ("LOM") production:
- 10.4 million ounces of gold
- 347.5 million ounces of silver
- 15.1 million ounces AuEq
- Conventional Plant Design, Layout and Processing:
- Proven POX processing technology
- Existing infrastructure on-site allows for reduced capital expenditures
- Plant designed to process 57,100 tons per day of mineralized material
- LOM average cash cost(3) of
$1,924 $2,147 - Initial capital costs:
$2.4 billion $3.1 billion
__________________________________ |
(1) Spot prices for gold and silver as of May 25, 2026 |
(2) Silver is converted to AuEq using the ratio of |
(3) Cash costs consist of mining costs, processing costs, mine-level G&A, and refining charges and royalties |
(4) All-in sustaining costs includes cash costs plus sustaining capital and closure costs |
Significant Upside and Optionality Remains:
- Potential mine plan upside opportunities include:
- Further drilling to reclassify waste and inferred gold and silver resources to measured and indicated resources enabling integration into future mine plans
- Accelerated access to high-grade zones at Brimstone and Vortex early in the mine life through targeted optimization
- Combining underground mine option alongside the open pit benefiting from large scale production and bringing high-grade ounces forward earlier in the mine life
- New oxide targets have been identified for potential heap leach early in the mine life
- Extending mine life or expanding production by processing stockpiled low-grade mill feed material within the current mine plan but not included in the economic analysis
- Current mineral resource comprises less than
15% of the +64,000-acre land position as the Hycroft system remains open in all directions and at depth for future growth- New exploration targets identified for potential resource expansion opportunities including high-grade and oxide targets
- Significant drilling campaign underway with two core drill rigs at Brimstone and Vortex, increasing to four core drill rigs over the next quarter to expand and define these two high-grade systems that currently remain open in all directions and at depth
- Roasting test work is pending as an alternative processing option which could potentially enhance project economics including potentially adding a meaningful third revenue stream from the by-product production and sale of sulfuric acid, a strategically important industrial chemical
Diane R. Garrett, Executive Chairman and Chief Executive Officer, commented: "This Technical Study confirms the scale, quality, and long-term potential of the Hycroft Mine. The project delivers strong economics and significant leverage to rising gold and silver prices, reinforcing Hycroft's position as one of the sector's most compelling large-scale development opportunities, located in a Tier 1 jurisdiction.
Importantly, we believe the most meaningful value creation opportunity remains ahead of us. By advancing the high-grade Brimstone and Vortex silver systems, we see a clear path to further improving project economics and unlocking additional value. The Hycroft land package remains a highly prospective environment, and we believe we are only at the beginning of demonstrating its true potential."
For additional context on the TRS, please visit our pre-recorded event with 6ix.
About Hycroft Mining Holding Corporation
Hycroft Mining Holding Corporation is a US-based gold and silver company exploring and developing the Hycroft Mine, among the world's largest precious metals deposits, located in northern
For further information, please contact:
E: info@hycroftmining.com
Investor Relations Phone: 775-245-0564
www.hycroftmining.com
Media: Tavistock, Jos Simson / Emily Moss
E: hycroft@tavistock.co.uk
Phone: +44 207 920 3150
Cautionary Statements Regarding the Initial Assessment and Mineral Resources
The Initial Assessment is a preliminary technical and economic study that indicates the economic potential of the mineralization to support the disclosure of mineral resources at the Hycroft Mine. The Initial Assessment, however, does not represent a feasibility study or a pre-feasibility and does not demonstrate economic viability nor does it support a development decision, for which additional project planning and design are needed. As a result, Hycroft plans to continue to estimate its resources at the Hycroft Mine and further develop the project economics.
As used in this news release, the terms "pre-feasibility study," "feasibility study," "initial assessment," "mineral reserve," "mineral resource," "measured mineral resource," "indicated mineral resource" and "inferred mineral resource", as applicable, and other terms used herein are defined and used in accordance with S-K 1300.
The Initial Assessment also does not include the conversion of mineral resources to mineral reserves. Under subpart 1300 of Regulation S-K, mineral resources may not be classified as "mineral reserves" unless the determination has been made by a QP that the mineral resources can be the basis of an economically viable project. Investors are specifically cautioned not to assume that any part or all of the mineral deposits (including any mineral resources) in these categories will ever be converted into mineral reserves, as defined by the SEC.
In addition, estimates of inferred mineral resources have too high of a degree of uncertainty as to their existence and may not be converted to a mineral reserve. Therefore, investors are cautioned not to assume that all or any part of an inferred mineral resource exists, that it can be the basis of an economically viable project, or that it will ever be upgraded to a higher category. Likewise, investors are cautioned not to assume that all or any part of measured or indicated mineral resources will ever be converted to mineral reserves.
Cautionary Note Regarding Forward-Looking Statements
Certain information set forth in this news release contains "forward-looking statements" and "forward-looking information" within the meaning of applicable United States securities law (referred to herein as forward-looking statements). Forward-looking statements are often identified by the use of words such as "may", "will", "could", "would", "anticipate", "believe", "expect", "intend", "potential", "estimate", "budget", "scheduled", "plans", "planned", "forecasts", "goals" and similar expressions. Except for statements of historical fact, certain information contained herein constitutes forward-looking statements which includes, but is not limited to, statements with respect to: the future financial or operating performance of the Company, the Hycroft Mine and its mineral properties; results from work performed to date; the estimation of mineral resources and reserves; the realization of mineral resource and reserve estimates; the development, operational and economic results of the PEA for the Hycroft Mine, including cash flows, revenue potential, development, expenditures, and timing thereof, extraction rates, LOM projections and cost estimates; timing of completion of a technical report summarizing the results of the PEA; magnitude or quality of mineral deposits; anticipated advancement of the Project mine plan; exploration expenditures, costs and timing of the development of new deposits; costs and timing of future exploration; permitting; construction and optimization planning; estimates of metallurgical recovery rates; anticipated advancement of the Hycroft Mine, future prospects and prospective inclusion of mineral resources in future mining activities; requirements for additional capital; the future price of metals; government regulation of mining operations; environmental risks; the timing and possible outcome of pending regulatory matters; the realization of the expected economics of the Project; future growth potential of the Project; and future development plans.
Forward-looking statements are based on a number of factors and assumptions made by management and considered reasonable at the time such statement was made. Assumptions and factors include: the Company's ability to complete its planned exploration and development programs; the absence of adverse conditions at the Hycroft Mine; no unforeseen operational delays; no material delays in obtaining necessary permits; results of independent engineer technical reviews; the possibility of cost overruns and unanticipated costs and expenses; the price of gold remaining at levels that continue to render the Hycroft Mine and the Company's mineral properties economic; the Company's ability to continue raising necessary capital to finance operations; and the ability to realize on the mineral resource. Forward-looking statements necessarily involve known and unknown risks and uncertainties, which may cause actual performance and financial results in future periods to differ materially from any projections of future performance or result expressed or implied by such forward-looking statements. These risks and uncertainties include, but are not limited to: general business, economic and competitive uncertainties; the actual results of current and future exploration activities; conclusions of economic evaluations; meeting various expected cost estimates; benefits of certain technology usage; changes in the Hycroft Mine parameters and/or economic assessments as plans continue to be refined; future prices of metals; possible variations of mineral grade or recovery rates; the risk that actual costs may exceed estimated costs; geological, mining and exploration technical problems; failure of plant, equipment or processes to operate as anticipated; accidents, labor disputes and other risks of the mining industry; delays in obtaining governmental approvals or financing; risks related to local communities; the speculative nature of mineral exploration and development (including the risks of obtaining necessary licenses, permits and approvals from government authorities); title to properties; and other factors beyond the Company's control and as well as those factors included herein and elsewhere in the Company's public disclosure. Although the Company has attempted to identify important factors that could cause actual actions, events or results to differ materially from those described in the forward-looking statements, there may be other factors that cause actions, events or results not to be as anticipated, estimated or intended. Readers are advised to study and consider risk factors disclosed in the Company's Annual Report on Form 10-K, as amended, for the fiscal year ended December 31, 2025, and all other quarterly filings, available on the EDGAR profile for the Company at www.sec.gov.
Investors are cautioned not to put undue reliance on forward-looking statements. The forward-looking statements contained herein are made as of the date of this news release and, accordingly, are subject to change after such date. The Company disclaims any intent or obligation to update publicly or otherwise revise any forward-looking statements or the foregoing list of assumptions or factors, whether as a result of new information, future events or otherwise, except in accordance with applicable securities laws. Investors are urged to read the Company's filings with U.S. Securities and Exchange Commission which can be viewed online under the Company's profile on EDGAR at www.sec.gov.
Cautionary Note Regarding Non-GAAP Financial Measures
Alternative performance measures in this news release such as "cash cost", "AISC", and Free Cash Flow are furnished to provide additional information. These non-GAAP performance measures are included in this news release because these statistics are used as key performance measures that management uses to monitor and assess performance of the Hycroft Mine, and to plan and assess the overall effectiveness and efficiency of mining operations. These performance measures do not have a standardized meaning within the accounting principles generally accepted in the Unites States of America ("GAAP") and, therefore, amounts presented may not be comparable to similar data presented by other mining companies. These performance measures should not be considered in isolation as a substitute for measures of performance in accordance with GAAP.
Cash Costs
Cash costs include site operating costs (mining, processing, site G&A), refining charges and royalties (excludes corporate office G&A and exploration expenses). While there is no standardized meaning of the measure across the industry, the Company believes that this measure is useful to external users in assessing operating performance.
All-In Sustaining Cost
Site level AISC includes cash costs plus sustaining capital and closure costs. The Company believes that this measure is useful to external users in assessing operating performance and the Company's ability to generate free cash flow from potential operations.
Free Cash Flow
Free cash flows are revenues net of operating costs, royalties, capital expenditures, and cash taxes. The Company believes that this measure is useful to the external users in assessing the Company's ability to generate cash flows.
Appendix
The S-K 1300 Technical Report Summary and Initial Assessment with Economic Analysis was prepared by Ausenco Engineering South USA with contributing authors Ausenco Engineering South USA Inc., Independent Mining Consultants Inc. and WestLand Engineering & Environmental Services, Inc.
The following are summaries of or excerpts from the TRS, do not purport to be complete and are qualified in their entirety by reference to the full text of the TRS.
The Hycroft Mine
The Hycroft mine is among the world's largest precious metals deposits. It is situated on the western flank of the Kamma Mountains on the eastern edge of the Black Rock Desert approximately 54 miles west of Winnemucca in Humboldt and Pershing Counties, Nevada, a Tier-1 mining jurisdiction.
The Technical Study is based on the 2026 Mineral Resource Estimate of 16.4 million ounces of gold and 562.5 million ounces of silver (measured and indicated). An additional 5.0 million ounces of gold and 132.8 million ounces of silver exist in the inferred mineral resource category which was not included in this study.
In 2023, Hycroft announced the discovery of two new high-grade silver systems within the known resource area and the Company is engaged in a significant exploration drill program (2025-2026 drill program) designed to expand these two systems in addition to targeting newly identified high-grade opportunities. These discoveries represent a significant value driver for the Hycroft Mine.
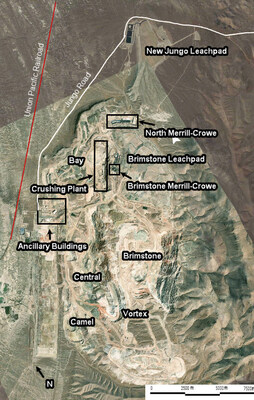
The mine has existing facilities on site including administration buildings, mobile maintenance and light vehicle maintenance shops, warehouse, leach pads, primary, secondary and tertiary crushing systems, assay lab, Merrill-Crowe process plants, refinery and components for a larger second refinery.
Current Property and Facilities Layout
Technical Study Overview
The Technical Study evaluates a heap leaching and milling operation at the Hycroft Mine based on a conventional flotation with POX flowsheet, followed by hot cure, lime boil, cyanide leach, Merrill-Crowe precipitation and refining.
The Technical Study was prepared by Ausenco Engineering USA South Inc. ("Ausenco"), Independent Mining Consultants, Inc. ("IMC"), and WestLand Engineering & Environmental Services, Inc. ("WestLand") in accordance with S-K 1300 and encompasses a mine life of 51 years, processing approximately 57,100 tons per day of sulfide and transition mineralized material.
Economic Analysis Summary
Unit | Value | |
General Inputs | ||
Gold Price | USD$/oz | 3,600 |
Silver Price | USD$/oz | 48 |
Discount Rate | % | 5 |
LOM Production | ||
Total Mineralized Material Mined | kst | 1,496,134 |
Total Waste Mined | kst | 2,320,719 |
Average Strip Ratio | w:o | 1.55 |
Life of Mine | years | 51 |
Total Mill Feed Processed | kst | 1,046,284 |
Average Mill Feed Grade (Au) | oz/st | 0.012 |
Average Mill Feed Grade (Ag) | oz/st | 0.43 |
Total Leach Material Processed | kst | 210,010 |
Average Heap Leach Feed Grade (Au) | oz/st | 0.005 |
Average Heap Leach Feed Grade (Ag) | oz/st | 0.12 |
Average Mill Process Gold Recovery | % | 82.8 |
Average Mill Process Silver Recovery | % | 77.5 |
Average Heap Leach Gold Recovery | % | 40.0 |
Average Heap Leach Silver Recovery | % | 12.0 |
Life of Mine Payable Gold Production | koz | 10,424 |
Life of Mine Payable Silver Production | koz | 347,462 |
Life of Mine Payable Gold Equivalent Production | koz | 15,057 |
Transport, Refining, Royalties | ||
Gold Payable | % | 99.5 |
Silver Payable | % | 99.5 |
NSR Royalty ( | % NSR | 2.14 |
Refining Costs - Au | US$/oz | 5.00 |
Refining Costs - Ag | US$/oz | 0.50 |
Unit | Value | |
LOM Operating Costs | ||
Mining Cost | US$/st mined | 2.28 |
Mining Cost | US$/st processed | 6.91 |
Mill Processing Cost | US$/st processed | 16.65 |
Heap Leach Processing Cost | US$/st processed | 2.49 |
G&A Cost | US$/st processed | 0.53 |
Total Operating Cost | US$/st processed | 21.96 |
Cash Costs1 | US$/oz AuEq | 1,924 |
All-In Sustaining Cost2 | US$/oz AuEq | 2,147 |
Capital Costs | ||
Initial Capital | US$M | 2,434 |
Sustaining Capital | US$M | 3,107 |
Closure Costs | US$M | 243 |
Financials | ||
Pre-Tax NPV ( | US$M | 5,437 |
Pre-Tax IRR | % | 18.9 |
Pre-Tax Payback | years | 4.3 |
Post-Tax NPV ( | US$M | 4,344 |
Post-Tax IRR | % | 16.9 |
Post-Tax Payback | years | 4.7 |
1Cash costs consist of mining costs, processing costs, mine-level G&A and refining charges and royalties |
Significant Leverage to Gold and Silver Prices
LOM Revenue
Capital Costs
Description | Capital Cost (US$M) | Sustaining Cost | Total Cost | |||
Mining | 194 | 1,171 | 1,365 | |||
Crushing | 48 | 60 | 109 | |||
Sulfide Process | 915 | 776 | 1,692 | |||
Oxide Process | 16 | 46 | 63 | |||
Waste Rock Storage & TMF | 208 | 515 | 723 | |||
Onsite Infrastructure | 139 | 9 | 148 | |||
Offsite Infrastructure | 43 | 366 | 409 | |||
Total Direct Costs | 1,563 | 2,944 | 4,507 | |||
Indirects | 382 | 27 | 409 | |||
Provisions | 448 | 136 | 584 | |||
Owner's Costs | 41 | - | 41 | |||
Total Capital Cost | 2,434 | 3,107 | 5,541 | |||
Note: Includes contingencies |
Operating Costs
The total operating costs are estimated at
Cost Area | LOM Total (US$M) | US$/ton processed | % of Total |
Mining | 8,683 | 6.91 | 31.5 |
Process | 18,245 | 14.52 | 66.1 |
G&A | 664 | 0.53 | 2.4 |
Total | 27,592 | 21.96 | 100.0 |
Note: Includes contingencies |
The TRS is based on the 2026 Measured and Indicated Mineral Resources Estimate ("MRE"). The mine plan is based only on measured and indicated mineralization that was estimated in the mineral resource block model. Inferred mineralization was not included within the TRS.
Hycroft Mineral Resource Estimate as of 21 January 2026, US customary Units
Classification | Cutoff Grade $ Net of Refining | Approximate Cutoff, AuEq | Ktons | Gold oz/ton | Silver oz/ton | Sulfide Sulfur % | Contained Ounces | |
Gold Oz x 1000 | Silver Oz x 1000 | |||||||
Heap Leach Resource | ||||||||
Measured | 0.001 - 0.002 | 92,994 | 0.005 | 0.11 | 1.83 | 446 | 10,322 | |
Indicated | 0.001 - 0.002 | 110,374 | 0.004 | 0.09 | 1.54 | 475 | 9,492 | |
Meas + Ind | 0.001 - 0.002 | 203,368 | 0.005 | 0.10 | 1.67 | 921 | 19,814 | |
Inferred | 0.001 - 0.002 | 110,018 | 0.005 | 0.09 | 1.41 | 528 | 10,122 | |
Flotation Mill + Concentrate Treatment by Pressure Oxidation and Cyanide Leach | ||||||||
Measured | 0.007 | 734,571 | 0.011 | 0.43 | 2.03 | 8,154 | 316,600 | |
Indicated | 0.007 | 748,876 | 0.010 | 0.30 | 1.84 | 7,339 | 226,161 | |
Meas + Ind | 0.007 | 1,483,447 | 0.010 | 0.37 | 1.93 | 15,493 | 542,761 | |
Inferred | 0.007 | 459,646 | 0.010 | 0.27 | 1.76 | 4,505 | 122,725 | |
Combined Mineral Resources Leach Plus Mill | ||||||||
Measured | 0.001 - 0.007 | 827,565 | 0.010 | 0.40 | 2.01 | 8,600 | 326,922 | |
Indicated | 0.001 - 0.007 | 859,250 | 0.009 | 0.27 | 1.80 | 7,814 | 235,653 | |
Meas + Ind | 0.001 - 0.007 | 1,686,815 | 0.010 | 0.33 | 1.90 | 16,414 | 562,575 | |
Inferred | 0.001 - 0.007 | 569,664 | 0.009 | 0.23 | 1.69 | 5,033 | 132,847 | |
Notes:
- Mineral resources based on metal prices of
$3,100 $36.00 - Cutoffs are Income – Refining Cost = NSR
- Gold Equivalent (AuEq) for Heap Leach = Cyanide Gold + 0.0019 x Total Silver Assay,
or at average gold leach recovery AuEq = Fire Gold + 0.0035 Total Silver Assay - Gold Equivalent for Mill + Pressure Oxidation = Fire Gold + 0.0107 x Total Silver Assay
- Numbers may not match exactly due to rounding
- Mineral resources are contained within a computer-generated optimized pit
- Total material in that pit is 5.42 billion tons
- Mineral resources are not mineral reserves, and detailed economic considerations have not been applied
- Modifying factors for mine and process design have not been applied
- All units are US customary Ktons means 1,000 short tons. Au and Ag grades are in troy ounces per short ton (oz/ton)
Mining Methods
Hycroft is planned as a conventional hard rock open pit operation. The mine plan is based on measured and indicated mineralization that was estimated in the mineral resource block model. Independent Mining Consultants developed a mine plan that produces the required process feed and moves sufficient mine waste to assure continued release of the mineralization.
The mine will feed two processing facilities:
- A flotation mill followed by pressure oxidation and leaching of the concentrate, and
- A Run-of-Mine ("ROM") heap leach for mineralization that is amenable to direct cyanide leaching.
The cutoff grade for the schedule is based on income net of process:
- Income net of process = Net Return after Refining – Process Costs
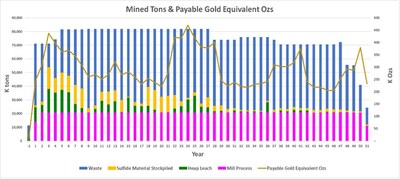
Total mined material begins with 11.3 million tons per annum in preproduction and increases to 71.2 million tons per annum in Years 1 through 3. Additional equipment is acquired later in the mine life with total material movement increasing to 82.0 million tons per annum from Years 5 to 27. From Year 28 until the end of the mine life (Year 51) the total material mined reduces to 70 million tons per annum.
The material planned for milling and leaching on the production schedule is potentially minable material. They do not constitute mineral reserves at this time.
Low-grade mill feed material is stockpiled throughout the mine life. This material is not fed to the mill and is not part of the economic analysis in this report. Further trade-off studies will analyze the opportunity to feed this additional material through the process plant.
Mined Tons & Payable Gold Equivalent Ounces
Production Schedule
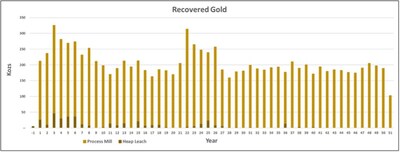
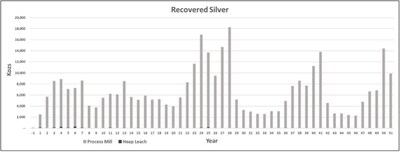
The following graphs reflect the approximate recovered metal produced over the mine life and the relative metal contribution of the heap leach compared to the mill.
Recovered Gold and Silver by Year
Processing and Recovery Methods
A significant portion of the gold and silver in the material going to the process plant is refractory due to its association with pyrite, marcasite, and other sulfide minerals. Oxide and some transition material will be processed on a heap leach pad. A process flowsheet was developed to treat sulfide and certain transition mineralization. These materials are ground and floated to produce a concentrate. The concentrate is then oxidized in the POX plant and subsequently cyanide leached to extract gold and silver.
The key process plant design criteria are:
- Major equipment is designed for a nominal throughput of 57,100 tons/day
- Plant process recovery of
82.8% gold and77.5% silver, given the LOM average grades - Existing crushing circuit consists of primary, secondary, and tertiary crushing, supported by a coarse ore stockpile and a crushed ore stockpile with dedicated feeders to provide continuous feed to the downstream process plant
- Process flowsheets include three stages of crushing followed by two stages of ball milling, flotation, POX, a cyanide leaching circuit for oxidized flotation concentrate, Merrill-Crowe circuit, and Tailings Management Facilities ("TMF"), with an overall availability of
92%
Pregnant solution from the cyanide leach circuit will be processed in the existing Merrill-Crowe zinc cementation facilities.
Infrastructure
The Hycroft Mine benefits from substantial existing infrastructure constructed and operated over decades of prior production. Key existing facilities include:
- Crushing facility
- Heap leach pads
- North Merrill-Crowe facility
- Onsite access, haul roads and a major east–west railway pass adjacent to the Hycroft property
- Truck shop
- Maintenance building
- Laboratory and administrative buildings
- Power is supplied to the site from nearby power lines
- Potable water is sourced from a well
New infrastructure to be constructed includes the Northeast TMF, a Waste Rock Storage Facility, the Process Plant Site and associated infrastructure, a Limestone Plant, and a new rail spur.
The proposed processing facility is designed to be inclusive with (or "of") the existing crushing circuit and North Merrill-Crowe facility. The proposed scope of work includes electrical distribution upgrades, new substations, process control systems, reagent handling facilities (including oxygen and limestone systems), and selective expansion or repurposing of existing maintenance and administrative buildings.
The site currently has access to grid power. Additional transmission capacity is required to support the new plant. The total estimated load factoring for load growth, including power for the oxygen plant, is 160 MW. Tie-ins to existing utilities will include water, compressed air, and potable and sewer systems. The development of a freshwater production well field is also planned to support freshwater needs throughout the LOM.
A rail spur extension from the Union Pacific line is planned to support delivery of reagents, consumables, and fuel. Additionally, the existing fuel island is to be replaced with a higher-efficiency system during the LOM.
Ancillary structures including a covered crushed ore stockpile, new laboratory and maintenance facilities, fuel station upgrades, and technical services expansion are proposed to support operations over the LOM. In addition to this, selected existing buildings will be relocated, expanded, rehabilitated, or repurposed.
Contracts
Hycroft Mine is subject to a royalty agreement (Sprott Royalty Agreement) with SPRL II which was initiated on May 29, 2020. The royalty is accounted for by Hycroft as a deferred gain liability in which Hycroft received a cash consideration of
Environmental, Permitting and Social Considerations
The Mine is located on public land administered by the Bureau of Land Management ("BLM") and private land controlled by Hycroft Resources and Development, LLC, a wholly owned subsidiary of Hycroft Mining Holding Company.
Hycroft is currently authorized to operate under a plan of operations ("POO") for ore extraction and processing, water management, engineering, environmental studies, and exploration. In 2012, the BLM issued a Record of Decision ("ROD") for an EIS conducted for the Mine to expand heap leach operations, open pits, and waste rock facilities. In 2014, the BLM issued a Decision Record with an Environmental Assessment authorizing Hycroft's POO for construction and operations of a rail spur, open pit expansion, and construction of a processing complex, including the TMF located northeast of the Mine.
The TRS outlines development of additional infrastructure to support the modified Project including construction of a new TMF, waste rock storage facilities, rail spur, and a new process plant area. Review and approval of proposed revisions to the POO by the BLM constitutes a federal action under the National Environmental Policy Act and applicable BLM regulations. Accordingly, BLM review of the Plan Application will require preparation of either an Environmental Assessment or an Environmental Impact Statement.

 View original content to download multimedia:https://www.prnewswire.com/news-releases/hycroft-delivers-10-billion-npv-from-technical-report-at-spot-prices-while-advancing-high-grade-brimstone-and-vortex-silver-discoveries-302789162.html
SOURCE Hycroft Mining Holding Corporation
FAQ
AI-generated questions and answers. How Rhea-AI works. Not financial advice.