
Hyperion DeFi Reports 2Q 2026 Financial Results with Another Record Quarterly Net Income and Strong Operating Momentum
Hyperion DeFi (NASDAQ:HYPD) reported unaudited Q2 2026 results with record GAAP net income of $31.0M and Adjusted EBITDA of $53.7M, driven largely by $54.8M in non-GAAP treasury gains.
Rhea-AI Summary
Hyperion DeFi (NASDAQ:HYPD) reported unaudited Q2 2026 results with record GAAP net income of $31.0M and Adjusted EBITDA of $53.7M, driven largely by $54.8M in non-GAAP treasury gains. Adjusted Gross Profit rose 20% sequentially to $1.15M.
Non‑GAAP Net Asset Value increased to $134.2M, with Gross HYPE Holdings at $132.6M and Gross HYPE Tokens up 56% year over year to 2.04M. Operating expenses excluding stock‑based compensation fell to $2.3M, a 46% decline from Q3 2025, while Adjusted Net Operating Cash Flow remained negative at ($2.1M).
Hyperion DeFi reaffirmed 2026 Adjusted Gross Profit guidance of $5M–$7M (~5x 2025) and reiterated expectations for Adjusted Net Operating Cash Flow to turn positive by end‑2026. The company also executed a HAUS agreement with Entropy (HIP‑3), expanded HAUS‑Skew (HIP‑4), maintained HAUS‑Silhouette, redeployed 1M HYPE into HAUS deals, and completed the sale of remaining legacy life sciences IP to Arctic Vision in July 2026.
Positive
- Record net income of $30.95M in Q2 2026, up from $8.84M in Q1 2026
- Adjusted EBITDA reached $53.65M in Q2 2026 versus $19.49M in Q1 2026
- Gross HYPE Tokens grew 56% in 12 months to 2.04M as of June 30, 2026
- Net Asset Value rose to $134.23M and Gross HYPE Holdings to $132.64M in Q2 2026
- Operating expenses excl. SBC declined 46% from $4.32M (Q3 2025) to $2.34M (Q2 2026)
- 2026 Adjusted Gross Profit guidance raised to $5M–$7M, about 5x 2025 actual
Negative
- Adjusted Net Operating Cash Flow remained negative at ($2.12M) in Q2 2026
- DeFi Monetization Adjusted Gross Profit fell 36% QoQ to $158K in Q2 2026
- Adjusted Net Investing Cash Flow was negative at ($6.17M) in Q2 2026
- Net operating cash used in operating activities was ($3.10M) in Q2 2026 despite earnings growth
News Explained
The disclosure announces 500,000 HYPE for Entropy, shows Skew remains pre-launch, and reports a completed $1 million USDC credit deal secured by staked HYPE.
The company announced a HAUS agreement with Entropy involving 500,000 staked HYPE, while its Skew arrangement also deploys 500,000 staked HYPE but its markets are expected to go live in coming months.
Separately, Hyperion says it completed its first institutional credit deal through HyperLend’s Aviya platform, lending
Details
Market move: HYPD +4.83% in the Aug 13 session. 2Q26 earnings report
On Aug 13, the first trading day after this news, HYPD closed 4.83% above the previous close. Argus tracked a peak move of +7.1% during that session. Our momentum scanner recorded 10 alerts for this stock that day. Relative volume reached 48.0x the daily average during tracking.
Data tracked by StockTitan Argus for the Aug 13 session.
Key Figures
- Net Income
- $30,950,963
- Q2 2026 GAAP
- Adjusted EBITDA
- $53,652,846
- Q2 2026
- Adjusted Gross Profit
- $1.15M
- Q2 2026, +20% quarter-over-quarter
- 2026 Adjusted Gross Profit Guidance
- $5M-$7M
- Full-year 2026
- Gross HYPE Tokens
- 2.04 million HYPE Tokens
- June 30, 2026
- Gross HYPE Holdings
- $132.6M
- June 30, 2026
- Ending Cash
- $11,758,699
- Q2 2026 ending cash, cash equivalents, and stablecoins
- Adjusted Net Operating Cash Flow
- ($2.1M)
- Q2 2026
Previous Crypto,earnings Reports
-
Record net income, higher guidance, and increased adjusted gross profit
-
Quarterly net loss driven by substantial treasury losses
-
Fourth-quarter and full-year results call was scheduled
-
Record net income and adjusted EBITDA were reported
-
Third-quarter results call and release timing were announced
24h Move is the share-price change in the day after each event; other market factors may also have contributed.
Key Terms
adjusted ebitda financial
net asset value financial
stablecoins financial
hip-3 technical
AI-generated analysis. How Rhea-AI works. Not financial advice.




Company Reports Record
Announcing New HAUS Agreement with Entropy, an Upcoming HIP-3 Deployer
1 Million HYPE Tokens Redeployed to Support HIP-3 & HIP-4 Markets Since June 2026
Sale of Remaining Legacy Life Sciences IP to Arctic Vision Executed in July 2026
DALLAS, Aug. 12, 2026 (GLOBE NEWSWIRE) -- Hyperion DeFi, Inc. (NASDAQ: HYPD) (“Hyperion DeFi” or the “Company”), the first U.S. publicly listed DeFi company building on Hyperliquid, today reported results for the second quarter ending June 30, 2026.
“We are pleased to report a second consecutive quarter of record Net Income”, said Hyunsu Jung, CEO of Hyperion DeFi. Mr. Jung continued, “In our twelve months of operating performance, we have redefined what it means to be a digital asset treasury. Not only have we substantially grown our treasury position in HYPE, but we have launched multiple scalable businesses and built new products and services on Hyperliquid, all while reducing our costs over time. We continue to position ourselves as the premier institutional gateway to DeFi innovation, and are immensely proud to announce additional partnerships as part of today’s release as we deliver on our mission to revolutionize blockchain financial services.”
Q3’25, Q4’25, Q1’26, and Q2’26 Summary GAAP and Non-GAAP Financial Measures
| (Figures in $) | Q3 2025 | Q4 2025 | Q1 2026 | Q2 2026 | |
| GAAP | Gross Profit | 302,506 | 192,987 | 244,271 | 357,693 |
| Non-GAAP | Adjusted Gross Profit(1) | 439,386 | 820,997 | 959,568 | 1,150,035 |
| GAAP | HYPE Digital Assets | 37,954,590 | 16,233,941 | 25,286,164 | 74,119,231 |
| Non-GAAP | Gross HYPE Holdings(4) | 77,751,604 | 47,837,901 | 71,037,227 | 132,635,212 |
| Non-GAAP | Net Asset Value(9) | 74,545,583 | 44,154,737 | 69,873,504 | 134,226,478 |
| GAAP | Selling, General and Administrative Expense | 2,594,130 | 4,530,542 | 4,493,604 | 3,918,591 |
| Non-GAAP | Operating Expenses Excluding Stock-Based Compensation(5) | 4,315,016 | 3,007,135 | 2,975,883 | 2,344,734 |
| GAAP | Net Operating (Income) Expenses | (4,125,685) | 39,958,264 | (8,487,848) | (30,650,049) |
| Non-GAAP | Treasury Gains (Losses)(6) | 11,868,872 | (36,783,228) | 21,451,862 | 54,815,626 |
| GAAP | Total Other Income (Expense), Net | 2,197,391 | (288) | 108,431 | (56,779) |
| Non-GAAP | Adjusted Other Income (Expense)(7) | (42,240) | 48,717 | 52,585 | 31,919 |
| GAAP | Net Income (Loss) | 6,625,582 | (39,765,565) | 8,840,550 | 30,950,963 |
| Non-GAAP | Adjusted EBITDA(8) | 7,951,003 | (38,920,649) | 19,488,132 | 53,652,846 |
| GAAP | Net Cash and Cash Equivalents Used in Investing Activities | (20,112,041) | (6,319,039) | (1,472,835) | (5,642,387) |
| Non-GAAP | Adjusted Net Investing Cash Flow(17) | (20,112,041) | (6,319,039) | (1,472,835) | (6,165,672) |
| GAAP | Net Cash and Cash Equivalents Used in Operating Activities | (2,822,819) | (4,190,147) | (4,064,063) | (3,098,419) |
| Non-GAAP | Adjusted Net Operating Cash Flow(18) | (2,822,819) | (3,976,135) | (2,607,344) | (2,124,382) |
All figures in this press release are not audited. Throughout this document, totals may not sum due to rounding. Calculations are based on unrounded results. This press release includes certain non-GAAP financial measures (including on a forward-looking basis) such as Adjusted Gross Profit, Gross HYPE Holdings, Net Asset Value, Operating Expenses Excluding Stock-Based Compensation, Treasury Gains (Losses), Adjusted Other Income (Expense), Adjusted EBITDA, Adjusted Net Investing Cash Flow, and Adjusted Net Operating Cash Flow. Please see “Footnotes” and “Non-GAAP Measures of Financial Performance” for reconciliations of non-GAAP financial measures to the most directly comparable GAAP financial measures and important additional information.
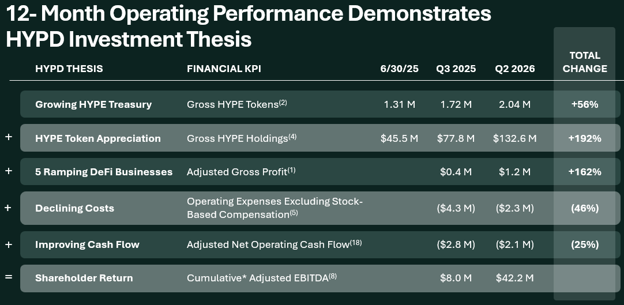
*Cumulative figures for Adjusted EBITDA(8) as of Q3 2025 reflect the three months ended September 30, 2025, and as of Q2 2026 reflect the twelve months ended June 30, 2026. Please see “Footnotes” and “Non-GAAP Measures of Financial Performance” sections for detailed definitions and reconciliations to the nearest GAAP Metric.
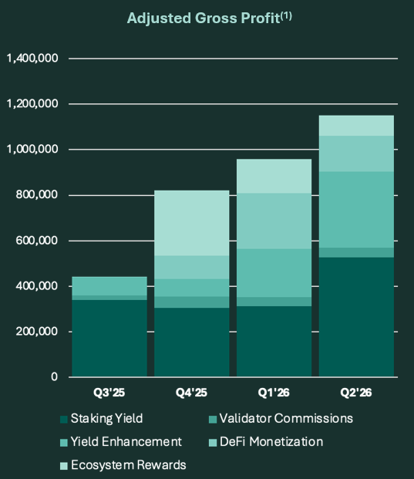
Please see “Footnotes” and “Non-GAAP Measures of Financial Performance” sections for detailed definitions and reconciliations to the nearest GAAP Metric.
| Adjusted Gross Profit(1) (in $ thousands) | Q3'25 | Q4'25 | Q1'26 | Q2'26 | QoQ Growth |
| Ecosystem Rewards | - | 285 | 150 | 90 | ( |
| DeFi Monetization | <1 | 102 | 245 | 158 | ( |
| Yield Enhancement | 78 | 79 | 211 | 334 | + |
| Validator Commissions | 21 | 49 | 40 | 42 | + |
| Staking Yield | 340 | 305 | 313 | 527 | + |
| Adjusted Gross Profit(1) | 439 | 821 | 960 | 1,150 | + |
| Multiple vs. Staking Yield | 1.3x | 2.7x | 3.1x | 2.2x | |
| % Earned in Cash* | 18% | 22% | 48% | 50% | |
| HYPE Earned in Staking & Validating(2) | 7,895 | 10,076 | 11,458 | 11,115 | |
| Effective Average HYPE Price In-Period(3) | 45.76 | 35.12 | 30.82 | 51.23 |
*The portion of Adjusted Gross Profit(1) earned in cash, cash equivalents, and stablecoins(16). Please see “Footnotes” and “Non-GAAP Measures of Financial Performance” sections for detailed definitions and reconciliations to the nearest GAAP Metric.
| HYPE Treasury Over Time | 6/30/25* | 09/30/25 | 12/31/25 | 3/31/26 | 6/30/26 | Basis(14) | ||||||
| Gross HYPE Tokens(2) | 1.31 M | 1.72 M | 1.88 M | 1.94 M | 2.04 M | 2.04 M | ||||||
| HYPE Token Price | ||||||||||||
| Gross HYPE Holdings(4) | ||||||||||||
| Cash, Cash Equivalents, and Stablecoins(16) | ||||||||||||
*The June 30, 2025 Gross HYPE Holdings figure represents HYPE Digital Assets held at cost basis. Please see “Footnotes” and “Non-GAAP Measures of Financial Performance” sections for detailed definitions and reconciliations to the nearest GAAP Metric.
| Non-GAAP Income Summary (Figures in $) | Q3 2025 | Q4 2025 | Q1 2026 | Q2 2026 |
| Adjusted Gross Profit(1) | 439,386 | 820,997 | 959,568 | 1,150,035 |
| Operating Expenses Excluding Stock-Based Compensation(5) | 4,315,016 | 3,007,135 | 2,975,883 | 2,344,734 |
| Treasury Gains (Losses)(6) | 11,868,872 | (36,783,228) | 21,451,862 | 54,815,626 |
| Adjusted Other Income (Expense)(7) | (42,240) | 48,717 | 52,585 | 31,919 |
| Adjusted EBITDA(8) | 7,951,003 | (38,920,649) | 19,488,132 | 53,652,846 |
Please see “Footnotes” and “Non-GAAP Measures of Financial Performance” sections for detailed definitions and reconciliations to the nearest GAAP Metric.
| Non-GAAP Cash Flow Summary (Figures in $) | Q3 2025 | Q4 2025 | Q1 2026 | Q2 2026 |
| Adjusted Net Operating Cash Flow(18) | (2,822,819) | (3,976,135) | (2,607,344) | (2,124,382) |
| Adjusted Net Investing Cash Flow(17) | (20,112,041) | (6,319,039) | (1,472,835) | (6,165,672) |
| Net Cash Provided by Financing Activities | 23,625,749 | 8,596,884 | 6,606,942 | 10,997,100 |
| Change in Cash, Cash Equivalents, and Stablecoins(16) | 690,889 | (1,698,290) | 2,526,763 | 2,707,046 |
| Ending Cash, Cash Equivalents, and Stablecoins(16) | 8,223,180 | 6,524,890 | 9,051,653 | 11,758,699 |
Please see “Footnotes” and “Non-GAAP Measures of Financial Performance” sections for detailed definitions and reconciliations to the nearest GAAP Metric.
| Adjusted Gross Profit(1) Guidance | Q3'25 | Q4'25 | FY'25 | Q1'26 | Q2'26 | Q3'26 | Q4'26 | FY'26 Guidance | 2026 Guidance vs. 2025 Actual |
| Initial Guidance (Q4'25 A) | - | - | - | - | ~ 4x | ||||
| Current Guidance (Q2'26 A) | - | - | ~ 5x |
Please see “Footnotes” and “Non-GAAP Measures of Financial Performance” sections for detailed definitions and reconciliations to the nearest GAAP Metric.
HYPD Investment Thesis & 1-Year Trailing Results
In June of 2025, Hyperion DeFi was born from what was formerly Eyenovia. We revamped the company’s operating strategy to the accumulation of HYPE and directly building in the Hyperliquid ecosystem. We made a firm commitment that we would be more than just HYPE, benefitting from not just holding the asset, but uniquely building multiple business atop it that have the potential to leverage it profitably. Our model is no longer a concept that we ask investors to envision, it has become reality.
Our unique strategy shares in multiple frontiers of value creation at the same time. Those three frontiers include (1) our growing HYPE treasury, (2) our scalable DeFi businesses, and (3) our embedded economic upside in the Hyperliquid ecosystem. We call this our HYPD “Triple-Dip” Strategy, and we believe our results over the past twelve months speak for themselves.
- Growing HYPE Treasury: From June 2025 to June 2026, our Gross HYPE Tokens(2) have increased
56% from 1.31 million to 2.04 million HYPE Tokens. - Five Scalable Businesses: From Q3 2025 to Q2 2026, our quarterly Adjusted Gross Profit(1) has grown
162% from$0.4 million to$1.2 million as our DeFi businesses have begun to ramp. We have consistently earned 2x-3x base HYPE staking yield over the past three reporting quarters. - Embedded Economic Upside in the Hyperliquid Ecosystem: We have received tokens, equity, or future rights to tokens or equity in four early-stage builders on Hyperliquid: Kinetiq, HyperLend, Silhouette, and Skew.
- Declining Cost Base: From Q3 2025 to Q2 2026, our Operating Expenses Excluding Stock-Based Compensation(5) declined
46% from$4.3 million to$2.3 million . Our legacy biotech segment has been wound down as of June 30, 2026, and in July, we sold all remaining Optejet IP to Arctic Vision. - Improving Cash Flows: From Q3 2025 to Q2 2026, quarterly Adjusted Net Operating Cash Flow(18) has declined from (
$2.8 million ) to ($2.1 million )dollars (25 % decline), both as a function of reduced costs and ramping DeFi businesses. For the past two quarters,40% -50% of our Adjusted Gross Profit(1) was denominated in cash, cash equivalents, and stablecoins(16). - Guidance: We continue to anticipate
$5 million to$7 million Adjusted Gross Profit(1) in 2026, approximately 5x our 2025 FY results. And, we anticipate our Adjusted Net Operating Cash Flow(18) to flip positive by the end of 2026.
Adjusted Gross Profit(1) in Q2’26 and Q1’26
Adjusted Gross Profit(1), a Non-GAAP Metric, aims to capture all of Hyperion DeFi’s value-add operating business activities beyond gains and losses in our digital asset treasury. In total, Adjusted Gross Profit(1) increased +
- Staking Yield: We stake our HYPE to our Validator and earn rewards.
- On a dollar basis, our HYPE earned from staking generated
$527 thousand Adjusted Gross Profit(1) in Q2’26 versus$313 thousand in Q1’26 (+69% quarter-over-quarter), largely driven by an increase in the Effective Average HYPE Price In-Period(3) to 51.2 in Q2’26 from 30.8 in Q1’26.
- On a dollar basis, our HYPE earned from staking generated
- Validator Commissions: The Company operates its Validator under a Joint Validator Operators Agreement (together with Kinetiq and MAVAN) and earns commissions on rewards delivered to third-party tokens delegated to the Validator.
- On a dollar basis, our HYPE earned from validator commissions generated
$42 thousand Adjusted Gross Profit(1) in Q2’26 versus$40 thousand in Q1’26 (+4% quarter-over-quarter). - Approximately 7 million HYPE tokens were delegated to our Validator as of July 31, 2026(2).
- In June 2026, Blockdaemon announced it has selected Kinetiq x Hyperion as their institutional staking partner on Hyperliquid.
- We continue to explore opportunities to generate income by building on top of our existing validator infrastructure.
- In total, the Company earned 11.1 thousand HYPE tokens from staking and validating activities in Q2’26, versus 11.5 thousand in Q1’26(2).
- On a dollar basis, our HYPE earned from validator commissions generated
- Yield Enhancement: The Company pursues accretive strategies to enhance yield earned on its tokens.
- Yield Enhancement activities generated
$334 thousand Adjusted Gross Profit(1) in Q2’26 versus$211 thousand in Q1’26 (+58% quarter-over-quarter). - Q2’26 and Q1’26 Yield Enhancement activities included multiple HYPE volatility strategies OTC and on-chain.
- In Q1’26, we began executing within our Institutional Volatility Income Vault, in partnership with the Rysk protocol, further optimizing our Yield Enhancement capabilities while building the infrastructure to accommodate third-party execution within Rysk Premium in the future.
- Yield Enhancement activities generated
- DeFi Monetization: The Company supports and monetizes Hyperliquid DeFi activity with sustainable, scalable practices.
- Quarterly Results: DeFi Monetization activity generated
$158 thousand Adjusted Gross Profit(1) in Q2’26, a decline of (36% ) versus$245 thousand in Q1’26. - USDH Sunset: As previously disclosed, the sunset of the USDH stablecoin drove a termination of our HYPE Asset Use Service (HAUS) agreements with Native Markets and Felix in June 2026, opening up 800,000 of our HYPE tokens to be redeployed into other business opportunities.
- Maintaining Guidance: We reiterated our 2026 Adjusted Gross Profit(1) and cash flow guidance in June 2026, and we reiterate that same guidance again today, because the financial impact of the USDH sunset was immaterial and our strategic response was swift. This is the nature of operating in a fast-moving ecosystem: individual products may come and go, but what endures is our position as an early partner builders come to for support. We believe the strength of our strategic positioning was demonstrated within weeks via our two new HAUS agreements deploying 1 million HYPE tokens as detailed below.
- HAUS-Skew (HIP-4): In July we announced our HAUS agreement with Skew Technologies to launch permissionless markets on Hyperliquid including an institutional listing service. And, with Hyperliquid’s recent HIP-4 announcements in July, we and the Skew team have decided that HIP-4 outcome markets will be the better fit for what we are building. This structure deploys 500,000 staked HYPE with a team purpose-built for onboarding new market categories to Hyperliquid. We expect the markets to go live in the coming months, with economics that improve upon our prior deployer arrangement, in addition to long-term equity and token exposure to Skew. The early metrics are positive, with over 40,000 unique users signed up to access Skew’s private beta as of August 10, 2026.
- HAUS-Entropy (HIP-3): We are announcing today a HAUS partnership with Entropy, an upcoming HIP-3 deployer, with 500,000 of our staked HYPE. Not only does this second deployer provide us with multiple opportunities to both support and scale unique businesses on Hyperliquid, but it allows us to converge the building blocks we are developing alongside our partners in this ecosystem.
- HAUS-Silhouette (Trading Fee Reduction): In March 2026 we launched a HAUS agreement on 100,000 HYPE tokens with Silhouette, whereby Silhouette receives reduced trading fees for their clients and we receive a portion of those savings as revenue. Silhouette (which provides shielded trading on Hyperliquid to its clients) completed its migration into production in Q2’26. We saw monthly volumes step up from the hundreds of thousands toward over
$40 million cumulative as of August 10, 2026, consistent with the trajectory we outlined in May. This was driven by Silhouette’s support for RWA spot trading, which we expect to continue to accelerate on Hyperliquid as more assets become tokenized and move on-chain. - HAUS Pipeline: We maintain our pipeline of prospective HAUS clients and continue to be selective, prioritizing structures that return durable, volume-linked value to our supported markets. The value of natively staked HYPE continues to be demonstrated across these services.
- On-Chain Credit: In July 2026, we completed our first institutional credit deal through HyperLend's Aviya platform, lending
$1M USDC against natively staked HYPE at a rate of8% APY, far above the overnight rate found in traditional markets. The HYPE collateral remains in secure custody at Anchorage Digital for the duration of the loan. We expect the Aviya platform to scale as demand grows for institutional borrowing and lending against robust collateral, and we are entitled to a revenue share on a portion of future activity on Aviya.
- Quarterly Results: DeFi Monetization activity generated
- Ecosystem Rewards: Through our active participation in the Hyperliquid DeFi ecosystem, the Company positions itself for the receipt of future potential token airdrops, protocol incentives, and other rewards that may become available periodically.
- Ecosystem Rewards generated
$90 thousand Adjusted Gross Profit(1) in Q2’26, versus$150 thousand in Q1’26.
- We expect the quarter-over-quarter change in Ecosystem Rewards to be volatile given the unexpected timing of airdrops, token generation events, and other rewards activity.
- The Q2 figure reflects two elements: (1) our receipt and subsequent sale of the MAX token airdrop and (2) a one-time grant from Felix due to the sunset of USDH, denominated in USDC.
- We expect the quarter-over-quarter change in Ecosystem Rewards to be volatile given the unexpected timing of airdrops, token generation events, and other rewards activity.
- In November 2025, we received 1.92 million KNTQ tokens in Kinetiq’s airdrop token generation event. We are liquid-staking our KNTQ with Kinetiq and earning more KNTQ tokens over time. KNTQ staking yields have recently exceeded
7% annualized, and we have accrued over 40,000 additional KNTQ tokens in 2026. - In March 2026, we received 10 million HPL tokens from HyperLend in connection with multiple partnership and revenue-sharing agreements in connection with on-chain credit pools.
- Silhouette is contractually obligated to award HYPD at least
1% of future token supply or equity. - As part of our HAUS agreement with Skew announced in July 2026, Skew is contractually obligated to award HYPD at least
5% Skew equity plus5% of Skew token supply to the extent there is a future Skew token generation event. - Given our partnerships with other Hyperliquid ecosystem participants such as Rysk, and given that we are continuing to accrue additional Kinetiq points, we anticipate additional ecosystem rewards in 2026.
- Ecosystem Rewards generated
Q2’26 and Q1’26 Expense Summary Results
- Operating Expenses Excluding Stock-Based Compensation(5) declined (
21% ) quarter-over-quarter to$2.3 million in Q2’26 from$3.0 million in Q1’26.
$2.3 million Operating Expenses Excluding Stock-Based Compensation(5) in Q2’26 represents a (46% ) decline versus$4.3 million in Q3’25.
- As of June 30, 2026, we have substantially wound down all operations related to our legacy biotech segment.
- In July 2026, we executed a sale of all our remaining IP associated with our legacy biotech segment to Arctic Vision in exchange for a release of indebtedness owed by the Company.
- From July 2025 through July 2026, as part of our biotech wind-down negotiation efforts, we have cumulatively released over
$2.7 million of liabilities and indebtedness owed by the Company to its legacy partners.
Q2’26 and Q1’26 Treasury Summary
- Gross HYPE Tokens(2) increased to 2.04 million in Q2’26 from 1.94 million in Q1’26.
- Gross HYPE Holdings(4) increased to
$132.6 million in Q2’26 from$71.0 million in Q1’26, as the price of HYPE increased to$65.0 in Q2’26 from$36.6 in Q1’26. - Net Asset Value(9) increased to
$134.2 million in Q2’26 from$69.9 million in Q1’26. - Treasury Gains (Losses)(6) was
$54.8 million in Q2’26 versus$21.5 million in Q1’26.
Q2’26 and Q1’26 Net Income and Adjusted EBITDA(8)
- Q2’26 Net Income was
$31.0 million , a second sequential quarterly record for the company, versus$8.8 million in Q1’26. - Q2’26 Adjusted EBITDA(8) of
$53.7 million compares to$19.5 million in Q1’26.
- The primary reconciliation of Net Income to Adjusted EBITDA(8) continues to be driven by our HYPE Liquid Staking Tokens (LSTs), for which the GAAP carrying value is the low-water-mark price of HYPE, as detailed further in our GAAP to Non-GAAP reconciliations section at the end of this release.
- The primary reconciliation of Net Income to Adjusted EBITDA(8) continues to be driven by our HYPE Liquid Staking Tokens (LSTs), for which the GAAP carrying value is the low-water-mark price of HYPE, as detailed further in our GAAP to Non-GAAP reconciliations section at the end of this release.
- Q2’26 Net Income per Common Share of
$1.01 on a basic basis (14,173,457 weighted average shares) and$0.92 on a diluted basis (17,066,826 weighted average shares) compares to Q1’26 Net Income per Common Share of$0.30 on a basic basis (10,610,679 weighted average shares) and$0.26 on a diluted basis (12,686,142 weighted average shares). - As of August 10, 2026, there are 15,539,434 outstanding shares of HYPD common stock.
Q2’26 and Q1’26 Cash Flows Summary
- Adjusted Net Operating Cash Flow(18) was (
$2.1 million ) in Q2’26 versus ($2.6 million ) in Q1’26. - Adjusted Net Investing Cash Flow(17) was (
$6.2 million ) in Q2’26 versus ($1.5 million ) in Q1’26. - Net Cash Provided by Financing Activities was
$11.0 million in Q2’26 versus$6.6 million in Q1’26. Our public offering in May 2026 generated a total of$9.3 million net proceeds. - Our cash, cash equivalents, and stablecoins(16) totaled
$11.8 million as of Q2’26 versus$9.1 million as of Q1’26.
Conference Call & Webcast
Hyperion DeFi, Inc. will hold its earnings conference call and webcast for the second quarter ended June 30, 2026 on Wednesday, August 12, 2026 at 5:00 p.m. Eastern Time. A slide presentation that includes supplemental financial information and reconciliations of certain non-GAAP measures to their most directly comparable GAAP measures can be accessed through the Company’s Investor Relations website at https://ir.hyperiondefi.com/events-and-presentations along with information for the conference call. A webcast of the call will be archived and available through August 26, 2026 at 11:59 p.m. Eastern Time on the Company's website.
Presentation
All growth rates represent quarter-over-quarter comparisons, except as otherwise noted. All amounts in tables are presented in U.S. dollars, rounded to the nearest dollar, except as otherwise noted. As a result, certain amounts and rates may not sum or recalculate using the rounded dollar amounts provided. All numbers in this press release are not audited.
About the Hyperliquid Platform and the HYPE Token
Hyperliquid is a next-generation layer one blockchain optimized for high frequency, transparent trading. The blockchain includes fully on-chain perpetual futures and spot order books, with every order, cancel, trade, and liquidation occurring within 70 millisecond block times. It also hosts the HyperEVM, a general-purpose smart contract platform that supports permissionless decentralized financial applications akin to Ethereum.
HYPE is the native token of Hyperliquid. Staked HYPE provides utility for users via reduced trading fees and increased referral bonuses. As of July 2026, more than 46 million HYPE have been autonomously purchased and sequestered by the blockchain with the trading fees generated on the network’s central limit order books.
About Hyperion DeFi, Inc.
Hyperion DeFi, Inc. is the first U.S. publicly listed DeFi company building on Hyperliquid. The Company provides investors with streamlined access to the Hyperliquid ecosystem, one of the fastest growing, highest revenue-generating blockchains in the world. Shareholders benefit from compounding exposure to HYPE, both from its native staking yield and additional revenues generated from its unique on-chain utility.
For more information, please visit Hyperiondefi.com or follow @hyperiondefi on X.
Use of Non-GAAP Financial Measures
This press release includes certain non-GAAP financial measures (including on a forward-looking basis) such as Adjusted Gross Profit, Gross HYPE Holdings, Net Asset Value, Operating Expenses Excluding Stock-Based Compensation, Treasury Gains (Losses), Adjusted Other Income (Expense), Adjusted EBITDA, Adjusted Net Investing Cash Flow, and Adjusted Net Operating Cash Flow. These non-GAAP measures are in addition to, and not a substitute for or superior to, measures of financial performance prepared in accordance with GAAP and should not be considered as an alternative to any performance measures derived in accordance with GAAP. Reconciliations of non-GAAP measures to their most directly comparable U.S. Generally Accepted Accounting Principles (GAAP) counterparts are included in the Non-GAAP Reconciliations section of this press release with additional detail in the Footnotes. Hyperion DeFi believes that these non-GAAP measures of financial results (including on a forward-looking basis) provide useful supplemental information to investors about Hyperion DeFi. Hyperion DeFi’s management uses non-GAAP measures to evaluate our operating performance, formulate business plans, help better assess our overall liquidity position, and make strategic decisions, including those relating to operating expenses and the allocation of internal resources. However, these non-GAAP measures have limitations as analytical tools. Other companies may not use these non-GAAP measures or may use similar measures that are defined in a different manner. Therefore, Hyperion DeFi’s non-GAAP measures may not be directly comparable to similarly titled measures of other companies. We also periodically review our non-GAAP financial measures and may revise these measures to reflect changes in our business or otherwise. Additionally, forward-looking non-GAAP financial measures are presented on a non-GAAP basis without reconciliations of such forward-looking non-GAAP measures because the GAAP financial measures are not accessible on a forward-looking basis and reconciling information is not available without unreasonable effort due to the inherent difficulty in forecasting and quantifying certain amounts that are necessary for such reconciliations, including adjustments reflected in our reconciliation of historic non-GAAP financial measures, the amounts of which, based on historical experience, could be material.
Forward Looking Statements; Disclaimer
Except for historical information, all the statements, expectations and assumptions contained in this press release are forward-looking statements. Forward-looking statements include, but are not limited to, statements that express our intentions, beliefs, expectations, strategies, predictions or any other statements, our future activities or other future events or conditions, including the viability of, and risks associated with, our cryptocurrency treasury strategy, the growth and revenue potential of the Hyperliquid ecosystem and the growth prospects of the Company. These statements are based on current expectations, estimates and projections about our business based, in part, on assumptions made by management. These statements are not guarantees of future performance and involve risks, uncertainties and assumptions that are difficult to predict. Therefore, actual outcomes and results may, and in some cases are likely to, differ materially from what is expressed or forecasted in the forward-looking statements due to numerous factors discussed from time to time in documents which we file with the U.S. Securities and Exchange Commission.
Any forward-looking statements speak only as of the date on which they are made, and except as may be required under applicable securities laws, Hyperion DeFi does not undertake any obligation to update any forward-looking statements.
Certain information contained in this press release relates to or is based on studies, publications, surveys and other data obtained from third-party sources and Hyperion DeFi’s own internal estimates and research. While Hyperion DeFi believes these third-party studies, publications, surveys and other data to be reliable as of the date of this press release, it has not independently verified, and makes no representation as to the adequacy, fairness, accuracy or completeness of, any information obtained from third-party sources. In addition, no independent source has evaluated the reasonableness or accuracy of Hyperion DeFi’s internal estimates or research and no reliance should be made on any information or statements made in this press release relating to or based on such internal estimates and research. You should conduct your own investigation and analysis of Hyperion DeFi, its business, prospects, results of operations and financial condition. In furnishing this information, Hyperion DeFi does not undertake any obligation to provide you with access to any additional information (including forward-looking information and any projections contained herein) or to update or correct the information.
Hyperion DeFi, Inc. Investor Contact:
Jason Assad
Hyperion DeFi, Inc.
IR@hyperiondefi.com
(678) 570-6791
| Hyperion DeFi, Inc. Condensed Balance Sheets (unaudited) | |||||||||||||||
| June 30, | December 31, | ||||||||||||||
| 2026 | 2025 | ||||||||||||||
| (unaudited) | |||||||||||||||
| Assets | |||||||||||||||
| Current Assets | |||||||||||||||
| Cash and cash equivalents | $ | 9,637,216 | $ | 6,310,878 | |||||||||||
| Prepaid expenses and other current assets | 3,271,661 | 934,931 | |||||||||||||
| Total Current Assets | 12,908,877 | 7,245,809 | |||||||||||||
| Digital assets | 74,119,231 | 16,345,347 | |||||||||||||
| Digital assets receivable, net | — | 6,935,131 | |||||||||||||
| Digital intangible assets | 25,721,566 | 20,591,555 | |||||||||||||
| Operating lease right-of-use asset | 207,044 | 415,998 | |||||||||||||
| Other assets | 182,200 | 230,416 | |||||||||||||
| Total Assets | $ | 113,138,918 | $ | 51,764,256 | |||||||||||
| Liabilities and Stockholders’ Equity | |||||||||||||||
| Current Liabilities: | |||||||||||||||
| Accounts payable | $ | 139,114 | $ | 317,900 | |||||||||||
| Accrued expenses and other current liabilities | 2,153,114 | 1,871,106 | |||||||||||||
| Operating lease liabilities - current portion | 417,593 | 512,007 | |||||||||||||
| Notes payable - current portion, net | 2,798,981 | — | |||||||||||||
| Total Current Liabilities | 5,508,802 | 2,701,013 | |||||||||||||
| Notes payable - non-current portion, net | 5,639,696 | 7,796,136 | |||||||||||||
| Operating lease liabilities, non-current portion | 55,649 | 206,600 | |||||||||||||
| Total Liabilities | 11,204,147 | 10,703,749 | |||||||||||||
| Commitments and contingencies (Note 9) | |||||||||||||||
| Stockholders’ Equity | |||||||||||||||
| Preferred stock, | 524 | 544 | |||||||||||||
| Common stock, | 1,531 | 876 | |||||||||||||
| Additional paid-in-capital | 302,765,630 | 281,937,072 | |||||||||||||
| Treasury stock, at cost, 0 and 82,324 shares as of June 30, 2026 and December 31, 2025, respectively | — | (253,558 | ) | ||||||||||||
| Accumulated deficit | (200,832,914 | ) | (240,624,427 | ) | |||||||||||
| Total Stockholders’ Equity | 101,934,771 | 41,060,507 | |||||||||||||
| Total Liabilities and Stockholders’ Equity | $ | 113,138,918 | $ | 51,764,256 | |||||||||||
| Hyperion DeFi, Inc. Condensed Statements of Operations (unaudited) | ||||||||||||||||
| For the Three Months Ended | For the Six Months Ended | |||||||||||||||
| June 30, | June 30, | |||||||||||||||
| 2026 | 2025 | 2026 | 2025 | |||||||||||||
| Revenue | $ | 357,693 | $ | — | $ | 601,964 | $ | 14,720 | ||||||||
| Cost of revenue | — | — | — | (48 | ) | |||||||||||
| Gross Profit | 357,693 | — | 601,964 | 14,672 | ||||||||||||
| Operating (Income) Expenses: | ||||||||||||||||
| Research and development | 58,492 | 674,578 | 345,256 | 1,347,621 | ||||||||||||
| Selling, general and administrative | 3,918,591 | 7,678,704 | 8,412,195 | 10,051,026 | ||||||||||||
| Impairment of right of use assets | 57,773 | — | 57,773 | — | ||||||||||||
| Realized gain - digital assets and digital assets receivable, net | (17,859,505 | ) | — | (21,483,269 | ) | — | ||||||||||
| Unrealized gain - digital assets, net | (16,939,634 | ) | — | (27,913,613 | ) | — | ||||||||||
| Unrealized loss – digital intangible assets receivable | 367,251 | — | — | — | ||||||||||||
| Impairment loss - digital intangible assets | 768,857 | — | 2,000,525 | — | ||||||||||||
| Net gain on derivative instruments | (112,032 | ) | — | (151,433 | ) | — | ||||||||||
| Recovery of credit losses | (909,842 | ) | — | (405,331 | ) | — | ||||||||||
| Total Operating (Income) Expenses, Net | (30,650,049 | ) | 8,353,282 | (39,137,897 | ) | 11,398,647 | ||||||||||
| Income (Loss) From Operations | 31,007,742 | (8,353,282 | ) | 39,739,861 | (11,383,975 | ) | ||||||||||
| Other Income (Expense): | ||||||||||||||||
| Other income (expense), net | (29,783 | ) | 168,840 | 60,350 | 172,527 | |||||||||||
| Gain on extinguishment of liabilities | — | — | — | 89,623 | ||||||||||||
| Interest expense | (233,760 | ) | (528,410 | ) | (459,629 | ) | (1,109,909 | ) | ||||||||
| Interest income | 206,764 | 21,933 | 450,931 | 57,282 | ||||||||||||
| Total Other Income (Expense), Net | (56,779 | ) | (337,637 | ) | 51,652 | (790,477 | ) | |||||||||
| Net Income (Loss) | 30,950,963 | (8,690,919 | ) | 39,791,513 | (12,174,452 | ) | ||||||||||
| Dividend to preferred stockholders | (718,478 | ) | (97,167 | ) | (1,533,775 | ) | (97,167 | ) | ||||||||
| Net Income (Loss) Attributable to Participating Securities | $ | 30,232,485 | $ | (8,788,086 | ) | $ | 38,257,738 | $ | (12,271,619 | ) | ||||||
| Less: income allocated to preferred stockholders | (15,892,379 | ) | — | (21,378,486 | ) | — | ||||||||||
| Net Income (Loss) Available to Common Stockholders - Basic | $ | 14,340,105 | $ | (8,788,086 | ) | $ | 16,879,251 | $ | (12,271,619 | ) | ||||||
| Add: undistributed earnings reallocated to common upon assumed exercise/vesting of dilutive securities | 1,402,996 | — | 1,833,467 | — | ||||||||||||
| Net Income (Loss) Available to Common Stockholders - Diluted | $ | 15,743,102 | $ | (8,788,086 | ) | $ | 18,712,718 | $ | (12,271,619 | ) | ||||||
| Basic earnings (loss) per common share: | ||||||||||||||||
| Net basic earnings (loss) per share | $ | 1.01 | $ | (2.50 | ) | $ | 1.36 | $ | (4.29 | ) | ||||||
| Diluted earnings (loss) per common share: | ||||||||||||||||
| Net diluted earnings (loss) per share | $ | 0.92 | $ | (2.50 | ) | $ | 1.25 | $ | (4.29 | ) | ||||||
| Weighted average shares outstanding | ||||||||||||||||
| Basic | 14,173,457 | 3,518,906 | 12,401,910 | 2,857,596 | ||||||||||||
| Diluted | 17,066,826 | 3,518,906 | 15,038,798 | 2,857,596 | ||||||||||||
| Hyperion DeFi, Inc. Condensed Statements of Stockholders’ Equity (Deficit) (unaudited) | |||||||||||||||||||||||||||||||||
| For the Three and Six Months Ended June 30, 2026 | |||||||||||||||||||||||||||||||||
| Additional | Total | ||||||||||||||||||||||||||||||||
| Preferred Stock | Common Stock | Paid-In | Treasury Stock | Accumulated | Stockholders’ | ||||||||||||||||||||||||||||
| Shares | Amount | Shares | Amount | Capital | Shares | Amount | Deficit | Equity | |||||||||||||||||||||||||
| Balance - January 1, 2026 | 5,435,897 | $ | 544 | 8,762,329 | $ | 876 | $ | 281,937,072 | 82,324 | $ | (253,558 | ) | $ | (240,624,427 | ) | $ | 41,060,507 | ||||||||||||||||
| Issuance of common stock in At the Market offering [1] | — | — | 1,859,993 | 186 | 6,665,196 | — | — | — | 6,665,382 | ||||||||||||||||||||||||
| Issuance of common stock for payment in kind of preferred stock dividend | — | — | 244,518 | 25 | 939,312 | — | — | — | 939,337 | ||||||||||||||||||||||||
| Issuance of common stock from the delivery of vested restricted stock units | — | — | 55,277 | 5 | (5 | ) | — | — | — | — | |||||||||||||||||||||||
| Shares withheld to settle employee tax liability upon delivery of RSU equity compensation. | — | — | (21,761 | ) | (2 | ) | 2 | — | — | — | — | ||||||||||||||||||||||
| Issuance of common stock from conversion of preferred stock | (200,000 | ) | (20 | ) | 600,000 | 60 | (40 | ) | — | — | — | — | |||||||||||||||||||||
| Retirement of treasury shares | — | — | (82,324 | ) | (8 | ) | (253,550 | ) | (82,324 | ) | 253,558 | — | — | ||||||||||||||||||||
| Stock-based compensation: | |||||||||||||||||||||||||||||||||
| Amortization of stock option awards | — | — | — | — | 80,880 | — | — | — | 80,880 | ||||||||||||||||||||||||
| Amortization of restricted stock units | — | — | — | — | 1,690,852 | — | — | — | 1,690,852 | ||||||||||||||||||||||||
| Issuance of common stock to vendors as consideration for service provided | — | — | 10,450 | 1 | 32,752 | — | — | — | 32,753 | ||||||||||||||||||||||||
| Preferred stock dividend ( | — | — | — | — | (815,297 | ) | — | — | — | (815,297 | ) | ||||||||||||||||||||||
| Net income | — | — | — | — | — | — | — | 8,840,550 | 8,840,550 | ||||||||||||||||||||||||
| Balance - March 31, 2026 | 5,235,897 | 524 | 11,428,482 | 1,143 | 290,277,174 | — | — | (231,783,877 | ) | 58,494,964 | |||||||||||||||||||||||
| Issuance of common stock in public offering [2] | — | — | 2,910,027 | 291 | 9,327,030 | — | — | — | 9,327,321 | ||||||||||||||||||||||||
| Issuance of common stock in At the Market offering [3] | — | — | 492,783 | 49 | 1,846,850 | — | — | — | 1,846,899 | ||||||||||||||||||||||||
| Issuance of common stock for payment in kind of preferred stock dividend | — | — | 236,318 | 24 | 779,826 | — | — | — | 779,850 | ||||||||||||||||||||||||
| Issuance of common stock from the delivery of vested restricted stock units | — | — | 308,407 | 31 | (31 | ) | — | — | — | — | |||||||||||||||||||||||
| Shares withheld to settle employee tax liability upon delivery of RSU equity compensation. | — | — | (82,894 | ) | (8 | ) | (379,090 | ) | — | — | — | (379,098 | ) | ||||||||||||||||||||
| Stock-based compensation: | |||||||||||||||||||||||||||||||||
| Amortization of stock option awards | — | — | — | — | 59,852 | — | — | — | 59,852 | ||||||||||||||||||||||||
| Amortization of restricted stock units | — | — | — | — | 1,546,884 | — | — | — | 1,546,884 | ||||||||||||||||||||||||
| Issuance of common stock to vendors as consideration for service provided | — | — | 6,709 | 1 | 25,613 | — | — | — | 25,614 | ||||||||||||||||||||||||
| Preferred stock dividend ( | — | — | — | — | (718,478 | ) | — | — | — | (718,478 | ) | ||||||||||||||||||||||
| Net income | — | — | — | — | — | — | — | 30,950,963 | 30,950,963 | ||||||||||||||||||||||||
| Balance - June 30, 2026 | 5,235,897 | $ | 524 | 15,299,832 | $ | 1,531 | $ | 302,765,630 | — | — | $ | (200,832,914 | ) | $ | 101,934,771 | ||||||||||||||||||
| Hyperion DeFi, Inc. Condensed Statements of Stockholders’ Equity (Deficit), continued (unaudited) | ||||||||||||||||||||||||||||
| For the Three and Six Months Ended June 30, 2025 | ||||||||||||||||||||||||||||
| Additional | Total | |||||||||||||||||||||||||||
| Preferred Stock | Common Stock | Paid-In | Treasury Stock | Accumulated | Stockholders’ | |||||||||||||||||||||||
| Shares | Amount | Shares | Amount | Capital | Shares | Amount | Deficit | Equity (Deficit) | ||||||||||||||||||||
| Balance - January 1, 2025 | — | $ | — | 1,506,369 | $ | 151 | 182,213,889 | — | — | (195,309,992 | ) | (13,095,952 | ) | |||||||||||||||
| Issuance of common stock in At the Market offering [4] | — | — | 1,127,100 | 113 | 5,663,153 | — | — | — | 5,663,266 | |||||||||||||||||||
| Induced exercise of stock warrants [5] | — | — | 197,118 | 19 | 922,731 | — | — | — | 922,750 | |||||||||||||||||||
| Reverse stock split settlement of fractional shares | — | — | (41 | ) | — | (160 | ) | — | — | — | (160 | ) | ||||||||||||||||
| Warrant modification and additional warrants-incremental value [6] | — | — | — | — | 1,194,102 | — | — | — | 1,194,102 | |||||||||||||||||||
| Warrant modification and additional warrants-in issuance costs for inducement [6] | — | — | — | — | (1,194,102 | ) | — | — | — | (1,194,102 | ) | |||||||||||||||||
| Stock-based compensation | — | — | — | — | 279,628 | — | — | — | 279,628 | |||||||||||||||||||
| Net loss | — | — | — | — | — | — | — | (3,483,533 | ) | (3,483,533 | ) | |||||||||||||||||
| Balance - March 31, 2025 | — | — | 2,830,546 | 283 | 189,079,241 | — | — | (198,793,525 | ) | (9,714,001 | ) | |||||||||||||||||
| Issuance of preferred stock and warrants in private placement [7] | 5,435,897 | 544 | — | — | 49,365,206 | — | — | — | 49,365,750 | |||||||||||||||||||
| Issuance of common stock in At the Market offering [8] | — | — | 1,323,389 | 132 | 2,559,008 | — | — | — | 2,559,140 | |||||||||||||||||||
| Issuance of common stock from exercise of warrants | — | — | 252,000 | 25 | 1,953,479 | — | — | — | 1,953,504 | |||||||||||||||||||
| Issuance of common stock from the delivery of vested restricted stock units | — | — | 44,072 | 4 | (4 | ) | — | — | — | — | ||||||||||||||||||
| Issuance of common stock from the partial conversion of note payable | — | — | 404,820 | 41 | 640,295 | — | — | — | 640,336 | |||||||||||||||||||
| Warrants issued in consideration for debt modification | — | — | — | — | 858,270 | — | — | — | 858,270 | |||||||||||||||||||
| Stock-based compensation | — | — | — | — | 483,654 | — | — | — | 483,654 | |||||||||||||||||||
| Net loss | — | — | — | — | — | — | — | (8,690,919 | ) | (8,690,919 | ) | |||||||||||||||||
| Preferred stock dividend | — | — | — | — | (97,167 | ) | — | — | — | (97,167 | ) | |||||||||||||||||
| Balance - June 30, 2025 | 5,435,897 | $ | 544 | 4,854,827 | $ | 485 | $ | 244,841,982 | — | $ | — | $ | (207,484,444 | ) | $ | 37,358,567 | ||||||||||||
| ____________________________ [1] Includes gross proceeds of [2] Includes gross proceeds of [3] Includes gross proceeds of [4] Includes gross proceeds of [5] Incremental value from the warrant inducement entered into on January 16, 2025. [6] Non-cash warrant modification and additional warrants issuance costs related to the warrant inducement are shown as a separate line item for clarity. [7] Includes gross proceeds of [8] Includes gross proceeds of | ||||||||||||||||||||||||||||
| Hyperion DeFi, Inc. Condensed Statements of Cash Flows (unaudited) | ||||||||
| For the Six Months Ended | ||||||||
| June 30, | ||||||||
| 2026 | 2025 | |||||||
| Cash Flows From Operating Activities | ||||||||
| Net income (loss) | $ | 39,791,513 | (12,174,452 | ) | ||||
| Adjustments to reconcile net income (loss) to net cash and cash equivalents used in operating activities: | ||||||||
| Stock-based compensation | 3,436,835 | 5,953,282 | ||||||
| Change in fair value of shares issued for accrued dividend | 158,544 | — | ||||||
| Amortization of debt discount | 110,921 | 585,508 | ||||||
| Non-cash lease expense | 208,954 | 151,179 | ||||||
| Recovery of credit losses | (405,331 | ) | — | |||||
| Gain on extinguishment of liabilities | — | (89,623 | ) | |||||
| Realized gain - digital assets and digital assets receivable | (21,483,269 | ) | — | |||||
| Unrealized gain - digital assets, net | (27,913,613 | ) | — | |||||
| Net gains on derivative instruments | (151,433 | ) | — | |||||
| Impairment loss - digital intangible assets | 2,000,525 | — | ||||||
| Non-cash revenue, net | (601,964 | ) | — | |||||
| Non-cash interest income from digital assets receivable | (307,278 | ) | — | |||||
| Non-cash portion of other income | 22,603 | — | ||||||
| Paid-in-kind interest expense | 169,125 | 211,520 | ||||||
| Changes in operating assets and liabilities: | ||||||||
| Refunded deposit | — | (888,000 | ) | |||||
| Prepaid expenses and other current assets | (1,747,734 | ) | (321,270 | ) | ||||
| Accounts payable | (178,786 | ) | (1,053,087 | ) | ||||
| Accrued expenses and other current liabilities | (26,729 | ) | 76,963 | |||||
| Lease liabilities | (245,365 | ) | (341,817 | ) | ||||
| Net Cash and Cash Equivalents Used In Operating Activities | (7,162,483 | ) | (7,889,797 | ) | ||||
| Cash Flows From Investing Activities | ||||||||
| Purchases of property and equipment | — | (22,959 | ) | |||||
| Purchase of digital assets | (9,036,402 | ) | (45,500,000 | ) | ||||
| Sales and dispositions of digital assets | 2,440,000 | — | ||||||
| Purchases of USDC | (2,518,820 | ) | — | |||||
| Proceeds from sales of USDC | 2,000,000 | — | ||||||
| Net Cash and Cash Equivalents Used In Investing Activities | (7,115,222 | ) | (45,522,959 | ) | ||||
| Cash Flows From Financing Activities | ||||||||
| Proceeds from sale of common stock in direct offering | 10,476,097 | — | ||||||
| Proceeds from sale of common stock in At the Market offering | 8,954,461 | 8,508,666 | ||||||
| Proceeds from sale of preferred stock and warrants in private placement | — | 50,000,000 | ||||||
| Proceeds from induced exercise of stock warrants | — | 1,039,206 | ||||||
| Proceeds from induced exercise of stock warrants | — | 1,953,504 | ||||||
| Payment of private placement issuance costs | — | (634,250 | ) | |||||
| Payment of issuance costs for direct offering | (1,148,776 | ) | — | |||||
| Payment of issuance costs for At the Market offering | (442,180 | ) | (286,260 | ) | ||||
| Repayments of notes payable | (235,559 | ) | (1,463,438 | ) | ||||
| Payment of issuance costs for debt modification | — | (177,228 | ) | |||||
| Payment of cash issuance costs for induced exercise of stock warrants | — | (116,456 | ) | |||||
| Reverse stock split settlement of fractional shares | — | (160 | ) | |||||
| Net Cash and Cash Equivalents Provided By Financing Activities | 17,604,043 | 58,823,584 | ||||||
| Net Increase in Cash and Cash Equivalents | 3,326,338 | 5,410,828 | ||||||
| Cash and Cash Equivalents - Beginning of Period | 6,310,878 | 2,121,463 | ||||||
| Cash and Cash Equivalents - End of Period | $ | 9,637,216 | $ | 7,532,291 | ||||
| Hyperion DeFi, Inc. Condensed Statements of Cash Flows, continued (unaudited) | ||||||||
| For the Six Months Ended | ||||||||
| June 30, | ||||||||
| 2026 | 2025 | |||||||
| Supplemental Disclosure of Cash Flow Information: | ||||||||
| Cash paid during the period for: | ||||||||
| Interest | $ | 179,582 | $ | — | ||||
| Supplemental Disclosure of Non-Cash Investing and Financing Activities | ||||||||
| Modification date carrying value of extinguished Avenue Loan | $ | — | $ | 10,262,280 | ||||
| Modification date fair value of modified Avenue Loan | $ | — | $ | 10,172,657 | ||||
| Exchange of digital intangible assets for digital intangible assets receivable | $ | 18,746,744 | $ | — | ||||
| Exchange of digital intangible assets receivable for digital intangible assets | $ | 19,454,154 | $ | — | ||||
| Digital assets received for digital assets receivable | $ | 22,528,501 | $ | — | ||||
| Deposits into Hyperion Rysk Vault | $ | 1,812,029 | $ | — | ||||
| Redemption from Hyperion Rysk Vault | $ | 1,854,834 | $ | — | ||||
| Warrant modification and additional warrants - incremental value | $ | — | $ | 1,194,102 | ||||
| Prepaid insurance financed by note payable | $ | 598,055 | $ | — | ||||
| Common stock issued for accrued dividends payable | $ | 1,719,187 | $ | — | ||||
| Accrued dividend payable to preferred stockholders | $ | 1,533,775 | $ | — | ||||
| Shares withheld for employee tax liabilities | $ | 379,098 | $ | — | ||||
| Treasury shares retired | $ | 253,558 | $ | — | ||||
| Deposits of digital assets into liquid staking activities | $ | 364,962 | $ | — | ||||
| Liability for digital assets received pursuant to partnership agreement | $ | 150,163 | $ | — | ||||
| Common stock issued upon conversion of preferred stock | $ | 60 | $ | — | ||||
| Issuance of common stock upon vesting of restricted stock units | $ | 36 | $ | — | ||||
| Digital assets acquired in exchange for USDC | $ | 3,549,105 | $ | — | ||||
| Digital assets disposed of in exchange for USDC | $ | 2,874,699 | $ | — | ||||
| Conversion of USDH to USDC | $ | 1,926,018 | $ | — | ||||
Hyperion DeFi Non-GAAP Measures of Financial Performance and Supplemental Disclosures
| Reconciliation of GAAP Gross Profit to Non-GAAP Adjusted Gross Profit(1) (unaudited) | ||||
| For the Three Months Ended | ||||
| (Figures in $) | Sept. 30, 2025 | Dec. 31, 2025 | March 31, 2026 | June 30, 2026 |
| Gross Profit | 302,506 | 192,987 | 244,271 | 357,693 |
| Add: Accumulated but unrealized staking yield on LSTs(10) | 58,771 | 172,463 | 154,806 | 255,275 |
| Add: Net gains on derivative instruments | 78,109 | 79,461 | 39,401 | 112,032 |
| Add: Treasury gains (losses) attributable to derivative activity | - | - | - | 351,000 |
| Add: Accumulated but unrealized yield enhancement activity(15) | - | - | 171,970 | (128,614) |
| Add: Income from airdrops | - | 285,450 | - | 18,699 |
| Add: Upfront receipt of HPL tokens pursuant to partnership agreements | - | - | 150,163 | (33,991) |
| Add: USDH sunset grant from Felix | - | - | - | 70,843 |
| Add: Interest Income from DeFi Monetization activity | - | 90,636 | 198,957 | 147,098 |
| Adjusted Gross Profit(1) | 439,386 | 820,997 | 959,568 | 1,150,035 |
Note: See “Footnotes” section for detailed explanations and definitions.
| Q2’26 Reconciliation of GAAP HYPE Digital Assets to Non-GAAP Gross HYPE Holdings(4) (unaudited) | |||
| As of June 30, 2026 | |||
| Value $ | Token Count | Token Price $ | |
| HYPE digital assets | 74,119,231 | 1,141,174 | 64.95 |
| Add: | |||
| HiHYPE at Carrying Value | 8,828,972 | 398,277 | 22.17 |
| kHYPE at Carrying Value | 15,897,330 | 455,434 | 34.91 |
| kmHYPE at Carrying Value | 597,068 | 28,888 | 20.67 |
| Unrealized accretion (dilution) expected upon LST to HYPE reconversion(11) | 33,192,611 | 18,340 | N.M.* |
| Gross HYPE Holdings(4) | 132,635,212 | ||
| Gross HYPE Tokens(2) | 2,042,113 | 64.95 | |
| Note: See “Footnotes” section for detailed explanations and definitions. | |||
| Memo: Unrealized accretion (dilution) expected upon LST to HYPE reconversion as of March 31, 2026 | 11,373,007 | ||
| Memo: In-Period Change in unrealized accretion (dilution) expected upon LST to HYPE reconversion | 21,819,604 | ||
*Throughout this release, N.M. is the abbreviation for “Not Meaningful”.
| Q1’26 Reconciliation of GAAP HYPE Digital Assets to Non-GAAP Gross HYPE Holdings(4) (unaudited) | |||
| As of March 31, 2026 | |||
| Value $ | Token Count | Token Price $ | |
| HYPE digital assets | 25,286,164 | 690,505 | 36.62 |
| Add: | |||
| HYPE digital assets receivable* | 11,071,200 | 302,327 | 36.62 |
| HYPE digital intangible assets receivable** | 9,230,486 | 250,000 | 20.66 |
| HiHYPE at Carrying Value | 7,785,852 | 378,277 | 20.58 |
| kHYPE at Carrying Value | 5,693,449 | 275,434 | 20.67 |
| kmHYPE at Carrying Value | 597,068 | 28,888 | 20.67 |
| Unrealized accretion (dilution) expected upon LST to HYPE reconversion(11) | 11,373,007 | 14,421 | N.M. |
| Gross HYPE Holdings(4) | 71,037,344 | ||
| Gross HYPE Tokens(2) | 1,939,851 | 36.62 | |
| Note: See “Footnotes” section for detailed explanations and definitions. | |||
| Memo: Unrealized accretion (dilution) expected upon LST to HYPE reconversion as of December 31, 2025 | 3,499,665 | ||
| Memo: In-Period Change in unrealized accretion (dilution) expected upon LST to HYPE reconversion | 7,873,342 | ||
*Presented gross of
**Presented gross of
| Q4’25 Reconciliation of GAAP HYPE Digital Assets to Non-GAAP Gross HYPE Holdings(4) (unaudited) | |||
| As of December 31, 2025 | |||
| Value $ | Token Count | Token Price | |
| HYPE - Digital Assets | 16,233,941 | 638,352 | 25.43 |
| Add: | |||
| HYPE digital assets receivable* | 7,647,740 | 300,725 | 25.43 |
| HiHYPE at carrying value | 8,437,277 | 398,277 | 21.18 |
| kHYPE at carrying value | 11,369,458 | 505,434 | 22.49 |
| kmHYPE at carrying value | 649,820 | 28,888 | 22.49 |
| Add: Unrealized accretion (dilution) expected upon future LST to HYPE Token reconversion(11) | 3,499,665 | 9,410 | N.M. |
| Gross HYPE Holdings(4) | 47,837,901 | ||
| Gross HYPE Tokens(2) | 1,881,086 | 25.43 | |
Note: See “Footnotes” section for detailed explanations and definitions. | |||
| Unrealized accretion (dilution) expected upon LST to HYPE reconversion as of Q3’25 | 4,912,082 | ||
| In-Period Change in unrealized accretion (dilution) expected upon LST to HYPE vs. Q3’25 | (1,412,417) | ||
*Presented gross of
| Q3’25 Reconciliation of GAAP HYPE Digital Assets to Non-GAAP Gross HYPE Holdings(4) (unaudited) | |||
| | As of September 30, 2025 | ||
| Value $ | Token Count | Token Price | |
| HYPE digital assets | 37,954,590 | 839,889 | 45.19 |
| Add: HiHYPE at Carrying Value | 34,884,932 | 877,871 | 39.74 |
| Add: Unrealized accretion (dilution) expected upon future LST to HYPE Token reconversion(11) | 4,912,082 | 2,788 | N.M. |
| Gross HYPE Holdings(4) | 77,751,604 | ||
| Gross HYPE Tokens(2) | 1,720,549 | 45.19 | |
| Note: See “Footnotes” section for detailed explanations and definitions. | |||
| Unrealized accretion (dilution) expected upon LST to HYPE reconversion as of June 30, 2025* | 4,912,082 | ||
*The Company did not hold any LSTs on or prior to June 30, 2025. Therefore, as of September 30, 2025, the in-period change in unrealized accretion (dilution) expected upon LST to HYPE Token Reconversion is the same as the absolute figure.
| Reconciliation of GAAP Selling, General and Administrative expense to Non-GAAP Operating Expense Excluding Stock-Based Compensation(5) (unaudited) | ||||
| (Figures in $) | Sept. 30, 2025 | Dec. 31, 2025 | March 31, 2026 | June 30, 2026 |
| Selling, general and administrative expense | 2,594,130 | 4,530,542 | 4,493,604 | 3,918,591 |
| Subtract: stock-based compensation expense | 1,347,031 | (1,712,361) | (1,804,485) | (1,632,349) |
| Add: research and development expense | 373,855 | 188,954 | 286,764 | 58,492 |
| Operating Expense Excluding Stock-Based Compensation(5) | 4,315,016 | 3,007,135 | 2,975,883 | 2,344,734 |
Note: See “Footnotes” section for detailed explanations and definitions.
Supplemental Disclosure of Disaggregated Stock-Based Compensation (unaudited)
| For the Three Months Ended | |||||||
| (Figures in $) | Sept. 30, 2025 | Dec. 31, 2025 | March 31, 2026 | June 30, 2026 | |||
| Mark-to-Market Adjustment of Vested but Undelivered Awards | (2,140,000) | ||||||
| Amortization of Unearned Executive Milestone Awards | 209,648 | 997,563 | 997,563 | 997,563 | |||
| All Remaining Stock-Based Compensation | 583,321 | 714,798 | 806,922 | 634,786 | |||
| Total Stock-Based Compensation | (1,347,031) | 1,712,361 | 1,804,485 | 1,632,349 | |||
| Reconciliation of GAAP Net Operating Income (Expenses) to Non-GAAP Treasury Gains (Losses)(6) (unaudited) | |||||
| For the Three Months Ended | |||||
| (Figures in $) | Sept. 30, 2025 | Dec. 31, 2025 | March 31, 2026 | June 30, 2026 | |
| Net Operating Income (Expenses) | 4,125,685 | (39,958,264) | 8,487,848 | 30,650,049 | |
| Add Back: | |||||
| Research and development expense | 373,855 | 188,954 | 286,764 | 58,492 | |
| Selling, general and administrative expense | 2,594,130 | 4,530,542 | 4,493,604 | 3,918,573 | |
| Impairment of right of use assets | - | - | - | 57,773 | |
| Provision for credit losses | - | 405,331 | 504,511 | (909,842) | |
| In-Period Change in unrealized accretion (dilution) expected upon LST to HYPE reconversion | 4,912,082 | (1,412,417) | 7,873,342 | 21,819,604 | |
| Subtract: | |||||
| Accumulated but unrealized staking yield on LSTs(10) | (58,771) | (172,463) | (154,806) | (255,275) | |
| Income from airdrops | - | (285,450) | - | (18,699) | |
| Realized gains / losses from Rysk Vault shares redemption | - | - | - | (42,035) | |
| Net gains on derivative instruments | (78,109) | (79,461) | (39,401) | (112,032) | |
| Treasury losses (gains) attributable to derivative activity | - | - | - | (351,000) | |
| Treasury Gains (Losses)(6) | 11,868,872 | (36,783,228) | 21,451,862 | 54,815,626 | |
Note: See “Footnotes” section for detailed explanations and definitions.
Reconciliation of GAAP Total Other Income (Expense), Net to Non-GAAP Adjusted Other Income (Expense)(7) (unaudited)
| For the Three Months Ended | ||||
| (Figures in $) | Sept. 30, 2025 | Dec. 31, 2025 | March 31, 2026 | June 30, 2026 |
| Total Other Income (Expense), Net | 2,197,391 | (288) | 108,431 | (56,779) |
| Add back: | ||||
| Interest expense | 223,080 | 224,799 | 225,869 | 233,760 |
| Reduction in life sciences liabilities(12) | (2,407,154) | - | (225,173) | - |
| Other non-recurring items(13) | (55,557) | (85,158) | 142,415 | 2,037 |
| Subtract: Interest Income from DeFi Monetization activities | - | (90,636) | (198,957) | (147,098) |
| Adjusted Other Income (Expense)(7) | (42,240) | 48,717 | 52,585 | 31,919 |
Note: See “Footnotes” section for detailed explanations and definitions.
| Reconciliation of GAAP Net Income to Non-GAAP Adjusted EBITDA(8) (unaudited) | ||||
| For the Three Months Ended | ||||
| (Figures in $) | Sept. 30, 2025 | Dec. 31, 2025 | March 31, 2026 | June 30, 2026 |
| Net Income (Loss) | 6,625,582 | (39,765,565) | 8,840,550 | 30,950,983 |
| Add back: | ||||
| Stock-based compensation | (1,347,031) | 1,712,361 | 1,804,485 | 1,632,349 |
| Interest expense | 223,080 | 224,799 | 225,869 | 233,760 |
| Provision for credit losses | - | 405,331 | 504,511 | (909,842) |
| Income Taxes | - | - | - | - |
| Depreciation and amortization expense | - | - | - | - |
| Impairment of right of use assets | - | - | - | 57,773 |
| Reduction in life sciences liabilities(12) | (2,407,154) | - | (225,173) | - |
| Other non-recurring items(13) | (55,557) | (85,158) | 142,415 | 2,037 |
| Add: | ||||
| In-Period Change in unrealized accretion (dilution) expected upon LST to HYPE reconversion | 4,912,082 | (1,412,417) | 7,873,342 | 21,819,604 |
| Accumulated but unrealized yield enhancement activity(15) | - | - | 171,970 | (128,614) |
| Realized losses (gains) from Rysk Vault shares redemption | - | - | - | (42,035) |
| Upfront receipt of HPL tokens pursuant to partnership agreements | - | - | 150,163 | (33,991) |
| USDH sunset grant from Felix | - | - | - | 70,843 |
| Adjusted EBITDA(8) | 7,951,003 | (38,920,649) | 19,488,132 | 53,652,846 |
Note: See “Footnotes” section for detailed explanations and definitions.
*Does not include Amortization of Operating Lease.
| Reconciliation of GAAP HYPE digital assets, as adjusted to Gross HYPE Holdings(4), to Non-GAAP Net Asset Value(9) (unaudited) | ||||
| (Figures in $) | Sept. 30, 2025 | Dec. 31, 2025 | March 31, 2026 | June 30, 2026 |
| Gross HYPE Holdings(4) | 77,751,604 | 47,837,901 | 71,037,227 | 132,635,212 |
| Add: KNTQ & sKNTQ at Carrying Value | - | 111,406 | 193,780 | 172,196 |
| Add: HPL & sHPL at Carrying Value | - | - | 149,820 | 91,000 |
| Add: Hyperion Rysk Vault Shares at Cost Basis* | - | - | 1,615,075 | - |
| Add: Current Assets | 9,085,767 | 7,245,809 | 8,803,947 | 12,908,877 |
| Subtract: Current Liabilities** | (4,037,092) | (2,701,013) | (4,509,992) | (5,601,237) |
| Subtract: Notes Payable*** | (8,254,696) | (8,339,366) | (7,416,353) | (5,979,570) |
| Net Asset Value(9) | 74,545,583 | 44,154,737 | 69,873,504 | 134,226,478 |
Note: See “Footnotes” section for detailed explanations and definitions.
*Digital intangible assets representing claims on USDH/USDC held in the Hyperion Rysk Institutional Volatility Income Vault.
**Includes Notes payable - current portion as of March 31, 2026 and June 30, 2026; does not subtract debt discount of
***Non-current portion; does not subtract debt discount of
Reconciliation of GAAP Net Cash and Cash Equivalents Used in Investing Activities to Adjusted Net Investing Cash Flow(17) (unaudited)
| For the Three Months Ended | ||||
| (Figures in $) | Sept. 30, 2025 | Dec. 31, 2025 | March 31, 2026 | June 30, 2026 |
| Net Cash and Cash Equivalents Used in Investing Activities | (20,112,041) | (6,319,039) | (1,472,835) | (5,642,387) |
| Add: Net Impact of Non-Cash Digital Asset Acquisitions and Dispositions* | - | - | - | (523,285) |
| Adjusted Net Investing Cash Flow(17) | (20,112,041) | (6,319,039) | (1,472,835) | (6,165,672) |
*Reflects the net investing cash flow impact of digital asset acquisitions and dispositions of and by non-cash current assets, including USDC and USDH stablecoins.
Note: See “Footnotes” section for detailed explanations and definitions.
Reconciliation of GAAP Net Cash and Cash Equivalents Used in Operating Activities to Adjusted Net Operating Cash Flow(18) (unaudited)
| For the Three Months Ended | ||||
| (Figures in $) | Sept. 30, 2025 | Dec. 31, 2025 | March 31, 2026 | June 30, 2026 |
| Net Cash and Cash Equivalents Used in Operating Activities | (2,822,819) | (4,190,147) | (4,064,063) | (3,098,419) |
| Subtract: Net Impact of Non-Cash Digital Asset Acquisitions and Dispositions* | - | - | - | 523,285 |
| Add: Change in Non-GAAP Cash Equivalents** | - | 214,012 | 1,456,719 | 450,752 |
| Adjusted Net Operating Cash Flow(18) | (2,822,819) | (3,976,135) | (2,607,344) | (2,124,382) |
*Reflects the net investing cash flow impact of digital asset acquisitions and dispositions of and by non-cash current assets, including USDC and USDH stablecoins.
**Reflects quarterly variance in assets the Company considers to be economically equivalent, but not functionally equivalent, to cash (driven by a limited ability to redeem into US Dollars one-for-one), but not reflected in quarterly GAAP “cash and cash equivalents”, including from time-to-time USDC and USDH Stablecoin as well as deposits and redemptions from the Hyperion Rysk Vault.
Note: See “Footnotes” section for detailed explanations and definitions.
Footnotes
- “Adjusted Gross Profit” is a non-GAAP measure. Adjusted Gross Profit is defined as all in-period gross profit generated by the Company’s operations excluding gains and losses on its digital asset treasury. Such operating activities include staking yield, validator operations, yield enhancement activity, DeFi monetization partnerships, ecosystem rewards, and (prior to 2026) life sciences operations. It is reconciled to the GAAP measure “Gross Profit” by adding (i) accumulated but unrealized staking yield on LSTs, (ii) Net gains on derivative instruments, (iii) the portion of treasury gains (losses) attributable to derivative activity, (iv) accumulated but unrealized yield enhancement activity as further described in Footnote 15, (v) income from airdrops, (vi) the impact of upfront receipt and recognition of Company’s HPL tokens pursuant to its partnership agreements with HyperLend, (vii) the impact of a one-time grant from the Felix Foundation (“Felix”) in connection with the USDH stablecoin sunset (committed in June 2026 and received in July 2026), and (viii) the portion of GAAP “Interest Income” generated from digital assets receivable. We believe “Adjusted Gross Profit” is a helpful financial measure to our management and investors as it aims to capture all in-period gross profit generated by our active operational strategies without the impact of (i) the temporary GAAP earnings volatility of HYPE to LST conversion and LST to HYPE reconversion, (ii) the temporary GAAP earnings volatility of depositing and redeeming USDH/USDC versus Hyperion Rysk Vault Shares and delays in recognition of upfront received premium on expired sold put and call options on the price of HYPE, (iii) the over-time GAAP recognition of the Company’s receipt of HPL tokens, (iv) the timing delay between commitment and receipt of a grant from Felix, (v) dispersed GAAP presentment of our operational strategies across various Statements of Operations sections, or (iv) the impacts of gains and losses on our digital asset treasury. We believe Adjusted Gross Profit is a critical metric to quantify and compare our core operational activities between periods. In the Company’s earnings release and earnings supplement for three months ended September 30, 2025 and December 31, 2025, we previously reconciled Non-GAAP “Adjusted Gross Profit” to GAAP “Revenue”. Given changes in GAAP presentment related to staking and validating activities, we believe for the three months ended March 31 and June 30, 2026, the closest comparable GAAP metric to Adjusted Gross Profit is Gross Profit.
- The following are unaudited supplemental operating disclosures: Gross HYPE Tokens, the number of HYPE tokens staked at the Kinetiq x Hyperion Validator, Validator Commissions in HYPE, Staking Yield in HYPE (which includes accrued staking rewards on LSTs), and HYPE Earned in Staking & Validating (which includes accrued staking rewards on LSTs).
- Calculated as the sum of the in-period Non-GAAP Adjusted Gross Profit components of (a) Validator Commissions plus (b) Staking Yield (such figures being expressed in-period in US Dollars), divided by the sum of (a) Validator Commissions in HYPE plus (b) Staking Yield in HYPE.
- “Gross HYPE Holdings” is a non-GAAP measure. Gross HYPE Holdings is defined as the gross market value of the Company’s HYPE assuming (a) all temporary HYPE token use agreements are exited, (b) all collateralized OTC HYPE derivatives are exited (and such LST collateral returned to the Company), and (c) all LSTs are converted back to HYPE tokens as of the end of each respective reporting quarter. It is reconciled to the GAAP measure “HYPE digital assets” by adding (i) HYPE digital assets receivable (without subtracting allowance for credit loss or unamortized nonrefundable upfront fees), (ii) HYPE digital intangible assets receivable (without subtracting allowance for credit loss), (iii) HYPE LSTs at carrying value (including without limitation HiHYPE, kHYPE, and kmHYPE) and (iv) the unrealized accretion (dilution) expected upon LST to HYPE reconversion as of the end of each respective reporting quarter. We believe Gross HYPE Holdings is a helpful non-GAAP financial measure to our management and investors because it eliminates the temporary HYPE value impacts caused by our DeFi Monetization and Yield Enhancement token movements as well as the conversion and reconversion between HYPE tokens and LSTs, which (a) causes staking yield on our LSTs not to be recognized in-period in accordance with GAAP and (b) does not recognize upward mark-to-market movements in underlying HYPE tokens given LSTs are carried at the lower of cost basis or impaired value. As such, it provides useful information about our balance sheet, allows for greater transparency with respect to important metrics used by our management for financial, risk management and operational decision-making, and provides an additional tool for investors to understand and compare our operating results across reporting periods.
- "Operating Expenses Excluding Stock-Based Compensation" is a non-GAAP measure. Operating Expenses Excluding Stock-Based Compensation is defined as the Company's operational expenses in-period excluding treasury value movements, stock-based compensation, and impairment of right of use assets. It is reconciled to the GAAP measure “Selling, general and administrative expense” by (i) subtracting stock-based compensation expense and (ii) adding Research and development expense. Operating Expenses Excluding Stock-Based Compensation provides a metric of total operating expenditures in-period without the impact of treasury value movements, stock-based compensation, or impairment of right of use assets, thereby creating a helpful metric for operational expense comparisons between different periods for our management and investors.
- "Treasury Gains (Losses)" is a non-GAAP measure. Treasury Gains (Losses) is defined as the gross value change in the company's digital asset treasury portfolio each period, without accounting for temporary GAAP impacts due to HYPE to LST conversion (or LST to HYPE reconversion) or income driven by airdrops or yield enhancement activity. It is reconciled to the GAAP measure “Net Operating Income (Expenses)" by (a) adding (i) research and development expense, (ii) selling, general, and administrative expense, (iii) impairment of right of use assets, (iv) provision for credit losses, and (v) the in-period change in unrealized accretion (dilution) expected upon LST to HYPE reconversion, and (b) subtracting (i) accumulated but unrealized staking yield on LSTs, (ii) income from airdrops, (iii) realized gains and losses from Rysk Vault shares redemption, (iv) net gains on derivative instruments, and (v) treasury value changes attributable to derivative activity (which are already captured in the Non-GAAP metric “Adjusted Gross Profit”). Following these adjustments, Treasury Gains (Losses) is a singular metric that can present treasury value changes in isolation, which we believe is a helpful metric for management and investors given our large digital asset treasury position and the volatile nature of our digital assets.
- "Adjusted Other Income (Expense)" is a non-GAAP measure. Adjusted Other Income (Expense) reflects management’s view of recurring activities outside of core operating income and operating expenses. It is reconciled to the GAAP measure "Total Other Income (Expense), Net" by (a) adding back (i) interest expense, (ii) non-recurring gains from reductions in life sciences liabilities, and (iii) other non-recurring items which we do not consider material in nature, and (b) subtracting the portion of GAAP “Interest Income” generated from digital assets receivable. The items added back to Adjusted Other Income (Expense) are excluded because they are non-cash in nature, or because the amount and timing of these items are unpredictable, are not driven by core results of operations, and render comparisons with prior periods and competitors less meaningful. The item subtracted from Adjusted Other Income (Expense) is already captured in the Non-GAAP metric “Adjusted Gross Profit”, as further described in Footnote 1. We believe Adjusted Other Income (Expense) provides a helpful view to management and investors regarding recurring and ongoing income and expense items outside of core operating income and expenses, presented in a way to compare these elements over time.
- “Adjusted EBITDA” is a non-GAAP measure. Adjusted EBITDA is meant to reflect management’s view of recurring business activities and a more comparable view of the mark-to-market impacts on our digital asset treasury holdings in-period. It is reconciled to the GAAP measure “Net Income (Loss)” by removing (i) stock-based compensation, (ii) interest expense, (iii) provision for credit losses, (iv) income taxes, (v) depreciation and amortization expense (excluding amortization of operating lease), (vi) impairment of right of use assets, (vii) non-recurring gains from reductions in life sciences liabilities, and (viii) other non-recurring items which we do not consider material in nature; and, it adds in (i) the in-period change in unrealized accretion (dilution) expected upon LST to HYPE reconversion, (ii) accumulated but unrealized yield enhancement activity as further described in Footnote 15, (iii) realized gains and losses from Rysk Vault shares redemption, (iv) the impact of upfront receipt and recognition of Company’s HPL tokens pursuant to its partnership agreements with HyperLend, and (v) the impact of a one-time grant from Felix in connection with the USDH stablecoin sunset (committed in June 2026 and received in July 2026). The items excluded from our Adjusted EBITDA are excluded because they are non-cash in nature, or because the amount and timing of these items are unpredictable, are not driven by core results of operations, and render comparisons with prior periods and competitors less meaningful. The items added to Adjusted EBITDA are included to give a more complete picture of our in-period operations and mark-to-market impacts on our digital assets, disregarding (i) the temporary GAAP earnings volatility of HYPE to LST conversion and LST to HYPE reconversion, (ii) the temporary GAAP earnings volatility of depositing and redeeming USDH/USDC versus Hyperion Rysk Vault Shares and delays in recognition of upfront received premium on expired sold HYPE put and call options, (iii) the over-time GAAP recognition of the Company’s receipt of HPL tokens, and (iv) the timing delay between commitment and receipt of a grant from Felix. Adjusted EBITDA is used by management, in addition to GAAP financial measures, to understand and compare our operating results across accounting periods, for risk management and operational decision-making purposes. This non-GAAP measure provides investors with additional information in evaluating the Company's operating performance.
- “Net Asset Value” is a non-GAAP measure. Net Asset Value is defined as the estimated market value of our digital assets less net outstanding debt. It is reconciled to the GAAP measure “HYPE digital assets” as adjusted to “Gross HYPE Holdings” (described more fully in Footnote 4) by (i) adding KNTQ digital assets and sKNTQ digital intangible assets at carrying value, (ii) adding HPL digital assets and sHPL digital intangible assets at carrying value, (iii) adding Hyperion Rysk Vault Shares at cost basis, (iv) adding Current Assets, (v) subtracting Current Liabilities (including current portion of Notes Payable, without subtracting corresponding debt discounts or any unamortized issuance expenses), and (vi) subtracting Notes Payable (Non-current portion, without subtracting corresponding debt discounts or any unamortized issuance expenses). We believe Net Asset Value is a helpful non-GAAP financial measure to our management and investors because it provides a more complete picture of our net assets. It does not include other non-current assets or non-current liabilities beyond the aforementioned items. The Company believes Net Asset Value provides useful information about our balance sheet and financial performance, enhances the overall understanding of our past performance and future prospects, allows for greater transparency with respect to important metrics used by our management for financial, risk management and operational decision-making, and provides an additional tool for investors to use to understand and compare our operating results across accounting periods.
- Represents in-period accrued staking yield on HYPE LSTs. Staking yield on LSTs is not recognized in-period in accordance with GAAP; instead, LST staking yield may be recognized as a realized gain upon future reconversion from LSTs back into HYPE.
- Represents the estimated future financial implications if all company-owned LSTs were reconverted to HYPE at the end of each respective period. Encapsulates both the temporary GAAP valuation methodology differences between LSTs and HYPE plus the realization of previously accrued but unrecognized staking yield on LSTs.
- In the three months ended September 30, 2025, Gain on extinguishment of liability and a reduction in accrued liability within other income was approximately
$2.2 million and$0.2 million respectively, combined totaling$2.4 million . In the three months ended March 31, 2026, gain on extinguishment of liabilities within Other income (expense), net totaled$0.2 million . - In the reconciliation of “Total Other Income (Expense), Net” to “Adjusted Other Income (Expense)”, as well as in the reconciliation of “Net Income (Loss)” to “Adjusted EBITDA”, other non-recurring items include (a) gains and losses on sales and disposals of life sciences equipment and furniture, (b) release of reserves held against potential returns of company-sold items, (c) a one-time realized payment in connection with a terminated LOI, and (d) gains and losses due to valuation differences in the time between contractual and actual delivery dates on certain company-paid expenses denominated in HYPE and in Company equity.
- Estimated and unaudited figures as of June 30, 2026.
- Includes all net cash, cash equivalents, and USDC/USDH premiums received but unrealized on expired sold HYPE puts and calls, including within the Hyperion Rysk Vault, as well as third-party fees on yield enhancement activities (such third-party fees being included in DeFi Monetization within Non-GAAP Adjusted Gross Profit).
- Includes assets the Company considers to be economically equivalent, but not functionally equivalent, to cash, such as USDC and USDH Stablecoin as well as deposits and redemptions from the Hyperion Rysk Vault.
- “Adjusted Net Investing Cash Flow” is a non-GAAP measure. Adjusted Net Investing Cash Flow is defined as the estimated total net cash (including non-GAAP cash equivalents) generated from / (used for) acquisitions and dispositions of assets for investing purposes. It is reconciled to the GAAP measure “Net Cash and Cash Equivalents Used in Investing Activities” by adding the net impact of non-cash digital asset acquisitions and dispositions. We believe Adjusted Net Investing Cash Flow is a helpful non-GAAP financial measure to our management and investors because it removes the in-period cash flow volatility which can be caused by purchases and sales of and by non-cash current assets, including USDC and USDH stablecoins. The Company believes Net Asset Value provides useful information about our financial performance and cash flows with greater transparency for investors to understand and compare our operating results across accounting periods.
- “Adjusted Net Operating Cash Flow” is a non-GAAP measure. Adjusted Net Operating Cash Flow is defined as the estimated total net cash (including non-GAAP cash equivalents) generated from / (used for) the Company’s operating activities. It is reconciled to the GAAP measure “Net Cash and Cash Equivalents Used in Operating Activities” by (a) subtracting the net impact of non-cash digital asset acquisitions and dispositions and (b) adding quarterly variance in assets the Company considers to be economically equivalent, but not functionally equivalent, to cash (including from time-to-time USDC and USDH Stablecoin as well as deposits and redemptions from the Hyperion Rysk Vault). We believe Adjusted Net Operating Cash Flow is a helpful non-GAAP financial measure to our management and investors because it removes the in-period operating cash flow volatility which can be caused by the inflows and outflows of non-GAAP cash equivalents.
Photos accompanying this announcement are available at:
https://www.globenewswire.com/NewsRoom/AttachmentNg/5b5e1dda-874d-486e-b1e8-729cbb36cb55
https://www.globenewswire.com/NewsRoom/AttachmentNg/3249f18e-d72c-4b1c-86ba-0453018b2c3d

FAQ
AI-generated questions and answers. How Rhea-AI works. Not financial advice.