Jiayin Group Inc. Reports First Quarter 2025 Unaudited Financial Results
Rhea-AI Summary
Positive
- Net income increased 97.5% YoY to RMB539.5 million ($74.3M)
- Loan facilitation volume grew 58.2% YoY to RMB35.6 billion
- Income from operations rose 91.7% YoY to RMB606.6 million
- Low delinquency ratio of 1.13% indicates strong credit quality
- Board approved cash dividend of $0.80 per ADS
- Share repurchase program extended for 12 months with $13.2M remaining
Negative
- Average borrowing amount per borrowing decreased 24.4% YoY
- Repeat borrower contribution declined from 78.3% to 71.9% YoY
- Cash and cash equivalents decreased to RMB190.3M from RMB540.5M in December 2024
- Sales and marketing expenses increased significantly by 87.5% YoY
News Market Reaction – JFIN
In the trading session that priced this news, JFIN gained 8.29%, reflecting a notable positive market reaction.
Data tracked by StockTitan Argus on the day of publication.
AI-generated analysis. How Rhea-AI works. Not financial advice.
-- First Quarter Total Loan Facilitation Volume Grew
-- First Quarter Net Revenue Grew
SHANGHAI, China, June 04, 2025 (GLOBE NEWSWIRE) -- Jiayin Group Inc. (“Jiayin” or the “Company”) (NASDAQ: JFIN), a leading fintech platform in China, today announced its unaudited financial results for the first quarter ended March 31, 2025.
First Quarter 2025 Operational and Financial Highlights:
- Loan facilitation volume1 was RMB35.6 billion (US
$4.9 billion ), representing an increase of58.2% from the same period of 2024. - Average borrowing amount per borrowing was RMB7,987 (US
$1,101) , representing a decrease of24.4% from the same period of 2024. - Repeat borrower contribution2 of total loan facilitation volume was
71.9% , compared with78.3% in the same period of 2024. - 90 day+ delinquency ratio3 was
1.13% as of March 31, 2025. - Net revenue was RMB1,775.6 million (US
$244.7 million ), representing an increase of20.4% from the same period of 2024. - Income from operations was RMB606.6 million (US
$83.6 million ), representing an increase of91.7% from the same period of 2024. - Non-GAAP4 income from operation was RMB606.6 million (US
$83.6 million ), compared with RMB316.6 million in the same period of 2024. - Net income was RMB539.5 million (US
$74.3 million ), representing an increase of97.5% from RMB273.1 million in the same period of 2024.
____________________
1 “Loan facilitation volume” refers to the loan volume facilitated in Mainland China during the period presented.
2 “Repeat borrower contribution” for a given period refers to the percentage of loan facilitation volume in Mainland China attributable to repeat borrowers during that period.
“Repeat borrowers” during a certain period refers to borrowers who have borrowed in such period and have borrowed at least twice since such borrowers’ registration on our platform until the end of such period.
3 “90 day+ delinquency ratio” refers to the outstanding principal balance of loans that were 91 to 180 calendar days past due as a percentage of the total outstanding principal balance of loans facilitated through the Company’s platform as of a specific date. Loans facilitated outside Mainland China are not included in the calculation.
4 Please see the section entitled “Use of Non-GAAP Financial Measure” below and the table captioned “Unaudited Reconciliations of GAAP and Non-GAAP Results” set forth at the end of this press release.
Mr. Yan Dinggui, the Company’s Founder, Director and Chief Executive Officer, commented: “We sustained our strong growth momentum in the first quarter of 2025 and delivered solid financial results in line with our expectations as we navigated through a dynamic macroeconomic environment. In the first quarter, loan facilitation volume amounted to RMB35.6 billion, representing a year-over-year increase of
We continued to accelerate our high-quality growth strategy by focusing on our loan facilitation business, expanding institutional partnerships, and improving credit performance. These initiatives position us well for long-term growth. At the same time, we advanced the application of AI-driven tools across our core business and continue to work on expanding technological capabilities that drive essential value. Looking ahead, we remain committed to our strategic path forward and are confident in our ability to sustain improvements and growth throughout 2025.”
First Quarter 2025 Financial Results
Net revenue was RMB1,775.6 million (US
Revenue from loan facilitation services was RMB1,478.6 million (US
Revenue from releasing of guarantee liabilities was RMB170.6 million (US
Other revenue was RMB126.4 million (US
Facilitation and servicing expense was RMB336.0 million (US
Allowance for uncollectible assets, loans receivable and others was RMB17.5 million (US
Sales and marketing expense was RMB674.5 million (US
General and administrative expense was RMB52.8 million (US
Research and development expense was RMB88.1 million (US
Income from operations was RMB606.6 million (US
Non-GAAP income from operation was RMB606.6 million (US
Net income was RMB539.5 million (US
Basic and diluted net income per share was RMB2.53 (US
Basic and diluted net income per ADS was RMB10.12 (US
Cash and cash equivalents were RMB190.3 million (US
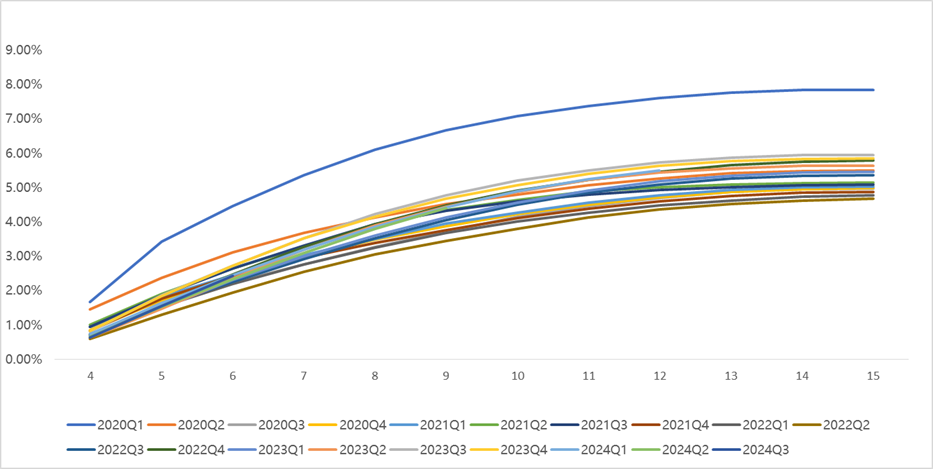
The following chart and table display the historical cumulative M3+ Delinquency Rate by Vintage for loan products facilitated through the Company’s platform in Mainland China.
Business Outlook
The Company expects its loan facilitation volume for the full year of 2025 to be in the range of RMB137 billion to RMB142 billion and its loan facilitation volume for the second quarter of 2025 to be in the range of RMB37 billion to RMB39 billion. The Company expects its non-GAAP income from operation for the second quarter of 2025 to be in the range of RMB0.66 billion to RMB0.73 billion. This forecast reflects the Company’s current and preliminary views on the market and operational conditions, which are subject to change.
Recent Development
Dividend Policy
On May 20, 2025, the Board of Directors of the Company (the “Board”) approved the declaration and payment of cash dividends of US
Share Repurchase Plan Update
On June 4, 2025, the Board approved to extend the share repurchase plan for another period of 12 months, commencing on June 13, 2025 and ending on June 12, 2026. Pursuant to the extended share repurchase plan, the Company may repurchase its ordinary shares through June 12, 2026 with an aggregate value not exceeding the remaining balance under the share repurchase plan. As of June 4, 2025, the Company had repurchased approximately 3.8 million of its American depositary shares for approximately US
Conference Call
The Company will conduct a conference call to discuss its financial results on Wednesday, June 4, 2025 at 8:00 AM U.S. Eastern Time (8:00 PM Beijing/Hong Kong Time on the same day).
To join the conference call, all participants must use the following link to complete the online registration process in advance. Upon registering, each participant will receive access details for this event including the dial-in numbers, a PIN number, and an e-mail with detailed instructions to join the conference call.
Participant Online Registration:
https://register-conf.media-server.com/register/BI03ab51eb90b746e69997275b560e8c7f
A live and archived webcast of the conference call will be available on the Company’s investors relations website at http://ir.jiayintech.cn/.
About Jiayin Group Inc.
Jiayin Group Inc. is a leading fintech platform in China committed to facilitating effective, transparent, secure and fast connections between underserved individual borrowers and financial institutions. The origin of the business of the Company can be traced back to 2011. The Company operates a highly secure and open platform with a comprehensive risk management system and a proprietary and effective risk assessment model which employs advanced big data analytics and sophisticated algorithms to accurately assess the risk profiles of potential borrowers. For more information, please visit https://ir.jiayintech.cn/.
Use of Non-GAAP Financial Measure
We use non-GAAP income from operation, which is a non-GAAP financial measure, in evaluating our operating results and for financial and operational decision-making purposes. We believe that the non-GAAP financial measure helps identify underlying trends in our business by excluding the impact of share-based compensation expenses. We believe that non-GAAP financial measure provides useful information about our operating results, enhances the overall understanding of our past performance and future prospects and allows for greater visibility with respect to key metrics used by our management in its financial and operational decision-making.
Non-GAAP income from operation represents income from operation excluding share-based compensation expenses. Such adjustment has no impact on income tax.
Non-GAAP income from operation is not defined under U.S. GAAP and is not presented in accordance with U.S. GAAP. The non-GAAP financial measure has limitations as analytical tool, and when assessing our operating performance, cash flows or our liquidity, investors should not consider it in isolation, or as a substitute for income from operation, net income, cash flows provided by operating activities or other consolidated statements of operation and cash flow data prepared in accordance with U.S. GAAP. The Company encourages investors and others to review our financial information in its entirety and not rely on a single financial measure.
For more information on this non-GAAP financial measure, please see the table captioned “Unaudited Reconciliations of GAAP and Non-GAAP results” set forth at the end of this press release.
Exchange Rate Information
This announcement contains translations of certain RMB amounts into U.S. dollars (“US$”) at a specified rates solely for the convenience of the reader. Unless otherwise noted, all translations from RMB to U.S. dollars are made at a rate of RMB7.2567 to US
Safe Harbor / Forward-Looking Statements
This announcement contains forward-looking statements. These statements are made under the “safe harbor” provisions of the United States Private Securities Litigation Reform Act of 1995. These forward-looking statements can be identified by terminology such as “will,” “expects,” “anticipates,” “future,” “intends,” “plans,” “believes,” “estimates” and similar statements. The Company may also make written or oral forward-looking statements in its periodic reports to the SEC, in its annual report to shareholders, in press releases and other written materials and in oral statements made by its officers, directors or employees to third parties. Statements that are not historical facts, including statements about the Company’s beliefs and expectations, are forward-looking statements. Forward-looking statements involve inherent risks and uncertainties and are based on current expectations, assumptions, estimates and projections about the Company and the industry. Potential risks and uncertainties include, but are not limited to, those relating to the Company’s ability to retain existing investors and borrowers and attract new investors and borrowers in an effective and cost-efficient way, the Company’s ability to increase the investment volume and loan facilitation of loans volume facilitated through its marketplace, effectiveness of the Company’s credit assessment model and risk management system, PRC laws and regulations relating to the online individual finance industry in China, and general economic conditions in China. All information provided in this press release is as of the date hereof, and the Company undertakes no obligation to update any forward-looking statements to reflect subsequent occurring events or circumstances, or changes in its expectations, except as may be required by law. Although the Company believes that the expectations expressed in these forward-looking statements are reasonable, it cannot assure you that its expectations will turn out to be correct, and investors are cautioned that actual results may differ materially from the anticipated results. Further information regarding risks and uncertainties faced by the Company is included in the Company’s filings with the U.S. Securities and Exchange Commission, including its annual report on Form 20-F.
For investor and media inquiries, please contact:
Jiayin Group
Ms. Emily Lu
Email: ir@jiayinfintech.cn
| JIAYIN GROUP INC. UNAUDITED CONDENSED CONSOLIDATED BALANCE SHEETS (Amounts in thousands, except for share and per share data) | |||||||||||
| As of December 31, | As of March 31, | ||||||||||
| 2024 | 2025 | ||||||||||
| RMB | RMB | US$ | |||||||||
| ASSETS | |||||||||||
| Cash and cash equivalents | 540,523 | 190,251 | 26,217 | ||||||||
| Restricted cash | 137,332 | 158,289 | 21,813 | ||||||||
| Accounts receivable and contract assets, net | 2,991,166 | 3,511,218 | 483,859 | ||||||||
| Financial assets receivables, net | 293,483 | 274,627 | 37,845 | ||||||||
| Prepaid expenses and other current assets, net | 377,978 | 510,938 | 70,409 | ||||||||
| Deferred tax assets, net | 72,405 | 90,951 | 12,533 | ||||||||
| Property and equipment, net | 44,397 | 1,366,869 | 188,360 | ||||||||
| Right-of-use assets | 52,759 | 47,068 | 6,486 | ||||||||
| Long-term investments | 162,267 | 222,838 | 30,708 | ||||||||
| Other non-current assets | 737,583 | 21,053 | 2,901 | ||||||||
| TOTAL ASSETS | 5,409,893 | 6,394,102 | 881,131 | ||||||||
| LIABILITIES AND EQUITY | |||||||||||
| Deferred guarantee income | 229,503 | 204,507 | 28,182 | ||||||||
| Contingent guarantee liabilities | 213,644 | 246,512 | 33,970 | ||||||||
| Payroll and welfare payable | 144,065 | 72,321 | 9,966 | ||||||||
| Tax payables | 687,034 | 842,215 | 116,060 | ||||||||
| Accrued expenses and other liabilities | 956,356 | 1,315,100 | 181,226 | ||||||||
| Lease liabilities | 51,677 | 47,134 | 6,495 | ||||||||
| TOTAL LIABILITIES | 2,282,279 | 2,727,789 | 375,899 | ||||||||
| TOTAL SHAREHOLDERS' EQUITY | 3,127,614 | 3,666,313 | 505,232 | ||||||||
| TOTAL LIABILITIES AND EQUITY | 5,409,893 | 6,394,102 | 881,131 | ||||||||
| JIAYIN GROUP INC. UNAUDITED CONDENSED CONSOLIDATED STATEMENTS OF COMPREHENSIVE INCOME (Amounts in thousands, except for share and per share data) | |||||||||||
| For the Three Months Ended March 31, | |||||||||||
| 2024 | 2025 | ||||||||||
| RMB | RMB | US$ | |||||||||
| Net revenue | 1,475,340 | 1,775,576 | 244,681 | ||||||||
| Operating costs and expenses: | |||||||||||
| Facilitation and servicing | (666,974 | ) | (336,011 | ) | (46,304 | ) | |||||
| Allowance for uncollectible assets, loans receivable and others | (2,617 | ) | (17,541 | ) | (2,417 | ) | |||||
| Sales and marketing | (359,818 | ) | (674,494 | ) | (92,948 | ) | |||||
| General and administrative | (46,215 | ) | (52,795 | ) | (7,275 | ) | |||||
| Research and development | (83,270 | ) | (88,088 | ) | (12,139 | ) | |||||
| Total operating costs and expenses | (1,158,894 | ) | (1,168,929 | ) | (161,083 | ) | |||||
| Income from operation | 316,446 | 606,647 | 83,598 | ||||||||
| Interest income, net | 1,916 | 4,175 | 575 | ||||||||
| Other income, net | 587 | 52,389 | 7,219 | ||||||||
| Income before income taxes | 318,949 | 663,211 | 91,392 | ||||||||
| Income tax expense | (45,882 | ) | (123,729 | ) | (17,050 | ) | |||||
| Net income | 273,067 | 539,482 | 74,342 | ||||||||
| Less: net loss attributable to noncontrolling interest shareholders | (3 | ) | (2 | ) | 0 | ||||||
| Net income attributable to Jiayin Group Inc. | 273,070 | 539,484 | 74,342 | ||||||||
| Weighted average shares used in calculating net income per share: | |||||||||||
| - Basic and diluted | 212,129,944 | 213,478,184 | 213,478,184 | ||||||||
| Net income per share: | |||||||||||
| - Basic and diluted | 1.29 | 2.53 | 0.35 | ||||||||
| Net income per ADS: | |||||||||||
| - Basic and diluted | 5.16 | 10.12 | 1.40 | ||||||||
| Net income | 273,067 | 539,482 | 74,342 | ||||||||
| Other comprehensive income, net of tax of nil: | |||||||||||
| Foreign currency translation adjustments | (3,140 | ) | (783 | ) | (108 | ) | |||||
| Comprehensive income | 269,927 | 538,699 | 74,234 | ||||||||
| Comprehensive income attributable to noncontrolling interest | 14 | 46 | 6 | ||||||||
| Total comprehensive income attributable to Jiayin Group Inc. | 269,913 | 538,653 | 74,228 | ||||||||
| JIAYIN GROUP INC. UNAUDITED RECONCILIATIONS OF GAAP AND NON-GAAP RESULTS (Amounts in thousands, except for share and per share data) | |||||||||||
| For the Three Months Ended March 31, | |||||||||||
| 2024 | 2025 | ||||||||||
| RMB | RMB | US$ | |||||||||
| Reconciliation of Non-GAAP income from operation to Income from operation | |||||||||||
| Income from operation: | 316,446 | 606,647 | 83,598 | ||||||||
| Add: share-based compensation expenses | 181 | - | - | ||||||||
| Non-GAAP income from operation | 316,627 | 606,647 | 83,598 | ||||||||
A chart accompanying this announcement is available at https://www.globenewswire.com/NewsRoom/AttachmentNg/ef2fd13b-9401-4da1-8ea9-6b42a1cf5267
