Dorian LPG Ltd. Announces Third Quarter Fiscal Year 2026 Financial Results
Key Terms
time charter equivalent financial
adjusted ebitda financial
baltic exchange liquid petroleum gas index market
sofr financial
panamax beam technical
saudi contract price market
pdh technical
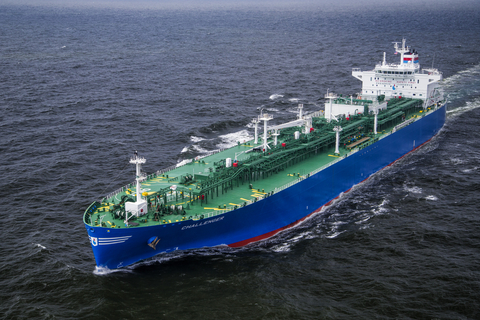
The Challenger - 2015 built VLGC
Key Recent Development
-
Declared an irregular dividend totaling approximately
$29.9 million $0.70
Highlights for the Third Quarter Fiscal Year 2026
-
Revenues of
$120.0 million
-
Time Charter Equivalent (“TCE”)(1) rate per available day for our fleet of
$50,333
-
Net income of
$47.2 million $1.11 $47.4 million $1.11
-
Adjusted EBITDA(1) of
$74.2 million
-
Declared an irregular cash dividend totaling
$27.8 million
(1) |
TCE, adjusted net income, adjusted EPS and adjusted EBITDA are non- |
John C. Hadjipateras, Chairman, President and Chief Executive Officer of the Company, commented, “Our seafaring and shoreside team delivered a strong operating performance in the quarter. We declared our 17th consecutive quarterly irregular dividend bringing total capital returned including buy backs, since our IPO, to over
Third Quarter Fiscal Year 2026 Results Summary
Net income amounted to
Adjusted net income amounted to
The
The TCE rate per available day for our fleet was
Vessel operating expenses per vessel per calendar day decreased to
Revenues
Revenues, which represent net pool revenues—related party, time charter revenues, and other revenues, net, were
Vessel Operating Expenses
Vessel operating expenses were
General and Administrative Expenses
General and administrative expenses were
Interest and Finance Costs
Interest and finance costs amounted to
Interest Income
Interest income amounted to
Unrealized Gain/(Loss) on Derivatives
Unrealized loss on derivatives amounted to
Realized Gain on Derivatives
Realized gain on derivatives amounted to
Fleet
The following table sets forth certain information regarding our fleet as of January 31, 2026.
|
|
|
|
|
|
|
|
|
|
|
|
|
|
|
|
|
|
|
|
|
|
|
|
|
|
|
|
Scrubber |
|
|
|
Time |
|
|
|
Capacity |
|
|
|
|
|
|
ECO |
|
Equipped |
|
|
|
Charter-Out |
|
|
|
(Cbm) |
|
Shipyard |
|
|
Year Built |
|
Vessel(1) |
|
or Dual-Fuel |
|
Employment |
|
Expiration(2) |
|
Dorian VLGCs |
|
|
|
|
|
|
|
|
|
|
|
|
|
|
|
|
Captain John NP |
|
82,000 |
|
Hyundai |
|
|
2007 |
|
— |
|
— |
|
Pool(4) |
|
— |
|
Comet |
|
84,000 |
|
Hyundai |
|
|
2014 |
|
X |
|
S |
|
Pool(4) |
|
— |
|
Corsair(3) |
|
84,000 |
|
Hyundai |
|
|
2014 |
|
X |
|
S |
|
Pool(4) |
|
— |
|
Corvette |
|
84,000 |
|
Hyundai |
|
|
2015 |
|
X |
|
S |
|
Pool(4) |
|
— |
|
Cougar(3) |
|
84,000 |
|
Hyundai |
|
|
2015 |
|
X |
|
— |
|
Pool(4) |
|
|
|
Concorde |
|
84,000 |
|
Hyundai |
|
|
2015 |
|
X |
|
S |
|
Pool(4) |
|
— |
|
Cobra |
|
84,000 |
|
Hyundai |
|
|
2015 |
|
X |
|
— |
|
Pool(4) |
|
— |
|
Continental |
|
84,000 |
|
Hyundai |
|
|
2015 |
|
X |
|
S |
|
Pool(4) |
|
— |
|
Constitution |
|
84,000 |
|
Hyundai |
|
|
2015 |
|
X |
|
S |
|
Pool(4) |
|
— |
|
Commodore |
|
84,000 |
|
Hyundai |
|
|
2015 |
|
X |
|
— |
|
Pool-TCO(5) |
|
Q3 2027 |
|
Cresques(3) |
|
84,000 |
|
Hanwha Ocean |
|
|
2015 |
|
X |
|
S |
|
Pool(4) |
|
— |
|
Constellation |
|
84,000 |
|
Hyundai |
|
|
2015 |
|
X |
|
S |
|
Pool(4) |
|
— |
|
Cheyenne |
|
84,000 |
|
Hyundai |
|
|
2015 |
|
X |
|
S |
|
Pool(4) |
|
— |
|
Clermont |
|
84,000 |
|
Hyundai |
|
|
2015 |
|
X |
|
S |
|
Pool(4) |
|
— |
|
Cratis(3) |
|
84,000 |
|
Hanwha Ocean |
|
|
2015 |
|
X |
|
S |
|
Pool(4) |
|
— |
|
Chaparral(3) |
|
84,000 |
|
Hyundai |
|
|
2015 |
|
X |
|
— |
|
Pool-TCO(5) |
|
Q3 2027 |
|
Copernicus(3) |
|
84,000 |
|
Hanwha Ocean |
|
|
2015 |
|
X |
|
S |
|
Pool(4) |
|
— |
|
Commander |
|
84,000 |
|
Hyundai |
|
|
2015 |
|
X |
|
S |
|
Pool(4) |
|
— |
|
Challenger |
|
84,000 |
|
Hyundai |
|
|
2015 |
|
X |
|
S |
|
Pool-TCO(5) |
|
Q3 2026 |
|
Caravelle(3) |
|
84,000 |
|
Hyundai |
|
|
2016 |
|
X |
|
S |
|
Pool(4) |
|
— |
|
Captain Markos(3) |
|
84,000 |
|
|
|
|
2023 |
|
X |
|
DF |
|
Pool(4) |
|
— |
|
Total |
|
1,762,000 |
|
|
|
|
|
|
|
|
|
|
|
|
|
|
|
|
|
|
|
|
|
|
|
|
|
|
|
|
|
|
|
Time chartered-in VLGCs |
|
|
|
|
|
|
|
|
|
|
|
|
|
|
|
|
Future Diamond(6) |
|
80,876 |
|
Hyundai |
|
|
2020 |
|
X |
|
S |
|
Pool(4) |
|
— |
|
HLS Citrine(7) |
|
86,090 |
|
Hyundai |
|
|
2023 |
|
X |
|
DF |
|
Pool(4) |
|
— |
|
HLS Diamond(8) |
|
86,090 |
|
Hyundai |
|
|
2023 |
|
X |
|
DF |
|
Pool(4) |
|
— |
|
Cristobal(9) |
|
86,980 |
|
Hyundai |
|
|
2023 |
|
X |
|
DF |
|
Pool(4) |
|
— |
|
Crystal Asteria(10) |
|
84,229 |
|
|
|
|
2021 |
|
X |
|
DF |
|
Pool(4) |
|
— |
|
BW |
|
83,271 |
|
Mitsubishi |
|
|
2009 |
|
— |
|
— |
|
Pool(4) |
|
— |
|
| _______________________ | ||
(1) |
Represents vessels with very low revolutions per minute, long-stroke, electronically controlled engines, larger propellers, advanced hull design, and low friction paint. |
|
|
|
|
(2) |
Represents calendar year quarters. |
|
|
|
|
(3) |
Operated pursuant to a bareboat chartering agreement. |
|
|
|
|
(4) |
“Pool” indicates that the vessel operates in the Helios Pool on a voyage charter with a third party and we receive a portion of the pool profits calculated according to a formula based on the vessel’s pro rata performance in the pool. |
|
|
|
|
(5) |
“Pool-TCO” indicates that the vessel is operated in the Helios Pool on a time charter out to a third party and we receive a portion of the pool profits calculated according to a formula based on the vessel’s pro rata performance in the pool. |
|
|
|
|
(6) |
Vessel has a Panamax beam and is currently time chartered-in to our fleet with an expiration during the first calendar quarter of 2027. |
|
|
|
|
(7) |
Vessel has a Panamax beam and is currently time chartered-in to our fleet with an expiration during the first calendar quarter of 2030 and purchase options beginning in year seven. |
|
|
|
|
(8) |
Vessel has a Panamax beam and is currently time chartered-in to our fleet with an expiration during the first calendar quarter of 2030 and purchase options beginning in year seven. |
|
|
|
|
(9) |
Vessel has a Panamax beam and shaft generator and is currently time chartered-in to our fleet with an expiration during the third calendar quarter of 2030 and purchase options beginning in year seven. |
|
|
|
|
(10) |
Vessel is currently time chartered-in to our fleet with an expiration during the second calendar quarter of 2026. |
|
|
|
|
(11) |
Vessel is currently time chartered-in to our fleet with an expiration during the second calendar quarter of 2028. Vessel operates under a framework agreement in which the vessel’s revenues and charter hire-in expenses are split equally with an unrelated third party. |
|
Market Outlook & Update
The fourth calendar quarter of 2025 (“Q4 2025”) proved to be a volatile quarter for the LPG product market, beginning in October with a sharp decline in the Saudi Contract Price (“CP”) for propane and butane prices that was more pronounced than many market participants had anticipated. Monthly propane CP prices fell by
A recovery in delivered product prices emerged in November, with further strengthening in December as winter seasonal demand took precedence. December saw a cold spell in the
Overall, Q4 2025 saw wider price spreads between the
Despite improving supply-chain economics, petrochemical margins remained challenging for several players, particularly in the Far East. Average monthly PDH margins in the Far East on a variable basis turned positive in October 2025 for the first time since the second calendar quarter of 2025 due to the softer feedstock prices. This improvement was short-lived with margins turning negative by the end of October/start of November. Economics were especially challenging for importers of
Propane continued to hold an advantage over naphtha for ethylene production via steam cracking; however, the propane–naphtha spread narrowed over the quarter, tightening from an average of -
Geopolitical factors continued to affect LPG and broader oil markets. Early in the quarter, uncertainty surrounded U.S.–China trade relations as the existing 90-day tariff truce approached expiry in early November. The
Average VLGC freight rates eased in Q4 2025, with the Baltic Index averaging around
During Q4 2025, the global VLGC fleet expanded only marginally with the delivery of two new vessels. Looking ahead, an additional 111 VLGCs/VLACs, equivalent to roughly 10.0 million cbm of carrying capacity, are scheduled for delivery by calendar year 2029. The average age of the global fleet now stands at approximately 12.0 years, while the VLGC/VLAC orderbook represents around
The above market outlook update is based on information, data and estimates derived from industry sources available as of the date of this release, and there can be no assurances that such trends will continue or that anticipated developments in freight rates, export volumes, the VLGC orderbook or other market indicators will materialize. This information, data and estimates involve a number of assumptions and limitations, are subject to risks and uncertainties, and are subject to change based on various factors. You are cautioned not to give undue weight to such information, data and estimates. We have not independently verified any third-party information, verified that more recent information is not available and undertake no obligation to update this information unless legally obligated.
Financial Information
The following table presents our selected financial data and other information for the periods presented:
|
|
|
|
|
|
|
|
|
|
|
|
|
|
|
||||
|
|
Three months ended |
|
|
Nine months ended |
|
||||||||||||
(in |
|
December 31, 2025 |
|
December 31, 2024 |
|
|
December 31, 2025 |
|
December 31, 2024 |
|
||||||||
Statement of Operations Data |
|
|
|
|
|
|
|
|
|
|
|
|
|
|
||||
Revenues |
|
$ |
119,964,287 |
|
|
$ |
80,666,779 |
|
|
|
$ |
328,240,534 |
|
|
$ |
277,453,301 |
|
|
Expenses |
|
|
|
|
|
|
|
|
|
|
|
|
|
|
||||
Voyage expenses |
|
|
1,732,701 |
|
|
|
950,842 |
|
|
|
|
4,109,374 |
|
|
|
2,508,379 |
|
|
Charter hire expenses |
|
|
18,186,009 |
|
|
|
10,586,115 |
|
|
|
|
42,622,036 |
|
|
|
31,082,323 |
|
|
Profit sharing expenses |
|
|
659,346 |
|
|
|
— |
|
|
|
|
659,346 |
|
|
|
— |
|
|
Vessel operating expenses |
|
|
19,851,216 |
|
|
|
21,439,514 |
|
|
|
|
62,445,778 |
|
|
|
61,459,709 |
|
|
Depreciation and amortization |
|
|
18,129,336 |
|
|
|
17,497,383 |
|
|
|
|
54,430,352 |
|
|
|
52,039,031 |
|
|
General and administrative expenses |
|
|
10,779,733 |
|
|
|
7,464,856 |
|
|
|
|
39,701,876 |
|
|
|
34,347,576 |
|
|
Total expenses |
|
|
69,338,341 |
|
|
|
57,938,710 |
|
|
|
|
203,968,762 |
|
|
|
181,437,018 |
|
|
Other income—related parties |
|
|
685,009 |
|
|
|
655,365 |
|
|
|
|
1,975,737 |
|
|
|
1,936,762 |
|
|
Operating income |
|
|
51,310,955 |
|
|
|
23,383,434 |
|
|
|
|
126,247,509 |
|
|
|
97,953,045 |
|
|
Other income/(expenses) |
|
|
|
|
|
|
|
|
|
|
|
|
|
|
||||
Interest and finance costs |
|
|
(7,066,278 |
) |
|
|
(8,884,499 |
) |
|
|
|
(22,380,183 |
) |
|
|
(27,841,202 |
) |
|
Interest income |
|
|
2,737,490 |
|
|
|
3,797,264 |
|
|
|
|
8,577,713 |
|
|
|
11,986,945 |
|
|
Unrealized gain/(loss) on derivatives |
|
|
(170,904 |
) |
|
|
2,865,617 |
|
|
|
|
(1,736,403 |
) |
|
|
(3,139,248 |
) |
|
Realized gain on derivatives |
|
|
407,391 |
|
|
|
838,906 |
|
|
|
|
1,474,915 |
|
|
|
4,210,274 |
|
|
Other gain/(loss), net |
|
|
(29,756 |
) |
|
|
(638,894 |
) |
|
|
|
469,484 |
|
|
|
(1,091,241 |
) |
|
Total other expenses, net |
|
|
(4,122,057 |
) |
|
|
(2,021,606 |
) |
|
|
|
(13,594,474 |
) |
|
|
(15,874,472 |
) |
|
Net income |
|
$ |
47,188,898 |
|
|
$ |
21,361,828 |
|
|
|
$ |
112,653,035 |
|
|
$ |
82,078,573 |
|
|
Earnings per common share—basic |
|
|
1.11 |
|
|
|
0.50 |
|
|
|
|
2.65 |
|
|
|
1.95 |
|
|
Earnings per common share—diluted |
|
$ |
1.11 |
|
|
$ |
0.50 |
|
|
|
$ |
2.64 |
|
|
$ |
1.95 |
|
|
Financial Data |
|
|
|
|
|
|
|
|
|
|
|
|
|
|
||||
Adjusted EBITDA(1) |
|
$ |
74,182,190 |
|
|
$ |
45,242,519 |
|
|
|
$ |
198,478,998 |
|
|
$ |
169,351,603 |
|
|
Fleet Data |
|
|
|
|
|
|
|
|
|
|
|
|
|
|
||||
Calendar days(2) |
|
|
1,932 |
|
|
|
1,932 |
|
|
|
|
5,775 |
|
|
|
5,775 |
|
|
Time chartered-in days(3) |
|
|
552 |
|
|
|
368 |
|
|
|
|
1,383 |
|
|
|
1,100 |
|
|
Available days(4) |
|
|
2,349 |
|
|
|
2,210 |
|
|
|
|
6,725 |
|
|
|
6,677 |
|
|
Average Daily Results |
|
|
|
|
|
|
|
|
|
|
|
|
|
|
||||
Time charter equivalent rate(5) |
|
$ |
50,333 |
|
|
$ |
36,071 |
|
|
|
$ |
48,198 |
|
|
$ |
41,178 |
|
|
Daily vessel operating expenses (6) |
|
$ |
10,275 |
|
|
$ |
11,097 |
|
|
|
$ |
10,813 |
|
|
$ |
10,642 |
|
|
| _____________________ | ||
(1) |
Adjusted EBITDA is an unaudited non- |
|
|
|
|
|
Adjusted EBITDA has certain limitations in use and should not be considered an alternative to net income/(loss), operating income, cash flow from operating activities or any other measure of financial performance presented in accordance with |
|
|
|
|
|
The following table sets forth a reconciliation of net income to Adjusted EBITDA (unaudited) for the periods presented: |
|
|
|
|
|
|
|
|
|
|
|
|
|
|
|
||||
|
|
Three months ended |
|
Nine months ended |
|
||||||||||||
(in |
|
December 31, 2025 |
|
December 31, 2024 |
|
December 31, 2025 |
|
December 31, 2024 |
|
||||||||
Net income |
|
$ |
47,188,898 |
|
|
$ |
21,361,828 |
|
|
$ |
112,653,035 |
|
|
$ |
82,078,573 |
|
|
Interest and finance costs |
|
|
7,066,278 |
|
|
|
8,884,499 |
|
|
|
22,380,183 |
|
|
|
27,841,202 |
|
|
Unrealized (gain)/loss on derivatives |
|
|
170,904 |
|
|
|
(2,865,617 |
) |
|
|
1,736,403 |
|
|
|
3,139,248 |
|
|
Realized gain on interest rate swaps |
|
|
(407,391 |
) |
|
|
(1,337,298 |
) |
|
|
(1,474,915 |
) |
|
|
(4,722,356 |
) |
|
Stock-based compensation expense |
|
|
2,034,165 |
|
|
|
1,701,724 |
|
|
|
8,753,940 |
|
|
|
8,975,905 |
|
|
Depreciation and amortization |
|
|
18,129,336 |
|
|
|
17,497,383 |
|
|
|
54,430,352 |
|
|
|
52,039,031 |
|
|
Adjusted EBITDA |
|
$ |
74,182,190 |
|
|
$ |
45,242,519 |
|
|
$ |
198,478,998 |
|
|
$ |
169,351,603 |
|
|
(2) |
We define calendar days as the total number of days in a period during which each vessel in our fleet was owned or operated pursuant to a bareboat charter. Calendar days are an indicator of the size of the fleet over a period and affect both the amount of revenues and the amount of vessel operating expenses that are recorded during that period. |
|
|
|
|
(3) |
We define time chartered-in days as the aggregate number of days in a period during which we time chartered-in vessels from third parties. Time chartered-in days are an indicator of the size of the fleet over a period and affect both the amount of revenues and the amount of charter hire expenses that are recorded during that period. Time chartered-in days include |
|
|
|
|
(4) |
We define available days as the sum of calendar days and time chartered-in days (collectively representing our commercially-managed vessels) less aggregate off hire days associated with both unscheduled and scheduled maintenance, which include major repairs, drydockings, vessel upgrades or special or intermediate surveys. We use available days to measure the aggregate number of days in a period that our vessels should be capable of generating revenues. |
|
|
|
|
(5) |
Time charter equivalent rate, or TCE rate, is a non- |
|
|
|
|
|
The following table sets forth a reconciliation of revenues to TCE rate (unaudited) for the periods presented: |
|
|
|
|
|
|
|
|
|
|
|
|
|
|
|
||||
|
|
Three months ended |
|
|
Nine months ended |
|
||||||||||||
(in |
|
December 31, 2025 |
|
December 31, 2024 |
|
|
December 31, 2025 |
|
December 31, 2024 |
|
||||||||
Numerator: |
|
|
|
|
|
|
|
|
|
|
|
|
|
|
||||
Revenues |
|
$ |
119,964,287 |
|
|
$ |
80,666,779 |
|
|
|
$ |
328,240,534 |
|
|
$ |
277,453,301 |
|
|
Voyage expenses |
|
|
(1,732,701 |
) |
|
|
(950,842 |
) |
|
|
|
(4,109,374 |
) |
|
|
(2,508,379 |
) |
|
Time charter equivalent |
|
$ |
118,231,586 |
|
|
$ |
79,715,937 |
|
|
|
$ |
324,131,160 |
|
|
$ |
274,944,922 |
|
|
|
|
|
|
|
|
|
|
|
|
|
|
|
|
|
||||
Pool adjustment* |
|
|
274,222 |
|
|
|
(1,316,039 |
) |
|
|
|
895,366 |
|
|
|
(2,050 |
) |
|
Time charter equivalent excluding pool adjustment* |
|
$ |
118,505,808 |
|
|
$ |
78,399,898 |
|
|
|
$ |
325,026,526 |
|
|
$ |
274,942,872 |
|
|
|
|
|
|
|
|
|
|
|
|
|
|
|
|
|
||||
Denominator: |
|
|
|
|
|
|
|
|
|
|
|
|
|
|
||||
Available days |
|
|
2,349 |
|
|
|
2,210 |
|
|
|
|
6,725 |
|
|
|
6,677 |
|
|
TCE rate: |
|
|
|
|
|
|
|
|
|
|
|
|
|
|
||||
Time charter equivalent rate |
|
$ |
50,333 |
|
|
$ |
36,071 |
|
|
|
$ |
48,198 |
|
|
$ |
41,178 |
|
|
TCE rate excluding pool adjustment* |
|
$ |
50,449 |
|
|
$ |
35,475 |
|
|
|
$ |
48,331 |
|
|
$ |
41,178 |
|
|
|
* Adjusted for the effects of reallocations of pool profits in accordance with the pool participation agreements primarily resulting from the actual speed and consumption performance of the vessels operating in the Helios Pool exceeding the originally estimated speed and consumption levels. |
|
|
|
|
(6) |
Daily vessel operating expenses are calculated by dividing vessel operating expenses by calendar days for the relevant time period. |
In addition to the results of operations presented in accordance with
|
|
|
|
|
|
|
|
|
|
|
|
|
|
|
|
|
|
Three months ended |
|
|
Nine months ended |
|
|||||||||
(in |
|
December 31, 2025 |
|
December 31, 2024 |
|
|
December 31, 2025 |
|
December 31, 2024 |
|
|||||
Net income |
|
$ |
47,188,898 |
|
$ |
21,361,828 |
|
|
|
$ |
112,653,035 |
|
$ |
82,078,573 |
|
Unrealized loss/(gain) on derivatives |
|
|
170,904 |
|
|
(2,865,617 |
) |
|
|
|
1,736,403 |
|
|
3,139,248 |
|
Adjusted net income |
|
$ |
47,359,802 |
|
$ |
18,496,211 |
|
|
|
$ |
114,389,438 |
|
$ |
85,217,821 |
|
|
|
|
|
|
|
|
|
|
|
|
|
|
|
|
|
Earnings per common share—diluted |
|
$ |
1.11 |
|
$ |
0.50 |
|
|
|
$ |
2.64 |
|
$ |
1.95 |
|
Unrealized loss/(gain) on derivatives |
|
|
— |
|
|
(0.07 |
) |
|
|
|
0.03 |
|
|
0.07 |
|
Adjusted earnings per common share—diluted |
|
$ |
1.11 |
|
$ |
0.43 |
|
|
|
$ |
2.67 |
|
$ |
2.02 |
|
The following table presents our unaudited balance sheets as of the dates presented:
|
|
|
|
|
|
|
|
||
|
|
As of |
|
As of |
|
||||
|
|
December 31, 2025 |
|
March 31, 2025 |
|
||||
Assets |
|
|
|
|
|
|
|
||
Current assets |
|
|
|
|
|
|
|
||
Cash and cash equivalents |
|
$ |
294,492,379 |
|
|
$ |
316,877,584 |
|
|
Trade receivables, net and accrued revenues |
|
|
1,634,228 |
|
|
|
1,356,827 |
|
|
Due from related parties |
|
|
71,715,752 |
|
|
|
48,090,301 |
|
|
Inventories |
|
|
2,250,656 |
|
|
|
2,508,684 |
|
|
Prepaid expenses and other current assets |
|
|
22,193,053 |
|
|
|
13,523,008 |
|
|
Total current assets |
|
|
392,286,068 |
|
|
|
382,356,404 |
|
|
Fixed assets |
|
|
|
|
|
|
|
||
Vessels, net |
|
|
1,102,793,855 |
|
|
|
1,149,806,782 |
|
|
Vessel under construction |
|
|
64,805,270 |
|
|
|
37,274,863 |
|
|
Total fixed assets |
|
|
1,167,599,125 |
|
|
|
1,187,081,645 |
|
|
Other non-current assets |
|
|
|
|
|
|
|
||
Deferred charges, net |
|
|
25,098,842 |
|
|
|
17,237,662 |
|
|
Derivative instruments |
|
|
1,761,090 |
|
|
|
3,497,493 |
|
|
Due from related parties—non-current |
|
|
27,500,000 |
|
|
|
26,400,000 |
|
|
Restricted cash—non-current |
|
|
81,418 |
|
|
|
76,028 |
|
|
Operating lease right-of-use assets |
|
|
160,430,695 |
|
|
|
159,212,010 |
|
|
Other non-current assets |
|
|
2,982,095 |
|
|
|
2,799,038 |
|
|
Total assets |
|
$ |
1,777,739,333 |
|
|
$ |
1,778,660,280 |
|
|
Liabilities and shareholders’ equity |
|
|
|
|
|
|
|
||
Current liabilities |
|
|
|
|
|
|
|
||
Trade accounts payable |
|
$ |
6,690,725 |
|
|
$ |
11,549,950 |
|
|
Accrued expenses |
|
|
8,933,011 |
|
|
|
5,387,465 |
|
|
Due to related parties |
|
|
240,732 |
|
|
|
39,339 |
|
|
Deferred income |
|
|
501,203 |
|
|
|
679,257 |
|
|
Current portion of long-term operating lease liabilities |
|
|
47,812,434 |
|
|
|
34,808,203 |
|
|
Current portion of long-term debt |
|
|
97,746,233 |
|
|
|
54,504,778 |
|
|
Dividends payable |
|
|
537,458 |
|
|
|
915,150 |
|
|
Total current liabilities |
|
|
162,461,796 |
|
|
|
107,884,142 |
|
|
Long-term liabilities |
|
|
|
|
|
|
|
||
Long-term debt—net of current portion and deferred financing fees |
|
|
415,437,178 |
|
|
|
498,773,969 |
|
|
Long-term operating lease liabilities |
|
|
112,630,566 |
|
|
|
124,419,545 |
|
|
Other long-term liabilities |
|
|
1,580,355 |
|
|
|
1,476,439 |
|
|
Total long-term liabilities |
|
|
529,648,099 |
|
|
|
624,669,953 |
|
|
Total liabilities |
|
|
692,109,895 |
|
|
|
732,554,095 |
|
|
Commitments and contingencies |
|
|
— |
|
|
|
— |
|
|
Shareholders’ equity |
|
|
|
|
|
|
|
||
Preferred stock, |
|
|
— |
|
|
|
— |
|
|
Common stock, |
|
|
546,093 |
|
|
|
543,244 |
|
|
Additional paid-in-capital |
|
|
876,275,164 |
|
|
|
867,524,073 |
|
|
Treasury stock, at cost; 11,865,187 and 11,576,717 shares as of December 31, 2025 and March 31, 2025, respectively |
|
|
(140,116,177 |
) |
|
|
(133,103,957 |
) |
|
Retained earnings |
|
|
348,924,358 |
|
|
|
311,142,825 |
|
|
Total shareholders’ equity |
|
|
1,085,629,438 |
|
|
|
1,046,106,185 |
|
|
Total liabilities and shareholders’ equity |
|
$ |
1,777,739,333 |
|
|
$ |
1,778,660,280 |
|
|
Seasonality
Liquefied petroleum gases are primarily used for industrial and domestic heating, as chemical and refinery feedstock, as transportation fuel and in agriculture. The LPG shipping market historically has been stronger in the spring and summer months in anticipation of increased consumption of propane and butane for heating during the winter months. In addition, unpredictable weather patterns in these months tend to disrupt vessel scheduling and the supply of certain commodities. Demand for our vessels therefore may be stronger in our quarters ending June 30 and September 30 and relatively weaker during our quarters ending December 31 and March 31, although 12-month time charter rates tend to smooth out these short-term fluctuations and recent LPG shipping market activity has not yielded the typical seasonal results. The increase in petrochemical industry buying has contributed to less marked seasonality than in the past, but there can no guarantee that this trend will continue. To the extent any of our time charters expire during the typically weaker fiscal quarters ending December 31 and March 31, it may not be possible to re-charter our vessels at similar rates. As a result, we may have to accept lower rates or experience off-hire time for our vessels, which may adversely impact our business, financial condition and operating results.
Conference Call
A conference call to discuss the results will be held the same day at 10:00 a.m. ET. The conference call can be accessed live by dialing 1- 800-445-7795, or for international callers, 1-785- 424-1699, and requesting to be joined into the Dorian LPG call. A replay will be available at 1:00 p.m. ET the same day and can be accessed by dialing 1-844-512-2921, or for international callers, 1-412-317-6671. The passcode for the replay is 11160929. The replay will be available until February 12, 2026, at 11:59 p.m. ET.
A live webcast of the conference call will also be available under the investor relations section at www.dorianlpg.com.
The information on our website does not form a part of and is not incorporated by reference into this release.
About Dorian LPG Ltd.
Dorian LPG is a leading owner and operator of modern Very Large Gas Carriers (“VLGCs”) that transport liquefied petroleum gas globally. Our current fleet of twenty-seven modern VLGCs includes twenty ECO VLGCs, five dual-fuel ECO VLGCs, and two modern VLGCs.
Forward-Looking and Other Cautionary Statements
The cash dividends referenced in this release are irregular dividends. All declarations of dividends are subject to the determination and discretion of our Board of Directors based on its consideration of various factors, including the Company’s results of operations, financial condition, level of indebtedness, anticipated capital requirements, contractual restrictions, restrictions in its debt agreements, restrictions under applicable law, its business prospects and other factors that our Board of Directors may deem relevant. The Board of Directors, in its sole discretion, may increase, decrease or eliminate the dividend at any time.
This press release contains "forward-looking statements." Statements that are predictive in nature, that depend upon or refer to future events or conditions, or that include words such as "expects," "anticipates," "intends," "plans," "believes," "estimates," "projects," "forecasts," "may," "will," "should" and similar expressions are forward-looking statements. These statements are not historical facts but instead represent only the Company's current expectations and observations regarding future results, many of which, by their nature, are inherently uncertain and outside of the Company's control. Where the Company expresses an expectation or belief as to future events or results, such expectation or belief is expressed in good faith and believed to have a reasonable basis. However, the Company’s forward-looking statements are subject to risks, uncertainties, and other factors, which could cause actual results to differ materially from future results expressed, projected, or implied by those forward-looking statements. The Company’s actual results may differ, possibly materially, from those anticipated in these forward-looking statements as a result of certain factors, including changes in the Company’s financial resources and operational capabilities and as a result of certain other factors listed from time to time in the Company's filings with the
View source version on businesswire.com: https://www.businesswire.com/news/home/20260205206067/en/
Investor Contact Information
Ted Young
Chief Financial Officer
+1 (203) 674-9900
IR@dorianlpg.com
Media Contact Information
Melissa Daly
MFD Communications
+1 (646) 322-9192
melissa@mfdcommunications.com
Source: Dorian LPG Ltd.