Medtronic reports third quarter fiscal 2023 financial results
Rhea-AI Summary
Medtronic plc (NYSE:MDT) reported Q3 FY2023 results with revenues of $7.7 billion, flat as reported but up 4.1% organic, exceeding expectations. GAAP diluted EPS fell 16% to $0.92, while non-GAAP diluted EPS decreased 4% to $1.30, also above forecasts. Notable growth was seen in the Cardiovascular and Neuroscience portfolios, contributing to a positive revenue outlook. The company raised its FY23 organic revenue growth guidance and EPS outlook, anticipating 4.5% to 5.0% organic revenue growth in Q4, despite potential foreign currency impacts of $165 million to $215 million.
Positive
- Q3 revenue of $7.727 billion, flat reported but up 4.1% organic.
- GAAP EPS at $0.92, non-GAAP EPS at $1.30, both exceeding expectations.
- Positive growth in Cardiovascular and Neuroscience portfolios.
- Increased FY23 organic revenue growth and EPS outlook.
- Forecasts 4.5% to 5.0% organic revenue growth in Q4.
Negative
- GAAP net income decreased by 17% year-over-year.
- Diluted EPS declined by 16% year-over-year.
- U.S. revenue of $4.062 billion increased only 3% as reported.
- Challenges in China due to volume-based procurement (VBP) and COVID-19 resurgence.
News Market Reaction – MDT
In the trading session that priced this news, MDT gained 0.81%, reflecting a mild positive market reaction.
Data tracked by StockTitan Argus on the day of publication.
AI-generated analysis. How Rhea-AI works. Not financial advice.
Delivers top and bottom line ahead of expectations, with strength in Cardiovascular and Neuroscience portfolios
Key Highlights
- Revenue of
$7.7 billion 4.1% organic, ahead of expectations - GAAP diluted EPS of
$0.92 16% ; non-GAAP diluted EPS of$1.30 4% , ahead of expectations - Company increases FY23 organic revenue growth and EPS outlook
Medtronic reported third quarter worldwide revenue of
The company's third quarter organic revenue results reflect strong performances in the Cardiovascular and Neuroscience portfolios, in Diabetes markets outside the
As reported, third quarter GAAP net income and diluted earnings per share (EPS) were
Third quarter
"We returned to mid-single digit organic growth as we continue to execute our strategy with urgency. Our Cardiovascular and Neuroscience portfolios had strong, high-single digit organic growth as we launched new products and demonstrated continued strength in our established, market-leading Cardiac Rhythm Management and Spine franchises," said
Cardiovascular Portfolio
The Cardiovascular Portfolio includes the Cardiac Rhythm & Heart Failure (CRHF), Structural Heart & Aortic (SHA), and Coronary & Peripheral Vascular (CPV) divisions. Cardiovascular revenue of
- Cardiac Rhythm & Heart Failure revenue of
$1.431 billion 2% as reported and increased7% organic. Cardiac Rhythm Management revenue increased high-single digits, with high-single digit growth in both Defibrillation Solutions and Cardiac Pacing Therapies, including mid-teens growth in leadless pacemakers from continued global adoption of Micra™ transcatheter pacing systems. Cardiac Ablation Solutions revenue increased low-single digits, including low-double digit growth in theU.S. on the continued adoption of its Arctic Front™ cryoablation catheters.Cardiovascular Diagnostics revenue increased low-double digits, given increased supply and strong market adoption of the LINQ II™ insertable cardiac monitor.
- Structural Heart & Aortic revenue of
$760 million 3% as reported and9% organic. Structural Heart increased high-single digits, with low-double digit growth in transcatheter aortic valves (TAVR) as the company continues to build on its strong durability data and theU.S. launch of the Evolut™ FX TAVR system. Aortic also increased low-double digits with high-teens growth in abdominal aortic stent graft systems on improved product availability. Cardiac Surgery increased mid-single digits, driven by growth in surgical valves and perfusion systems.
- Coronary & Peripheral Vascular revenue of
$581 million 4% as reported and increased1% organic. Coronary increased low-single digits with strength in coronary balloons andU.S. drug-eluting stent share gains from the continued launch of the Onyx Frontier™ drug-eluting stent.Peripheral Vascular Health also increased low-single digits, with low-double digit growth in drug-coated balloons and high-single digit growth in vascular embolization and superficial venous products.
Medical Surgical Portfolio
The Medical Surgical Portfolio includes the Surgical Innovations (SI) and the Respiratory, Gastrointestinal & Renal (RGR) divisions. Medical Surgical revenue of
- Surgical Innovations revenue of
$1.425 billion 6% as reported and1% organic. SI revenue increased5% organic excluding the unfavorable impact of sales inChina . The company won back share sequentially, as it recovered from supply challenges faced in prior quarters. Advanced Surgical Instruments decreased low-single digits, with Advanced Stapling low-double digit declines resulting from China VBP tenders offsetting mid-single digit growth in Advanced Energy. In Surgical Robotics, the company increased sales in markets outside theU.S. and announced first patient enrollment in its Expand UROU.S. clinical trial for the Hugo™ robotic-assisted surgery system.
- Respiratory, Gastrointestinal & Renal revenue of
$712 million 8% as reported and3% organic. RGR revenue was flat organic excluding the impact of ventilator sales. Respiratory Interventions decreased low-double digits, with sales of ventilators declining high-twenties as demand continued to be well below pre-pandemic levels as expected. Patient Monitoring increased low-single digits, with low-single digit growth in Nellcor™ pulse oximetry and mid-single digit growth in Perioperative Complications. InOctober 2022 , the company announced its intention to separate the combined Respiratory Interventions and Patient Monitoring businesses, which it continues to expect to be completed in the second half of its fiscal year 2024. Gastrointestinal revenue increased high-single digits on strength in sales of GI Genius™ intelligent endoscopy module. Renal Care Solutions decreased high-single digits given product availability challenges. InMay 2022 , Medtronic announced its intention to contribute its Renal Care Solutions business into a new, independent kidney care-focused medical device company together with DaVita, which it expects to close in the fourth fiscal quarter.
Neuroscience Portfolio
The Neuroscience Portfolio includes the Cranial & Spinal Technologies (CST), Specialty Therapies, and Neuromodulation divisions. Neuroscience revenue of
- Cranial & Spinal Technologies revenue of
$1.128 billion 2% as reported and5% organic, as the company continues to benefit from its Aible™ spine technology ecosystem. Spine & Biologics increased low-single digits, with mid-single digit growth in Core Spine offsetting high-single digit declines in Biologics. Neurosurgery increased high-single digits, with double digit growth in robotics, navigation, imaging, and powered surgical instruments.
- Specialty Therapies revenue of
$699 million 10% as reported and11% organic. Neurovascular increased high-single digits, with double digit growth in aspiration, flow diversion, and liquid embolic products, and high-single digit growth in mechanical thrombectomy.Pelvic Health increased mid-single digits on the continued adoption of its InterStim™ sacral neuromodulation systems. ENT increased low-twenties on an organic basis driven by strength in NIM Vital™ nerve monitoring systems and improved product availability.
- Neuromodulation revenue of
$420 million 3% as reported and6% organic. Pain Therapies increased low-double digits, with low-double digit growth in both Pain Stim and Targeted Drug Delivery, and low-single digit growth in Interventional. Brain Modulation decreased low-single digits on continued declines of replacement devices.
Diabetes
Diabetes revenue of
Guidance
The company today issued fourth quarter revenue growth guidance and tightened its full year EPS guidance for fiscal 2023.
The company expects fourth quarter organic revenue growth of
The company increased the lower end of its fiscal year 2023 diluted non-GAAP EPS guidance from the prior range of
"Given our third quarter performance, we are raising our full year outlook and expect our momentum to continue in the fourth quarter," said
Webcast Information
Medtronic will host a webcast today,
Medtronic plans to report its fourth quarter and full fiscal year 2023 results on
Financial Schedules
The third quarter financial schedules and non-GAAP reconciliations can be viewed by clicking on the Investor Events link at investorrelations.medtronic.com. To view a printable PDF of the financial schedules and non-GAAP reconciliations, click here. To view the third quarter earnings presentation, click here.
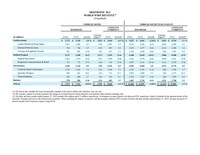
WORLD WIDE REVENUE(1) (Unaudited) | ||||||||||||||||||||||||
THIRD QUARTER | THIRD QUARTER YEAR-TO-DATE | |||||||||||||||||||||||
REPORTED | CONSTANT | REPORTED | CONSTANT | |||||||||||||||||||||
(in millions) | FY23 | FY22 | Growth | Currency | FY23 | Growth(3) | FY23 | FY22 | Growth | Currency | FY23 | Growth(3) | ||||||||||||
Cardiovascular | $ 2,772 | $ 2,745 | 1.0 % | $ (152) | $ 2,924 | 6.5 % | $ 8,257 | $ 8,462 | (2.4) % | $ (467) | $ 8,724 | 3.1 % | ||||||||||||
Cardiac Rhythm & Heart Failure | 1,431 | 1,402 | 2.1 | (76) | 1,507 | 7.5 | 4,255 | 4,356 | (2.3) | (238) | 4,493 | 3.1 | ||||||||||||
Structural Heart & Aortic | 760 | 740 | 2.7 | (45) | 805 | 8.8 | 2,259 | 2,277 | (0.8) | (141) | 2,400 | 5.4 | ||||||||||||
Coronary & Peripheral Vascular | 581 | 603 | (3.6) | (31) | 612 | 1.5 | 1,744 | 1,829 | (4.6) | (88) | 1,832 | 0.2 | ||||||||||||
Medical Surgical | 2,137 | 2,290 | (6.7) | (117) | 2,254 | (1.6) | 6,208 | 6,910 | (10.2) | (380) | 6,588 | (4.7) | ||||||||||||
Surgical Innovations | 1,425 | 1,519 | (6.2) | (81) | 1,506 | (0.9) | 4,162 | 4,570 | (8.9) | (269) | 4,431 | (3.0) | ||||||||||||
Respiratory, Gastrointestinal, & Renal | 712 | 771 | (7.7) | (36) | 748 | (3.0) | 2,047 | 2,341 | (12.6) | (111) | 2,158 | (7.8) | ||||||||||||
Neuroscience | 2,248 | 2,144 | 4.9 | (78) | 2,326 | 8.5 | 6,549 | 6,484 | 1.0 | (227) | 6,776 | 4.5 | ||||||||||||
Cranial & Spinal Technologies | 1,128 | 1,102 | 2.4 | (32) | 1,160 | 5.3 | 3,253 | 3,292 | (1.2) | (96) | 3,349 | 1.7 | ||||||||||||
Specialty Therapies | 699 | 633 | 10.4 | (32) | 731 | 15.5 | 2,052 | 1,908 | 7.5 | (85) | 2,137 | 12.0 | ||||||||||||
Neuromodulation | 420 | 409 | 2.7 | (14) | 434 | 6.1 | 1,244 | 1,285 | (3.2) | (46) | 1,290 | 0.4 | ||||||||||||
Diabetes | 570 | 584 | (2.4) | (33) | 603 | 3.3 | 1,667 | 1,741 | (4.3) | (113) | 1,780 | 2.2 | ||||||||||||
TOTAL | $ 7,727 | $ 7,763 | (0.5) % | $ (379) | $ 8,106 | 4.4 % | $ 22,682 | $ 23,597 | (3.9) % | $ (1,187) | $ 23,869 | 1.2 % | ||||||||||||
(1) The data in this schedule has been intentionally rounded to the nearest million and, therefore, may not sum. |
(2) The currency impact to revenue measures the change in revenue between current and prior year periods using constant exchange rates. |
(3) The three and nine months ended |
THIRD QUARTER | THIRD QUARTER YEAR-TO-DATE | |||||||||||
REPORTED | REPORTED | |||||||||||
(in millions) | FY23 | FY22 | Growth(3) | FY23 | FY22 | Growth(3) | ||||||
Cardiovascular | $ 1,375 | $ 1,297 | 6.0 % | $ 4,097 | $ 4,090 | 0.2 % | ||||||
Cardiac Rhythm & Heart Failure | 764 | 708 | 7.9 | 2,271 | 2,238 | 1.5 | ||||||
Structural Heart & Aortic | 337 | 312 | 8.0 | 997 | 986 | 1.1 | ||||||
Coronary & Peripheral Vascular | 274 | 278 | (1.4) | 829 | 866 | (4.3) | ||||||
Medical Surgical | 965 | 990 | (2.5) | 2,713 | 2,950 | (8.0) | ||||||
Surgical Innovations | 600 | 609 | (1.5) | 1,669 | 1,779 | (6.2) | ||||||
Respiratory, Gastrointestinal, & Renal | 365 | 381 | (4.2) | 1,044 | 1,171 | (10.8) | ||||||
Neuroscience | 1,507 | 1,397 | 7.9 | 4,437 | 4,237 | 4.7 | ||||||
Cranial & Spinal Technologies | 824 | 784 | 5.1 | 2,404 | 2,328 | 3.3 | ||||||
Specialty Therapies | 402 | 343 | 17.2 | 1,186 | 1,057 | 12.2 | ||||||
Neuromodulation | 281 | 270 | 4.1 | 848 | 852 | (0.5) | ||||||
Diabetes | 215 | 255 | (15.7) | 650 | 760 | (14.5) | ||||||
TOTAL | $ 4,062 | $ 3,939 | 3.1 % | $ 11,897 | $ 12,038 | (1.2) % | ||||||
(1) |
(2) The data in this schedule has been intentionally rounded to the nearest million and, therefore, may not sum. |
(3) The three and nine months ended |
WORLD WIDE REVENUE: GEOGRAPHIC (1)(2) (Unaudited) | ||||||||||||||||||||||||
THIRD QUARTER | THIRD QUARTER YEAR-TO-DATE | |||||||||||||||||||||||
REPORTED | CONSTANT | REPORTED | CONSTANT | |||||||||||||||||||||
(in millions) | FY23 | FY22 | Growth | Currency | FY23 | Growth(4) | FY23 | FY22 | Growth | Currency | FY23 | Growth(4) | ||||||||||||
$ 1,375 | $ 1,297 | 6.0 % | $ — | $ 1,375 | 6.0 % | $ 4,097 | $ 4,090 | 0.2 % | $ — | $ 4,097 | 0.2 % | |||||||||||||
Non- | 859 | 935 | (8.1) | (110) | 969 | 3.6 | 2,553 | 2,886 | (11.5) | (380) | 2,933 | 1.6 | ||||||||||||
Emerging Markets | 538 | 513 | 4.9 | (42) | 580 | 13.1 | 1,607 | 1,486 | 8.1 | (86) | 1,693 | 13.9 | ||||||||||||
Cardiovascular | 2,772 | 2,745 | 1.0 | (152) | 2,924 | 6.5 | 8,257 | 8,462 | (2.4) | (467) | 8,724 | 3.1 | ||||||||||||
965 | 990 | (2.5) | — | 965 | (2.5) | 2,713 | 2,950 | (8.0) | — | 2,713 | (8.0) | |||||||||||||
Non- | 760 | 812 | (6.4) | (97) | 857 | 5.5 | 2,246 | 2,521 | (10.9) | (330) | 2,576 | 2.2 | ||||||||||||
Emerging Markets | 412 | 488 | (15.6) | (19) | 431 | (11.7) | 1,250 | 1,439 | (13.1) | (49) | 1,299 | (9.7) | ||||||||||||
Medical Surgical | 2,137 | 2,290 | (6.7) | (117) | 2,254 | (1.6) | 6,208 | 6,910 | (10.2) | (380) | 6,588 | (4.7) | ||||||||||||
1,507 | 1,397 | 7.9 | — | 1,507 | 7.9 | 4,437 | 4,237 | 4.7 | — | 4,437 | 4.7 | |||||||||||||
Non- | 401 | 431 | (7.0) | (52) | 453 | 5.1 | 1,189 | 1,330 | (10.6) | (178) | 1,367 | 2.8 | ||||||||||||
Emerging Markets | 341 | 316 | 7.9 | (25) | 366 | 15.8 | 923 | 918 | 0.5 | (49) | 972 | 5.9 | ||||||||||||
Neuroscience | 2,248 | 2,144 | 4.9 | (78) | 2,326 | 8.5 | 6,549 | 6,484 | 1.0 | (227) | 6,776 | 4.5 | ||||||||||||
215 | 255 | (15.7) | — | 215 | (15.7) | 650 | 760 | (14.5) | — | 650 | (14.5) | |||||||||||||
Non- | 274 | 261 | 5.0 | (31) | 305 | 16.9 | 792 | 780 | 1.5 | (107) | 899 | 15.3 | ||||||||||||
Emerging Markets | 80 | 68 | 17.6 | (2) | 82 | 20.6 | 226 | 201 | 12.4 | (6) | 232 | 15.4 | ||||||||||||
Diabetes | 570 | 584 | (2.4) | (33) | 603 | 3.3 | 1,667 | 1,741 | (4.3) | (113) | 1,780 | 2.2 | ||||||||||||
4,062 | 3,939 | 3.1 | — | 4,062 | 3.1 | 11,897 | 12,038 | (1.2) | — | 11,897 | (1.2) | |||||||||||||
Non- | 2,294 | 2,438 | (5.9) | (290) | 2,584 | 6.0 | 6,779 | 7,517 | (9.8) | (995) | 7,774 | 3.4 | ||||||||||||
Emerging Markets | 1,371 | 1,385 | (1.0) | (89) | 1,460 | 5.4 | 4,006 | 4,043 | (0.9) | (190) | 4,196 | 3.8 | ||||||||||||
TOTAL | $ 7,727 | $ 7,763 | (0.5) % | $ (379) | $ 8,106 | 4.4 % | $ 22,682 | $ 23,597 | (3.9) % | $ (1,187) | $ 23,869 | 1.2 % | ||||||||||||
(1) |
(2) The data in this schedule has been intentionally rounded to the nearest million and, therefore, may not sum. |
(3) The currency impact to revenue measures the change in revenue between current and prior year periods using constant exchange rates. |
(4) The three and nine months ended |
CONSOLIDATED STATEMENTS OF INCOME (Unaudited) | |||||||
Three months ended | Nine months ended | ||||||
(in millions, except per share data) |
|
|
|
| |||
Net sales | $ 7,727 | $ 7,763 | $ 22,682 | $ 23,597 | |||
Costs and expenses: | |||||||
Cost of products sold, excluding amortization of intangible assets | 2,689 | 2,459 | 7,740 | 7,554 | |||
Research and development expense | 688 | 668 | 2,055 | 2,094 | |||
Selling, general, and administrative expense | 2,615 | 2,561 | 7,799 | 7,723 | |||
Amortization of intangible assets | 431 | 432 | 1,275 | 1,298 | |||
Restructuring charges, net | 38 | 12 | 81 | 32 | |||
Certain litigation charges, net | — | 35 | — | 95 | |||
Other operating (income) expense, net | (125) | (63) | (187) | 719 | |||
Operating profit | 1,392 | 1,659 | 3,920 | 4,081 | |||
Other non-operating income, net | (149) | (67) | (342) | (244) | |||
Interest expense, net | 167 | 137 | 449 | 410 | |||
Income before income taxes | 1,375 | 1,589 | 3,813 | 3,915 | |||
Income tax provision | 146 | 106 | 1,218 | 346 | |||
Net income | 1,229 | 1,483 | 2,595 | 3,570 | |||
Net income attributable to noncontrolling interests | (6) | (4) | (17) | (16) | |||
Net income attributable to Medtronic | $ 1,222 | $ 1,480 | $ 2,579 | $ 3,554 | |||
Basic earnings per share | $ 0.92 | $ 1.10 | $ 1.94 | $ 2.64 | |||
Diluted earnings per share | $ 0.92 | $ 1.10 | $ 1.94 | $ 2.63 | |||
Basic weighted average shares outstanding | 1,330.2 | 1,343.7 | 1,329.6 | 1,344.4 | |||
Diluted weighted average shares outstanding | 1,332.0 | 1,350.3 | 1,332.8 | 1,353.9 | |||
The data in this schedule has been intentionally rounded to the nearest million, and, therefore, may not sum. | |||||||
GAAP TO NON-GAAP RECONCILIATIONS(1) (Unaudited) | |||||||||||||||||
Three months ended | |||||||||||||||||
(in millions, except per share data) | Net | Cost of | Gross | Operating | Operating | Income | Net Income | Diluted EPS | Effective | ||||||||
GAAP | $ 7,727 | $ 2,689 | 65.2 % | $ 1,392 | 18.0 % | $ 1,375 | $ 1,222 | $ 0.92 | 10.6 % | ||||||||
Non-GAAP Adjustments: | |||||||||||||||||
Restructuring and associated costs (2) | — | (26) | 0.3 | 104 | 1.3 | 104 | 83 | 0.06 | 20.2 | ||||||||
Acquisition-related items (3) | — | (7) | 0.1 | 24 | 0.3 | 24 | 20 | 0.02 | 16.7 | ||||||||
(Gain)/loss on minority investments (4) | — | — | — | — | — | (8) | (8) | (0.01) | — | ||||||||
Medical device regulations (5) | — | (23) | 0.3 | 37 | 0.5 | 37 | 31 | 0.02 | 18.9 | ||||||||
Amortization of intangible assets | — | — | — | 431 | 5.6 | 431 | 367 | 0.28 | 15.1 | ||||||||
RCS impairments / costs (6) | — | (2) | — | 10 | 0.1 | 10 | 9 | 0.01 | 10.0 | ||||||||
Certain tax adjustments, net | — | — | — | — | — | — | 3 | — | — | ||||||||
Non-GAAP | $ 7,727 | $ 2,630 | 66.0 % | $ 1,998 | 25.9 % | $ 1,973 | $ 1,727 | $ 1.30 | 12.1 % | ||||||||
Currency impact | 379 | 55 | 0.9 | 129 | 0.3 | 0.08 | |||||||||||
Currency Adjusted | $ 8,106 | $ 2,685 | 66.9 % | $ 2,127 | 26.2 % | $ 1.38 | |||||||||||
Three months ended | |||||||||||||||||
(in millions, except per share data) | Net | Cost of | Gross | Operating | Operating | Income | Net Income | Diluted EPS | Effective | ||||||||
GAAP | $ 7,763 | $ 2,459 | 68.3 % | $ 1,659 | 21.4 % | $ 1,589 | $ 1,480 | $ 1.10 | 6.7 % | ||||||||
Non-GAAP Adjustments: | |||||||||||||||||
Restructuring and associated costs (2) | — | (27) | 0.3 | 78 | 1.0 | 78 | 63 | 0.05 | 19.2 | ||||||||
Acquisition-related items (3) | — | (4) | 0.1 | (60) | (0.8) | (60) | (61) | (0.04) | — | ||||||||
Certain litigation charges | — | — | — | 35 | 0.5 | 35 | 27 | 0.02 | 25.7 | ||||||||
(Gain)/loss on minority investments (4) | — | — | — | — | — | 2 | 3 | — | (50.0) | ||||||||
Medical device regulations (5) | — | (13) | 0.2 | 25 | 0.3 | 25 | 20 | 0.01 | 20.0 | ||||||||
Amortization of intangible assets | — | — | — | 432 | 5.6 | 432 | 365 | 0.27 | 15.5 | ||||||||
Certain tax adjustments, net (7) | — | — | — | — | — | — | (59) | (0.04) | — | ||||||||
Non-GAAP | $ 7,763 | $ 2,415 | 68.9 % | $ 2,170 | 28.0 % | $ 2,101 | $ 1,838 | $ 1.36 | 12.4 % | ||||||||
See description of non-GAAP financial measures contained in the press release dated | |
(1) | The data in this schedule has been intentionally rounded to the nearest million or |
(2) | Associated costs include costs incurred as a direct result of the restructuring program, such as salaries for employees supporting the program and consulting expenses. |
(3) | The charges primarily include business combination costs and changes in fair value of contingent consideration. |
(4) | We exclude unrealized and realized gains and losses on our minority investments as we do not believe that these components of income or expense have a direct correlation to our ongoing or future business operations. |
(5) | The charges represent incremental costs of complying with the new |
(6) | Associated costs as a result of the anticipated sale of half of the Company's Renal Care Solutions (RCS) business related to the |
(7) | The tax benefit primarily relates to the deferred tax impact associated with a step up in tax basis for Swiss Cantonal purposes which is partially offset by the amortization on previously established deferred tax assets from intercompany intellectual property transactions. |
GAAP TO NON-GAAP RECONCILIATIONS(1) (Unaudited) | |||||||||||||||||
Nine months ended | |||||||||||||||||
(in millions, except per share data) | Cost of | Gross | Operating | Operating | Income | Net Income | Diluted EPS | Effective | |||||||||
GAAP | $ 7,740 | 65.9 % | $ 3,920 | 17.3 % | $ 3,813 | $ 2,579 | $ 1.94 | 31.9 % | |||||||||
Non-GAAP Adjustments: | |||||||||||||||||
Restructuring and associated costs (2) | — | (67) | 0.3 | 275 | 1.2 | 275 | 219 | 0.16 | 20.0 | ||||||||
Acquisition-related items (3) | — | (30) | 0.1 | 61 | 0.3 | 61 | 43 | 0.03 | 29.5 | ||||||||
(Gain)/loss on minority investments (4) | — | — | — | — | — | (23) | (23) | (0.02) | — | ||||||||
Medical device regulations (5) | — | (62) | 0.3 | 107 | 0.5 | 107 | 87 | 0.07 | 18.7 | ||||||||
Amortization of intangible assets | — | — | — | 1,275 | 5.6 | 1,275 | 1,082 | 0.81 | 15.2 | ||||||||
RCS impairments / costs (6) | — | (2) | — | 109 | 0.5 | 109 | 106 | 0.08 | 2.8 | ||||||||
Debt redemption premium and other charges (7) | — | — | — | — | — | 53 | 42 | 0.03 | 20.8 | ||||||||
Exit of business (8) | — | (27) | 0.1 | 37 | 0.2 | 37 | 37 | 0.03 | — | ||||||||
Certain tax adjustments, net (9) | — | — | — | — | — | — | 783 | 0.59 | — | ||||||||
Non-GAAP | $ 7,551 | 66.7 % | $ 5,783 | 25.5 % | $ 5,706 | $ 4,953 | $ 3.72 | 12.9 % | |||||||||
Currency impact | 1,187 | 287 | 0.5 | 199 | (0.4) | 0.12 | |||||||||||
Currency Adjusted | $ 7,838 | 67.2 % | $ 5,982 | 25.1 % | $ 3.84 | ||||||||||||
Nine months ended | |||||||||||||||||
(in millions, except per share data) | Cost of | Gross | Operating | Operating | Income | Net Income | Diluted EPS | Effective | |||||||||
GAAP | $ 7,554 | 68.0 % | $ 4,081 | 17.3 % | $ 3,915 | $ 3,554 | $ 2.63 | 8.8 % | |||||||||
Non-GAAP Adjustments: | |||||||||||||||||
Restructuring and associated costs (2) | — | (91) | 0.4 | 237 | 1.0 | 237 | 191 | 0.14 | 19.4 | ||||||||
Acquisition-related items (3) | — | (14) | 0.1 | (54) | (0.2) | (54) | (57) | (0.04) | (5.6) | ||||||||
Certain litigation charges | — | — | — | 95 | 0.4 | 95 | 78 | 0.06 | 17.9 | ||||||||
(Gain)/loss on minority investments (4) | — | — | — | — | — | (23) | (19) | (0.01) | 4.3 | ||||||||
Medical device regulations (5) | — | (39) | 0.2 | 70 | 0.3 | 70 | 56 | 0.04 | 20.0 | ||||||||
Amortization of intangible assets | — | — | — | 1,298 | 5.5 | 1,298 | 1,093 | 0.81 | 15.8 | ||||||||
MCS impairments / costs (10) | — | (58) | 0.3 | 726 | 3.1 | 726 | 564 | 0.42 | 22.3 | ||||||||
Certain tax adjustments, net (11) | — | — | — | — | — | — | 10 | 0.01 | — | ||||||||
Non-GAAP (1) | $ 7,353 | 68.8 % | $ 6,453 | 27.3 % | $ 6,264 | $ 5,470 | $ 4.04 | 12.5 % | |||||||||
See description of non-GAAP financial measures contained in the press release dated | |
(1) | The data in this schedule has been intentionally rounded to the nearest million or |
(2) | Associated costs include costs incurred as a direct result of the restructuring program, such as salaries for employees supporting the program and consulting expenses. |
(3) | The charges primarily include business combination costs and changes in fair value of contingent consideration. |
(4) | We exclude unrealized and realized gains and losses on our minority investments as we do not believe that these components of income or expense have a direct correlation to our ongoing or future business operations. |
(5) | The charges represent incremental costs of complying with the new |
(6) | The charges predominantly include non-cash pre-tax impairments, primarily related to goodwill, and other associated costs, as a result of the anticipated sale of half of the Company's Renal Care Solutions (RCS) business related to the |
(7) | The charges relate to the early redemption of approximately |
(8) | The charges relate to the exit of a business and are primarily comprised of inventory write-downs. |
(9) | The charge primarily relates to a |
(10) | The charges relate to the Company's |
(11) | The charge primarily relates to the amortization on previously established deferred tax assets from intercompany intellectual property transactions and a charge related to a change in the Company's permanent reinvestment assertion on certain historical earnings, which are partially offset by the deferred tax impact associated with a step up in tax basis for Swiss Cantonal purposes. |
GAAP TO NON-GAAP RECONCILIATIONS(1) (Unaudited) | |||||||||||||||
Three months ended | |||||||||||||||
(in millions) | SG&A | SG&A | R&D | R&D | Other | Other | Other Non- Operating | ||||||||
GAAP | $ 7,727 | $ 2,615 | 33.8 % | $ 688 | 8.9 % | $ (125) | (1.6) % | $ (149) | |||||||
Non-GAAP Adjustments: | |||||||||||||||
Restructuring and associated costs (2) | — | (40) | (0.5) | — | — | — | — | — | |||||||
Acquisition-related items (3) | — | (8) | (0.1) | — | — | (8) | (0.1) | — | |||||||
Medical device regulations (4) | — | (1) | — | (14) | (0.2) | — | — | — | |||||||
RCS impairments / costs (5) | — | (8) | (0.1) | — | — | — | — | — | |||||||
Gain/(loss) on minority investments (6) | — | — | — | — | — | — | — | 8 | |||||||
Non-GAAP | $ 7,727 | $ 2,558 | 33.1 % | $ 673 | 8.7 % | $ (133) | (1.7) % | $ (142) | |||||||
Currency impact | 379 | 94 | (0.4) | 10 | (0.3) | 91 | 1.2 | (5) | |||||||
Currency Adjusted | $ 8,106 | $ 2,652 | 32.7 % | $ 683 | 8.4 % | $ (42) | (0.5) % | $ (147) | |||||||
Nine months ended | |||||||||||||||
(in millions) | SG&A | SG&A | R&D | R&D | Other | Other | Other Non- | ||||||||
GAAP | $ 22,682 | $ 7,799 | 34.4 % | $ 2,055 | 9.1 % | $ (187) | (0.8) % | $ (342) | |||||||
Non-GAAP Adjustments: | |||||||||||||||
Restructuring and associated costs (2) | — | (125) | (0.6) | (2) | — | — | — | — | |||||||
Acquisition-related items (3) | — | (8) | — | — | — | (23) | (0.1) | — | |||||||
Medical device regulations (4) | — | (2) | — | (43) | (0.2) | — | — | — | |||||||
RCS impairments / costs (5) | — | (24) | (0.1) | — | — | (82) | (0.4) | — | |||||||
Gain/(loss) on minority investments (6) | — | — | — | — | — | — | — | 23 | |||||||
Exit of business (7) | — | — | — | — | — | (10) | — | — | |||||||
Non-GAAP | $ 22,682 | $ 7,640 | 33.7 % | $ 2,010 | 8.9 % | $ (302) | (1.3) % | $ (319) | |||||||
Currency impact | 1,187 | 321 | (0.3) | 32 | (0.3) | 347 | 1.5 | (11) | |||||||
Currency Adjusted | $ 23,869 | $ 7,961 | 33.4 % | $ 2,042 | 8.6 % | $ 45 | 0.2 % | $ (330) | |||||||
See description of non-GAAP financial measures contained in the press release dated | |
(1) | The data in this schedule has been intentionally rounded to the nearest million, and, therefore, may not sum. |
(2) | Associated costs include costs incurred as a direct result of the restructuring program, such as salaries for employees supporting the program and consulting expenses. |
(3) | The charges primarily include business combination costs and changes in fair value of contingent consideration. |
(4) | The charges represent incremental costs of complying with the new |
(5) | The charges predominantly include non-cash pre-tax impairments, primarily related to goodwill, and other associated costs, as a result of the anticipated sale of half of the Company's Renal Care Solutions (RCS) business related to the |
(6) | We exclude unrealized and realized gains and losses on our minority investments as we do not believe that these components of income or expense have a direct correlation to our ongoing or future business operations. |
(7) | Associated costs related to the exit of a business. |
GAAP TO NON-GAAP RECONCILIATIONS(1) (Unaudited) | |||||
Nine months ended | Nine months ended | ||||
(in millions) | |||||
Net cash provided by operating activities | $ 3,579 | $ 5,289 | |||
Additions to property, plant, and equipment | (1,081) | (979) | |||
Free Cash Flow (2) | $ 2,498 | $ 4,310 | |||
See description of non-GAAP financial measures contained in the press release dated | |
(1) | The data in this schedule has been intentionally rounded to the nearest million, and, therefore, may not sum. |
(2) | Free cash flow represents operating cash flows less property, plant, and equipment additions. |
CONSOLIDATED BALANCE SHEETS (Unaudited) | ||||
(in millions) | ||||
ASSETS | ||||
Current assets: | ||||
Cash and cash equivalents | $ 4,521 | $ 3,714 | ||
Investments | 6,616 | 6,859 | ||
Accounts receivable, less allowances and credit losses of | 5,887 | 5,551 | ||
Inventories, net | 5,375 | 4,616 | ||
Other current assets | 2,965 | 2,318 | ||
Total current assets | 25,364 | 23,059 | ||
Property, plant, and equipment | 13,926 | 13,365 | ||
Accumulated depreciation | (8,489) | (7,952) | ||
Property, plant, and equipment, net | 5,437 | 5,413 | ||
41,565 | 40,502 | |||
Other intangible assets, net | 15,265 | 15,595 | ||
Tax assets | 3,361 | 3,403 | ||
Other assets | 3,142 | 3,008 | ||
Total assets | $ 94,134 | $ 90,981 | ||
LIABILITIES AND EQUITY | ||||
Current liabilities: | ||||
Current debt obligations | $ 5,918 | $ 3,742 | ||
Accounts payable | 2,209 | 2,276 | ||
Accrued compensation | 2,007 | 2,121 | ||
Accrued income taxes | 657 | 704 | ||
Other accrued expenses | 3,630 | 3,551 | ||
Total current liabilities | 14,422 | 12,394 | ||
Long-term debt | 22,210 | 20,372 | ||
Accrued compensation and retirement benefits | 1,103 | 1,113 | ||
Accrued income taxes | 2,305 | 2,087 | ||
Deferred tax liabilities | 747 | 884 | ||
Other liabilities | 1,730 | 1,410 | ||
Total liabilities | 42,516 | 38,260 | ||
Commitments and contingencies | ||||
Shareholders' equity: | ||||
Ordinary shares— par value | — | — | ||
Additional paid-in capital | 24,513 | 24,566 | ||
Retained earnings | 30,117 | 30,250 | ||
Accumulated other comprehensive loss | (3,189) | (2,265) | ||
Total shareholders' equity | 51,441 | 52,551 | ||
Noncontrolling interests | 177 | 171 | ||
Total equity | 51,618 | 52,722 | ||
Total liabilities and equity | $ 94,134 | $ 90,981 | ||
The data in this schedule has been intentionally rounded to the nearest million, and, therefore, may not sum. | ||||
CONSOLIDATED STATEMENTS OF CASH FLOWS (Unaudited) | ||||
Nine months ended | ||||
(in millions) | ||||
Operating Activities: | ||||
Net income | $ 2,595 | $ 3,570 | ||
Adjustments to reconcile net income to net cash provided by operating activities: | ||||
Depreciation and amortization | 2,018 | 2,019 | ||
Provision for credit losses | 54 | 49 | ||
Deferred income taxes | (78) | (234) | ||
Stock-based compensation | 280 | 287 | ||
Loss on debt extinguishment | 53 | — | ||
MCS asset impairment and inventory write-down | — | 515 | ||
Other, net | 182 | 92 | ||
Change in operating assets and liabilities, net of acquisitions and divestitures: | ||||
Accounts receivable, net | (408) | (212) | ||
Inventories, net | (936) | (359) | ||
Accounts payable and accrued liabilities | 163 | 6 | ||
Other operating assets and liabilities | (344) | (444) | ||
Net cash provided by operating activities | 3,579 | 5,289 | ||
Investing Activities: | ||||
Acquisitions, net of cash acquired | (1,867) | (91) | ||
Additions to property, plant, and equipment | (1,081) | (979) | ||
Purchases of investments | (5,472) | (7,919) | ||
Sales and maturities of investments | 5,387 | 7,130 | ||
Other investing activities, net | 15 | (71) | ||
Net cash used in investing activities | (3,018) | (1,930) | ||
Financing Activities: | ||||
Change in current debt obligations, net | 625 | — | ||
Proceeds from short-term borrowings (maturities greater than 90 days) | 2,284 | — | ||
Issuance of long-term debt | 3,430 | — | ||
Payments on long-term debt | (3,083) | (1) | ||
Dividends to shareholders | (2,711) | (2,540) | ||
Issuance of ordinary shares | 209 | 344 | ||
Repurchase of ordinary shares | (548) | (1,138) | ||
Other financing activities | (276) | (52) | ||
Net cash used in financing activities | (70) | (3,387) | ||
Effect of exchange rate changes on cash and cash equivalents | 317 | (87) | ||
Net change in cash and cash equivalents | 808 | (114) | ||
Cash and cash equivalents at beginning of period | 3,714 | 3,593 | ||
Cash and cash equivalents at end of period | $ 4,521 | $ 3,479 | ||
Supplemental Cash Flow Information | ||||
Cash paid for: | ||||
Income taxes | $ 1,314 | $ 842 | ||
Interest | 262 | 295 | ||
The data in this schedule has been intentionally rounded to the nearest million, and, therefore, may not sum. | ||||
About Medtronic
Bold thinking. Bolder actions. We are Medtronic.
FORWARD LOOKING STATEMENTS
This press release contains forward-looking statements within the meaning of the Private Securities Litigation Reform Act of 1995, which are subject to risks and uncertainties, including risks related to competitive factors, difficulties and delays inherent in the development, manufacturing, marketing and sale of medical products, government regulation and general economic conditions and other risks and uncertainties described in the company's periodic reports on file with the
NON-GAAP FINANCIAL MEASURES
This press release contains financial measures, including adjusted net income, adjusted diluted EPS, and organic revenue, which are considered "non-GAAP" financial measures under applicable
Medtronic management believes that non-GAAP financial measures provide information useful to investors in understanding the company's underlying operational performance and trends and to facilitate comparisons with the performance of other companies in the med tech industry. Non-GAAP net income and diluted EPS exclude the effect of certain charges or gains that contribute to or reduce earnings but that result from transactions or events that management believes may or may not recur with similar materiality or impact to operations in future periods (Non-GAAP Adjustments). Medtronic generally uses non-GAAP financial measures to facilitate management's review of the operational performance of the company and as a basis for strategic planning. Non-GAAP financial measures should be considered supplemental to and not a substitute for financial information prepared in accordance with
Medtronic calculates forward-looking non-GAAP financial measures based on internal forecasts that omit certain amounts that would be included in GAAP financial measures. For instance, forward-looking organic revenue growth guidance excludes the impact of foreign currency fluctuations, as well as significant acquisitions or divestitures. Forward-looking diluted non-GAAP EPS guidance also excludes other potential charges or gains that would be recorded as Non-GAAP Adjustments to earnings during the fiscal year. Medtronic does not attempt to provide reconciliations of forward-looking non-GAAP EPS guidance to projected GAAP EPS guidance because the combined impact and timing of recognition of these potential charges or gains is inherently uncertain and difficult to predict and is unavailable without unreasonable efforts. In addition, the company believes such reconciliations would imply a degree of precision and certainty that could be confusing to investors. Such items could have a substantial impact on GAAP measures of financial performance.
Contacts: | |
Public Relations | Investor Relations |
+1-763-526-8478 | +1-763-505-4626 |

![]()
![]() View original content to download multimedia:https://www.prnewswire.com/news-releases/medtronic-reports-third-quarter-fiscal-2023-financial-results-301751333.html
View original content to download multimedia:https://www.prnewswire.com/news-releases/medtronic-reports-third-quarter-fiscal-2023-financial-results-301751333.html
SOURCE