Sierra Metals Reports Q4 and Full Year 2022 Production Results, Reflecting Improved Performance at Its Bolivar Mine
(All metal prices reported in USD)
-
Bolivar’s improved operating performance resulted in a
69% and130% increase in copper equivalent production over Q3 2022 and Q4 2021, respectively. - A measured and progressive approach to reach full operating capacity at Yauricocha continues, following the mudslide in Q3 2022.
-
Consolidated 2022 copper equivalent production decreased
29% compared to 2021 due to lower production at Yauricocha resulting from the suspension of mining operations and lower grades across all metals, except for gold.
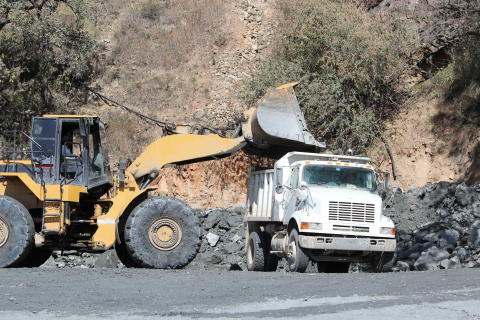
Truck being loaded at Bolivar Rom Pad headed to Concentrate Plant (Photo: Business Wire)
At Bolivar, progress in reducing the significant backlog in drilling and mine development that arose during the pandemic was delayed throughout the first half of the year, due to setbacks encountered during the installation of critical infrastructure. These delays were compounded in Q3 by unexpected flooding, negatively affecting production during most of the quarter. However, the Company achieved meaningfully improved performance during Q4 due to infrastructure upgrades in pumping and ventilation, which created improved conditions required to support the advancement of the mine’s preparation and development. A
Consolidated Production Results
| Consolidated Production | Year Ended |
|||||||
| Q4 2022 | Q3 2022 | % Var. | Q4 2021 | % Var. | 2022 |
2021 |
% Var. |
|
| Tonnes processed (t) | 494,980 |
561,906 |
- |
590,057 |
- |
2,287,797 |
2,902,220 |
- |
| Daily throughput | 5,657 |
6,422 |
- |
6,743 |
- |
6,537 |
8,292 |
- |
| Silver production (000 oz) | 570 |
669 |
- |
805 |
- |
2,581 |
3,527 |
- |
| Copper production (000 lb) | 6,170 |
6,299 |
- |
6,071 |
|
27,127 |
31,757 |
- |
| Lead production (000 lb) | 2,071 |
3,878 |
- |
6,011 |
- |
13,498 |
30,816 |
- |
| Zinc production (000 lb) | 6,367 |
10,815 |
- |
14,913 |
- |
38,100 |
79,281 |
- |
| Gold Production (oz) | 3,411 |
2,199 |
|
1,863 |
|
10,155 |
9,572 |
|
| Copper equivalent |
14,073 |
16,637 |
- |
17,841 |
- |
64,218 |
89,926 |
- |
(1) Copper equivalent pounds were calculated using the following realized prices: |
||||||||
| Q4 2022 - |
||||||||
Q3 2022 - |
||||||||
| Q4 2021 - |
||||||||
FY 2022 - |
||||||||
FY 2021 - |
||||||||
Consolidated quarterly throughput during Q4 2022 was 494,980 tonnes, a decrease of
While a
When comparing 2022 to 2021, a
Throughput from the
When compared to Q4 2021, a
The discovery of the higher-grade Fortuna zone during Q2 2022 was expected to help alleviate the challenges presented by regulatory requirements, which currently limit mineable areas at Yauricocha. However, plans to reap the full benefits of the new zone were delayed, due to the tragic mudslide in
Production of all metals declined when compared to full year 2021. While copper grades increased by
A summary of production from the
| Yauricocha Production | Year Ended |
|||||||
Q4 2022 |
Q3 2022 |
% Var. |
Q4 2021 |
% Var. |
2022 |
2021 |
% Var. |
|
| Tonnes processed (t) | 152,586 |
269,057 |
- |
277,531 |
- |
1,053,980 |
1,256,847 |
- |
| Daily throughput | 1,744 |
3,075 |
- |
3,172 |
- |
3,011 |
3,591 |
- |
| Silver grade (g/t) | 42.25 |
47.61 |
- |
51.34 |
- |
43.49 |
55.01 |
- |
| Copper grade |
|
|
- |
|
- |
|
|
|
| Lead grade |
|
|
- |
|
- |
|
|
- |
| Zinc grade |
|
|
|
|
- |
|
|
- |
| Gold Grade (g/t) | 0.41 |
0.41 |
|
0.53 |
- |
0.48 |
0.48 |
|
| Silver recovery |
|
|
|
|
- |
|
|
- |
| Copper recovery |
|
|
- |
|
- |
|
|
|
| Lead recovery |
|
|
- |
|
- |
|
|
- |
| Zinc recovery |
|
|
|
|
- |
|
|
- |
| Gold Recovery |
|
|
|
|
|
|
|
|
| Silver production (000 oz) | 134 |
256 |
- |
331 |
- |
913 |
1,716 |
- |
| Copper production (000 lb) | 1,621 |
3,514 |
- |
3,836 |
- |
14,541 |
14,856 |
- |
| Lead production (000 lb) | 1,749 |
3,579 |
- |
5,430 |
- |
12,216 |
29,113 |
- |
| Zinc production (000 lb) | 6,367 |
10,815 |
- |
14,913 |
- |
38,100 |
79,281 |
- |
| Gold Production (oz) | 439 |
743 |
- |
957 |
- |
3,418 |
4,059 |
- |
| Copper equivalent |
5,471 |
10,794 |
- |
12,567 |
- |
39,185 |
59,470 |
- |
| (1) Copper equivalent pounds were calculated using the following realized prices: | ||||||||
Q4 2022 - |
||||||||
Q3 2022 - |
||||||||
Q4 2021 - |
||||||||
FY 2022 - |
||||||||
FY 2021 - |
||||||||
Annual throughput at Bolivar was 941,910 tonnes, representing a
A summary of production for the
| Bolivar Production | Year Ended |
|||||||
| Q4 2022 | Q3 2022 | % Var. | Q4 2021 | % Var. | 2022 |
2021 |
% Var. |
|
| Tonnes processed (t) | 270,313 |
227,669 |
|
227,722 |
|
941,910 |
1,349,602 |
- |
| Daily throughput | 3,089 |
2,602 |
|
2,603 |
|
2,691 |
3,856 |
- |
| Copper grade |
|
|
|
|
|
|
|
- |
| Silver grade (g/t) | 13.25 |
12.14 |
|
9.52 |
|
12.29 |
15.49 |
- |
| Gold grade (g/t) | 0.50 |
0.27 |
|
0.11 |
|
0.30 |
0.16 |
|
| Copper recovery |
|
|
|
|
|
|
|
|
| Silver recovery |
|
|
|
|
- |
|
|
|
| Gold recovery |
|
|
|
|
- |
|
|
- |
| Copper production (000 lb) | 4,549 |
2,785 |
|
2,235 |
|
12,586 |
16,901 |
- |
| Silver production (000 oz) | 93 |
71 |
|
57 |
|
305 |
551 |
- |
| Gold production (oz) | 2,801 |
1,267 |
|
634 |
|
5,943 |
4,751 |
|
| Copper equivalent |
6,432 |
3,799 |
|
2,800 |
|
16,931 |
22,207 |
- |
| (1) Copper equivalent pounds were calculated using the following realized prices: | ||||||||
Q4 2022 - |
||||||||
Q3 2022 - |
||||||||
Q4 2021 - |
||||||||
FY 2022 - |
||||||||
FY 2021 - |
||||||||
When compared to Q4 2021, a
Annual throughput at
A summary of production for the
| Cusi Production | Year Ended |
|||||||
Q4 2022 |
Q3 2022 |
% Var. |
Q4 2021 |
% Var. |
2022 |
2021 |
% Var. |
|
| Tonnes processed (t) | 72,081 |
65,180 |
|
84,804 |
- |
291,907 |
295,771 |
- |
| Daily throughput | 824 |
745 |
|
969 |
- |
834 |
845 |
- |
| Silver grade (g/t) | 171.34 |
187.44 |
- |
179.07 |
- |
170.01 |
159.74 |
|
| Gold grade (g/t) | 0.17 |
0.19 |
- |
0.21 |
- |
0.18 |
0.18 |
|
| Lead grade |
|
|
- |
|
- |
|
|
- |
| Silver recovery (flotation) |
|
|
- |
|
|
|
|
|
| Gold recovery (lixiviation) |
|
|
- |
|
- |
|
|
|
| Lead recovery |
|
|
|
|
|
|
|
- |
| Silver production (000 oz) | 343 |
342 |
|
417 |
- |
1,363 |
1,260 |
|
| Gold production (oz) | 171 |
189 |
- |
272 |
- |
794 |
762 |
|
| Lead production (000 lb) | 322 |
299 |
|
581 |
- |
1,282 |
1,703 |
- |
| Silver equivalent ounces (000's)(1) | 372 |
374 |
- |
465 |
- |
1,487 |
1,382 |
|
| (1) Silver equivalent ounces were calculated using the following realized prices: | ||||||||
Q4 2022 - |
||||||||
Q3 2022 - |
||||||||
Q4 2021 - |
||||||||
FY 2022 - |
||||||||
FY 2021 - |
||||||||
Strategic Review Process
The Company announced, on
Quality Control
Américo Zuzunaga, FAusIMM (
About
For further information regarding
Continue to Follow, Like and Watch our progress:
Web: www.sierrametals.com |
Forward-Looking Statements
This press release contains forward-looking information within the meaning of Canadian securities legislation. Forward-looking information relates to future events or the anticipated performance of Sierra and reflect management's expectations or beliefs regarding such future events and anticipated performance based on an assumed set of economic conditions and courses of action. In certain cases, statements that contain forward-looking information can be identified by the use of words such as "plans", "expects", "is expected", "budget", "scheduled", "estimates", "forecasts", "intends", "anticipates", "believes" or variations of such words and phrases or statements that certain actions, events or results "may", "could", "would", "might", or "will be taken", "occur" or "be achieved" or the negative of these words or comparable terminology. By its very nature forward-looking information involves known and unknown risks, uncertainties and other factors that may cause actual performance of Sierra to be materially different from any anticipated performance expressed or implied by such forward-looking information.
Forward-looking information is subject to a variety of risks and uncertainties, which could cause actual events or results to differ from those reflected in the forward-looking information, including, without limitation, the risks described under the heading "Risk Factors" in the Company's annual information form dated
The risk factors referred to above are not an exhaustive list of the factors that may affect any of the Company's forward-looking information. Forward-looking information includes statements about the future and is inherently uncertain, and the Company's actual achievements or other future events or conditions may differ materially from those reflected in the forward-looking information due to a variety of risks, uncertainties and other factors. The Company's statements containing forward-looking information are based on the beliefs, expectations, and opinions of management on the date the statements are made, and the Company does not assume any obligation to update such forward-looking information if circumstances or management's beliefs, expectations or opinions should change, other than as required by applicable law. For the reasons set forth above, one should not place undue reliance on forward-looking information.
View source version on businesswire.com: https://www.businesswire.com/news/home/20230126005881/en/
Investor Relations
Tel: +1 (416) 366-7777
Email: info@sierrametals.com
Source: