
TE Connectivity delivers results above guidance with 15% sales growth and over 20% EPS growth in second quarter of fiscal 2026
TE Connectivity (NYSE: TEL) reported fiscal Q2 results for the quarter ended March 27, 2026, with net sales of $4.74B (+15% reported, +7% organic) and GAAP EPS $2.90.
Sentiment and the balance of points
Rhea-AI Sentiment reads the wording of the document, how positive or negative its language is on a 1 to 5 scale. The balance of points shown with the takes weighs what the document actually discloses, so the two can disagree, for example when a trial that missed its main goal is described in upbeat language.
Rhea-AI Summary
TE Connectivity (NYSE: TEL) reported fiscal Q2 results for the quarter ended March 27, 2026, with net sales of $4.74B (+15% reported, +7% organic) and GAAP EPS $2.90. Adjusted EPS was a record $2.73 (+24% YoY) and adjusted operating margin rose to 22%.
Orders were a record $5.3B (+25% YoY). Free cash flow was $1.3B (+17% YoY). The company returned $1.2B to shareholders and raised its quarterly dividend by 10%.
Positive
- Net sales +15% year-over-year to $4.74 billion
- Adjusted EPS record of $2.73, up 24% year-over-year
- Record orders of $5.3 billion, up 25% year-over-year
- Adjusted operating margin expanded to 22%, +130 bps YoY
- Free cash flow of $1.3 billion, up 17% year-over-year
Negative
- None.
Details
News Market Reaction – TEL
On Apr 22, the day this news came out, TEL closed 9.10% below the previous close.
Data tracked by StockTitan Argus for the Apr 22 session.
Key Figures
- Net sales
- $4.74 billion
- Fiscal Q2 2026; 15% reported growth, 7% organic YoY
- Adjusted EPS
- $2.73
- Fiscal Q2 2026; record level, up 24% YoY
- GAAP operating margin
- 20%
- Fiscal Q2 2026; up 200 basis points YoY
- Adjusted operating margin
- 22%
- Fiscal Q2 2026; expanded 130 basis points YoY
- Orders
- $5.3 billion
- Fiscal Q2 2026; record level, 25% YoY increase
- Free cash flow
- $1.3 billion
- First half FY26; up 17% YoY
- Capital returns
- $1.2 billion
- Returned to shareholders in first half FY26
- Q3 sales outlook
- $5 billion
- Fiscal Q3 2026 guidance; 10% reported, 9% organic YoY growth
Historical Context
-
Announced date and access details for Q2 FY26 earnings release.
-
Settled AEC technology disputes with Credo via license and settlement.
-
Released Industrial Technology Index showing rising AI adoption and ROI focus.
-
Named a World’s Most Ethical Company for 12th consecutive year.
-
Raised quarterly dividend and increased share repurchase authorization.
24h Move is the share-price change in the day after each event; other market factors may also have contributed.
Key Terms
gaap financial
free cash flow financial
basis points financial
non-GAAP financial measures financial
AI-generated analysis. How Rhea-AI works. Not financial advice.




Third quarter guidance reflects double digit sales and EPS growth
GALWAY,
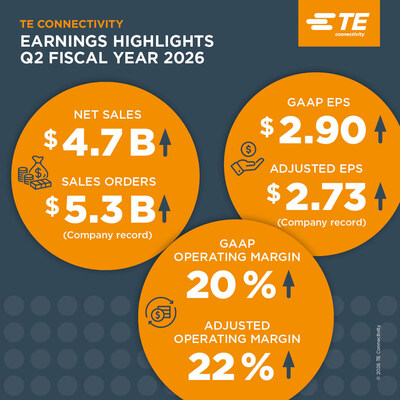
Second Quarter Highlights
- Net sales were
$4.74 billion 15% on a reported basis year over year, driven by growth in both the Industrial and Transportation segments, and7% organically. - GAAP diluted earnings per share (EPS) from continuing operations was
$2.90 $2.73 24% year over year. - GAAP operating margin was
20% , an increase of 200 basis points year over year. Adjusted operating margin expanded 130 basis points year over year to22% , driven by strong operational performance across both segments. - Record orders of
$5.3 billion 25% year over year with double-digit order growth in both segments and growth in all businesses. - Cash flow from operating activities during the first half of the fiscal year was
$1.8 billion $1.3 billion 17% year over year. - Returned
$1.2 billion 10% increase in quarterly cash dividend.
"Our teams delivered another quarter of results above guidance, including double-digit sales growth and record adjusted EPS," said CEO Terrence Curtin. "This performance and our record orders were driven by our strategic positioning in key trends including AI, next generation transportation and electric grid modernization, along with the broadening of growth across our portfolio. We're well positioned to capitalize on the proliferation of data and power to provide our customers with leading interconnect technologies. Our strong margin performance reflects the resilience we've built to mitigate the dynamic environment we continue to operate in around the world.
"Looking ahead to the third quarter, our ongoing orders momentum across all businesses positions us to deliver double digit sales growth to
Third Quarter FY26 Outlook
For the third quarter of fiscal 2026, the company expects sales of approximately
Information about TE Connectivity's use of non-GAAP financial measures is provided below. For reconciliations of these non-GAAP financial measures, see the attached tables.
Conference Call and Webcast
The company will hold a conference call for investors today beginning at 8:30 a.m. ET. The conference call may be accessed in the following ways:
- At TE Connectivity's website: investors.te.com
- By telephone: For both "listen-only" participants and those participants who wish to take part in the question-and-answer portion of the call, the dial-in number in
the United States is (800) 715-9871 and for international callers, the dial-in number is (646) 307-1963. - A replay of the conference call will be available on TE Connectivity's investor website at investors.te.com at 11:30 a.m. ET on April 22.
About TE Connectivity
TE Connectivity plc (NYSE: TEL) is a global industrial technology leader creating a safer, sustainable, productive, and connected future. As a trusted innovation partner, our broad range of connectivity and sensor solutions enable the distribution of power, signal and data to advance next-generation transportation, energy networks, automated factories, data centers enabling artificial intelligence, and more. Our more than 90,000 employees, including 10,000 engineers, work alongside customers in approximately 130 countries. In a world that is racing ahead, TE ensures that EVERY CONNECTION COUNTS. Learn more at www.te.com and on LinkedIn, Facebook, WeChat and Instagram.
Non-GAAP Financial Measures
We present non-GAAP performance and liquidity measures as we believe it is appropriate for investors to consider adjusted financial measures in addition to results in accordance with accounting principles generally accepted in the
The following provides additional information regarding our non-GAAP financial measures:
- Organic Net Sales Growth (Decline) – represents net sales growth (decline) (the most comparable GAAP financial measure) excluding the impact of foreign currency exchange rates, and acquisitions and divestitures that occurred in the preceding twelve months, if any. Organic Net Sales Growth (Decline) is a useful measure of our performance because it excludes items that are not completely under management's control, such as the impact of changes in foreign currency exchange rates, and items that do not reflect the underlying growth of the company, such as acquisition and divestiture activity. This measure is a significant component in our incentive compensation plans.
- Adjusted Operating Income and Adjusted Operating Margin – represent operating income and operating margin, respectively, (the most comparable GAAP financial measures) before special items including restructuring and other charges, acquisition-related charges, amortization expense on intangible assets, impairment of goodwill, and other income or charges, if any. We utilize these adjusted measures in combination with operating income and operating margin to assess segment level operating performance and to provide insight to management in evaluating segment operating plan execution and market conditions. Adjusted Operating Income is a significant component in our incentive compensation plans.
- Adjusted Income Tax (Expense) Benefit and Adjusted Effective Tax Rate – represent income tax (expense) benefit and effective tax rate, respectively, (the most comparable GAAP financial measures) after adjusting for the tax effect of special items including restructuring and other charges, acquisition-related charges, amortization expense on intangible assets, impairment of goodwill, other income or charges, and certain significant tax items, if any.
- Adjusted Income from Continuing Operations – represents income from continuing operations (the most comparable GAAP financial measure) before special items including restructuring and other charges, acquisition-related charges, amortization expense on intangible assets, impairment of goodwill, other income or charges, and certain significant tax items, if any, and, if applicable, the related tax effects.
- Adjusted Earnings Per Share – represents diluted earnings per share from continuing operations (the most comparable GAAP financial measure) before special items including restructuring and other charges, acquisition-related charges, amortization expense on intangible assets, impairment of goodwill, other income or charges, and certain significant tax items, if any, and, if applicable, the related tax effects. This measure is a significant component in our incentive compensation plans.
- Free Cash Flow (FCF) – is a useful measure of our ability to generate cash. The difference between net cash provided by operating activities (the most comparable GAAP financial measure) and Free Cash Flow consists mainly of significant cash outflows and inflows that we believe are useful to identify. We believe Free Cash Flow provides useful information to investors as it provides insight into the primary cash flow metric used by management to monitor and evaluate cash flows generated from our operations. Free Cash Flow is defined as net cash provided by operating activities excluding voluntary pension contributions and the cash impact of special items, if any, minus net capital expenditures. Voluntary pension contributions are excluded from the GAAP financial measure because this activity is driven by economic financing decisions rather than operating activity. Certain special items, including cash paid (collected) pursuant to collateral requirements related to cross-currency swap contracts, are also excluded by management in evaluating Free Cash Flow. Net capital expenditures consist of capital expenditures less proceeds from the sale of property, plant, and equipment. These items are subtracted because they represent long-term commitments. In the calculation of Free Cash Flow, we subtract certain cash items that are ultimately within management's and the Board of Directors' discretion to direct and may imply that there is less or more cash available for our programs than the most comparable GAAP financial measure indicates. It should not be inferred that the entire Free Cash Flow amount is available for future discretionary expenditures, as our definition of Free Cash Flow does not consider certain non-discretionary expenditures, such as debt payments. In addition, we may have other discretionary expenditures, such as discretionary dividends, share repurchases, and business acquisitions, that are not considered in the calculation of Free Cash Flow.
Forward-Looking Statements
This release contains certain "forward-looking statements" within the meaning of the
TE CONNECTIVITY PLC | |||||||||||
CONSOLIDATED STATEMENTS OF OPERATIONS (UNAUDITED) | |||||||||||
For the Quarters Ended | For the Six Months Ended | ||||||||||
March 27, | March 28, | March 27, | March 28, | ||||||||
2026 | 2025 | 2026 | 2025 | ||||||||
(in millions, except per share data) | |||||||||||
Net sales | $ | 4,744 | $ | 4,143 | $ | 9,413 | $ | 7,979 | |||
Cost of sales | 2,999 | 2,684 | 5,929 | 5,160 | |||||||
Gross margin | 1,745 | 1,459 | 3,484 | 2,819 | |||||||
Selling, general, and administrative expenses | 536 | 454 | 1,074 | 881 | |||||||
Research, development, and engineering expenses | 237 | 203 | 462 | 391 | |||||||
Acquisition and integration costs | 8 | 9 | 11 | 14 | |||||||
Restructuring and other charges, net | 10 | 45 | 20 | 95 | |||||||
Operating income | 954 | 748 | 1,917 | 1,438 | |||||||
Interest income | 21 | 22 | 46 | 45 | |||||||
Interest expense | (32) | (14) | (62) | (20) | |||||||
Other income (expense), net | (1) | (1) | 2 | (2) | |||||||
Income from continuing operations before income taxes | 942 | 755 | 1,903 | 1,461 | |||||||
Income tax expense | (87) | (742) | (297) | (920) | |||||||
Income from continuing operations | 855 | 13 | 1,606 | 541 | |||||||
Loss from discontinued operations, net of income taxes | — | — | (1) | — | |||||||
Net income | $ | 855 | $ | 13 | $ | 1,605 | $ | 541 | |||
Basic earnings per share: | |||||||||||
Income from continuing operations | $ | 2.92 | $ | 0.04 | $ | 5.46 | $ | 1.81 | |||
Loss from discontinued operations | — | — | — | — | |||||||
Net income | 2.92 | 0.04 | 5.46 | 1.81 | |||||||
Diluted earnings per share: | |||||||||||
Income from continuing operations | $ | 2.90 | $ | 0.04 | $ | 5.43 | $ | 1.80 | |||
Loss from discontinued operations | — | — | — | — | |||||||
Net income | 2.90 | 0.04 | 5.42 | 1.80 | |||||||
Weighted-average number of shares outstanding: | |||||||||||
Basic | 293 | 298 | 294 | 299 | |||||||
Diluted | 295 | 300 | 296 | 301 | |||||||
TE CONNECTIVITY PLC | |||||
CONSOLIDATED BALANCE SHEETS (UNAUDITED) | |||||
March 27, | September 26, | ||||
2026 | 2025 | ||||
(in millions, except share data) | |||||
Assets | |||||
Current assets: | |||||
Cash and cash equivalents | $ | 1,110 | $ | 1,255 | |
Accounts receivable, net of allowance for doubtful accounts of | 3,454 | 3,403 | |||
Inventories | 2,995 | 2,699 | |||
Prepaid expenses and other current assets | 682 | 609 | |||
Total current assets | 8,241 | 7,966 | |||
Property, plant, and equipment, net | 4,473 | 4,312 | |||
Goodwill | 7,437 | 7,126 | |||
Intangible assets, net | 2,145 | 2,227 | |||
Deferred income taxes | 2,337 | 2,507 | |||
Other assets | 1,046 | 943 | |||
Total assets | $ | 25,679 | $ | 25,081 | |
Liabilities, redeemable noncontrolling interests, and shareholders' equity | |||||
Current liabilities: | |||||
Short-term debt | $ | 102 | $ | 852 | |
Accounts payable | 2,224 | 2,021 | |||
Accrued and other current liabilities | 2,039 | 2,247 | |||
Total current liabilities | 4,365 | 5,120 | |||
Long-term debt | 5,553 | 4,842 | |||
Long-term pension and postretirement liabilities | 750 | 767 | |||
Deferred income taxes | 198 | 198 | |||
Income taxes | 306 | 414 | |||
Other liabilities | 1,125 | 1,010 | |||
Total liabilities | 12,297 | 12,351 | |||
Commitments and contingencies | |||||
Redeemable noncontrolling interests | 148 | 145 | |||
Shareholders' equity: | |||||
Preferred shares, | — | — | |||
Ordinary class A shares, | — | — | |||
Ordinary shares, | 3 | 3 | |||
Accumulated earnings | 13,900 | 13,932 | |||
Ordinary shares held in treasury, at cost, 3,632,502 and 8,330,931 shares, respectively | (818) | (1,356) | |||
Accumulated other comprehensive income | 149 | 6 | |||
Total shareholders' equity | 13,234 | 12,585 | |||
Total liabilities, redeemable noncontrolling interests, and shareholders' equity | $ | 25,679 | $ | 25,081 | |
TE CONNECTIVITY PLC | |||||||||||
CONSOLIDATED STATEMENTS OF CASH FLOWS (UNAUDITED) | |||||||||||
For the Quarters Ended | For the Six Months Ended | ||||||||||
March 27, | March 28, | March 27, | March 28, | ||||||||
2026 | 2025 | 2026 | 2025 | ||||||||
(in millions) | |||||||||||
Cash flows from operating activities: | |||||||||||
Net income | $ | 855 | $ | 13 | $ | 1,605 | $ | 541 | |||
Loss from discontinued operations, net of income taxes | — | — | 1 | — | |||||||
Income from continuing operations | 855 | 13 | 1,606 | 541 | |||||||
Adjustments to reconcile income from continuing operations to net cash | |||||||||||
Depreciation and amortization | 243 | 192 | 502 | 378 | |||||||
Deferred income taxes | 82 | 603 | 159 | 701 | |||||||
Non-cash lease cost | 39 | 35 | 78 | 69 | |||||||
Provision for losses on accounts receivable and inventories | 6 | 2 | 49 | 43 | |||||||
Share-based compensation expense | 42 | 34 | 92 | 69 | |||||||
Other | (29) | 22 | (25) | 34 | |||||||
Changes in assets and liabilities, net of the effects of acquisitions and | |||||||||||
Accounts receivable, net | 20 | (317) | (59) | (171) | |||||||
Inventories | (30) | (14) | (331) | (132) | |||||||
Prepaid expenses and other current assets | (34) | 72 | (14) | 140 | |||||||
Accounts payable | 38 | (4) | 177 | 146 | |||||||
Accrued and other current liabilities | (47) | (3) | (264) | (298) | |||||||
Income taxes | (129) | 25 | (84) | 55 | |||||||
Other | (109) | (7) | (74) | (44) | |||||||
Net cash provided by operating activities | 947 | 653 | 1,812 | 1,531 | |||||||
Cash flows from investing activities: | |||||||||||
Capital expenditures | (270) | (230) | (528) | (435) | |||||||
Proceeds from sale of property, plant, and equipment | 3 | 1 | 4 | 2 | |||||||
Acquisition of businesses, net of cash acquired | (200) | 4 | (200) | (321) | |||||||
Other | (3) | 1 | — | (7) | |||||||
Net cash used in investing activities | (470) | (224) | (724) | (761) | |||||||
Cash flows from financing activities: | |||||||||||
Net increase in commercial paper | 100 | 1,155 | 100 | 1,245 | |||||||
Proceeds from issuance of debt | 750 | 773 | 750 | 773 | |||||||
Repayment of debt | (851) | (579) | (851) | (579) | |||||||
Proceeds from exercise of share options | 20 | 25 | 64 | 59 | |||||||
Repurchase of ordinary shares | (414) | (306) | (819) | (609) | |||||||
Payment of ordinary share dividends to shareholders | (208) | (193) | (417) | (382) | |||||||
Other | (12) | (6) | (58) | (33) | |||||||
Net cash provided by (used in) financing activities | (615) | 869 | (1,231) | 474 | |||||||
Effect of currency translation on cash | (3) | 2 | (2) | (9) | |||||||
Net increase (decrease) in cash, cash equivalents, and restricted cash | (141) | 1,300 | (145) | 1,235 | |||||||
Cash, cash equivalents, and restricted cash at beginning of period | 1,251 | 1,254 | 1,255 | 1,319 | |||||||
Cash, cash equivalents, and restricted cash at end of period | $ | 1,110 | $ | 2,554 | $ | 1,110 | $ | 2,554 | |||
Supplemental cash flow information: | |||||||||||
Income taxes paid, net of refunds | $ | 135 | $ | 115 | $ | 223 | $ | 164 | |||
TE CONNECTIVITY PLC | |||||||||||
RECONCILIATION OF FREE CASH FLOW (UNAUDITED) | |||||||||||
For the Quarters Ended | For the Six Months Ended | ||||||||||
March 27, | March 28, | March 27, | March 28, | ||||||||
2026 | 2025 | 2026 | 2025 | ||||||||
(in millions) | |||||||||||
Net cash provided by operating activities | $ | 947 | $ | 653 | $ | 1,812 | $ | 1,531 | |||
Capital expenditures, net | (267) | (229) | (524) | (433) | |||||||
Free cash flow (1) | $ | 680 | $ | 424 | $ | 1,288 | $ | 1,098 | |||
(1) Free cash flow is a non-GAAP financial measure. See description of non-GAAP financial measures. | |||||||||||
TE CONNECTIVITY PLC | ||||||||||||||||||||||||
SEGMENT DATA (UNAUDITED) | ||||||||||||||||||||||||
For the Quarters Ended | For the Six Months Ended | |||||||||||||||||||||||
March 27, | March 28, | March 27, | March 28, | |||||||||||||||||||||
2026 | 2025 | 2026 | 2025 | |||||||||||||||||||||
($ in millions) | ||||||||||||||||||||||||
Net Sales | Net Sales | Net Sales | Net Sales | |||||||||||||||||||||
Transportation Solutions | $ | 2,422 | $ | 2,314 | $ | 4,889 | $ | 4,557 | ||||||||||||||||
Industrial Solutions | 2,322 | 1,829 | 4,524 | 3,422 | ||||||||||||||||||||
Total | $ | 4,744 | $ | 4,143 | $ | 9,413 | $ | 7,979 | ||||||||||||||||
Operating | Operating | Operating | Operating | Operating | Operating | Operating | Operating | |||||||||||||||||
Income | Margin | Income | Margin | Income | Margin | Income | Margin | |||||||||||||||||
Transportation Solutions | $ | 503 | 20.8 | % | $ | 445 | 19.2 | % | $ | 1,004 | 20.5 | % | $ | 891 | 19.6 | % | ||||||||
Industrial Solutions | 451 | 19.4 | 303 | 16.6 | 913 | 20.2 | 547 | 16.0 | ||||||||||||||||
Total | $ | 954 | 20.1 | % | $ | 748 | 18.1 | % | $ | 1,917 | 20.4 | % | $ | 1,438 | 18.0 | % | ||||||||
Adjusted | Adjusted | Adjusted | Adjusted | Adjusted | Adjusted | Adjusted | Adjusted | |||||||||||||||||
Operating | Operating | Operating | Operating | Operating | Operating | Operating | Operating | |||||||||||||||||
Income (1) | Margin (1) | Income (1) | Margin (1) | Income (1) | Margin (1) | Income (1) | Margin (1) | |||||||||||||||||
Transportation Solutions | $ | 522 | 21.6 | % | $ | 495 | 21.4 | % | $ | 1,045 | 21.4 | % | $ | 990 | 21.7 | % | ||||||||
Industrial Solutions | 507 | 21.8 | 351 | 19.2 | 1,020 | 22.5 | 640 | 18.7 | ||||||||||||||||
Total | $ | 1,029 | 21.7 | % | $ | 846 | 20.4 | % | $ | 2,065 | 21.9 | % | $ | 1,630 | 20.4 | % | ||||||||
(1) Adjusted operating income and adjusted operating margin are non-GAAP financial measures. See description of non-GAAP financial measures. | ||||||||||||||||||||||||
TE CONNECTIVITY PLC | |||||||||||||||||
RECONCILIATION OF NET SALES GROWTH (DECLINE) (UNAUDITED) | |||||||||||||||||
Change in Net Sales for the Quarter Ended March 27, 2026 | |||||||||||||||||
versus Net Sales for the Quarter Ended March 28, 2025 | |||||||||||||||||
Net Sales | Organic Net Sales | ||||||||||||||||
Growth (Decline) | Growth (Decline) (1) | Translation (2) | Acquisition | ||||||||||||||
($ in millions) | |||||||||||||||||
Transportation Solutions: | |||||||||||||||||
Automotive | $ | 27 | 1.6 | % | $ | (67) | (3.8) | % | $ | 94 | $ | — | |||||
Commercial transportation | 76 | 21.3 | 62 | 17.1 | 14 | — | |||||||||||
Sensors | 5 | 2.3 | (7) | (3.0) | 12 | — | |||||||||||
Total Transportation Solutions | 108 | 4.7 | (12) | (0.5) | 120 | — | |||||||||||
Industrial Solutions: | |||||||||||||||||
Digital data networks | 232 | 48.1 | 222 | 46.1 | 10 | — | |||||||||||
Automation and connected living | 67 | 13.1 | 42 | 8.2 | 25 | — | |||||||||||
Aerospace, defense, and marine | 34 | 9.1 | 21 | 5.4 | 13 | — | |||||||||||
Energy | 166 | 59.5 | 31 | 11.2 | 15 | 120 | |||||||||||
Medical | (6) | (3.3) | (7) | (3.5) | 1 | — | |||||||||||
Total Industrial Solutions | 493 | 27.0 | 309 | 16.9 | 64 | 120 | |||||||||||
Total | $ | 601 | 14.5 | % | $ | 297 | 7.2 | % | $ | 184 | $ | 120 | |||||
Change in Net Sales for the Six Months Ended March 27, 2026 | |||||||||||||||||
versus Net Sales for the Six Months Ended March 28, 2025 | |||||||||||||||||
Net Sales | Organic Net Sales | ||||||||||||||||
Growth | Growth (Decline) (1) | Translation (2) | Acquisitions | ||||||||||||||
($ in millions) | |||||||||||||||||
Transportation Solutions: | |||||||||||||||||
Automotive | $ | 190 | 5.5 | % | $ | 45 | 1.3 | % | $ | 145 | $ | — | |||||
Commercial transportation | 134 | 20.0 | 113 | 16.7 | 21 | — | |||||||||||
Sensors | 8 | 1.9 | (12) | (2.7) | 20 | — | |||||||||||
Total Transportation Solutions | 332 | 7.3 | 146 | 3.2 | 186 | — | |||||||||||
Industrial Solutions: | |||||||||||||||||
Digital data networks | 526 | 58.8 | 510 | 57.0 | 16 | — | |||||||||||
Automation and connected living | 137 | 13.8 | 97 | 9.8 | 39 | 1 | |||||||||||
Aerospace, defense, and marine | 81 | 11.4 | 57 | 8.0 | 24 | — | |||||||||||
Energy | 356 | 71.9 | 63 | 12.7 | 22 | 271 | |||||||||||
Medical | 2 | 0.6 | 1 | 0.4 | 1 | — | |||||||||||
Total Industrial Solutions | 1,102 | 32.2 | 728 | 21.3 | 102 | 272 | |||||||||||
Total | $ | 1,434 | 18.0 | % | $ | 874 | 11.0 | % | $ | 288 | $ | 272 | |||||
(1) Organic net sales growth (decline) is a non-GAAP financial measure. See description of non-GAAP financial measures. | |||||||||||||||||
(2) Represents the change in net sales resulting from changes in foreign currency exchange rates. | |||||||||||||||||
TE CONNECTIVITY PLC | |||||||||||||||||||
RECONCILIATION OF NON-GAAP FINANCIAL MEASURES TO GAAP FINANCIAL MEASURES | |||||||||||||||||||
For the Quarter Ended March 27, 2026 | |||||||||||||||||||
(UNAUDITED) | |||||||||||||||||||
Adjustments | |||||||||||||||||||
Acquisition- | Restructuring | ||||||||||||||||||
Related | and Other | Amortization | Adjusted | ||||||||||||||||
Charges (1) | Charges, Net (1) | Expense (1) | Tax Items (2) | (Non-GAAP) (3) | |||||||||||||||
($ in millions, except per share data) | |||||||||||||||||||
Operating income: | |||||||||||||||||||
Transportation Solutions | $ | 503 | $ | — | $ | 1 | $ | 18 | $ | — | $ | 522 | |||||||
Industrial Solutions | 451 | 8 | 9 | 39 | — | 507 | |||||||||||||
Total | $ | 954 | $ | 8 | $ | 10 | $ | 57 | $ | — | $ | 1,029 | |||||||
Operating margin | 20.1 | % | 21.7 | % | |||||||||||||||
Income tax expense | $ | (87) | $ | (2) | $ | 2 | $ | (12) | $ | (114) | $ | (213) | |||||||
Effective tax rate | 9.2 | % | 20.9 | % | |||||||||||||||
Income from continuing operations | $ | 855 | $ | 6 | $ | 12 | $ | 45 | $ | (114) | $ | 804 | |||||||
Diluted earnings per share from | $ | 2.90 | $ | 0.02 | $ | 0.04 | $ | 0.15 | $ | (0.39) | $ | 2.73 | |||||||
(1) The tax effect of each non-GAAP adjustment is calculated based on the jurisdictions in which the expense (income) is incurred and the tax laws in effect for each such jurisdiction. | |||||||||||||||||||
(2) Represents a net income tax benefit related primarily to the settlement of prior period tax matters. | |||||||||||||||||||
(3) See description of non-GAAP financial measures. | |||||||||||||||||||
TE CONNECTIVITY PLC | |||||||||||||||||||
RECONCILIATION OF NON-GAAP FINANCIAL MEASURES TO GAAP FINANCIAL MEASURES | |||||||||||||||||||
For the Quarter Ended March 28, 2025 | |||||||||||||||||||
(UNAUDITED) | |||||||||||||||||||
Adjustments | |||||||||||||||||||
Acquisition- | Restructuring | ||||||||||||||||||
Related | and Other | Amortization | Adjusted | ||||||||||||||||
Charges (1) | Charges, Net (1) | Expense (1) | Tax Items (2) | (Non-GAAP) (3) | |||||||||||||||
($ in millions, except per share data) | |||||||||||||||||||
Operating income: | |||||||||||||||||||
Transportation Solutions | $ | 445 | $ | — | $ | 33 | $ | 17 | $ | — | $ | 495 | |||||||
Industrial Solutions | 303 | 12 | 12 | 24 | — | 351 | |||||||||||||
Total | $ | 748 | $ | 12 | $ | 45 | $ | 41 | $ | — | $ | 846 | |||||||
Operating margin | 18.1 | % | 20.4 | % | |||||||||||||||
Income tax expense | $ | (742) | $ | (2) | $ | (11) | $ | (8) | $ | 574 | $ | (189) | |||||||
Effective tax rate | 98.3 | % | 22.2 | % | |||||||||||||||
Income from continuing operations | $ | 13 | $ | 10 | $ | 34 | $ | 33 | $ | 574 | $ | 664 | |||||||
Diluted earnings per share from | $ | 0.04 | $ | 0.03 | $ | 0.11 | $ | 0.11 | $ | 1.91 | $ | 2.21 | |||||||
(1) The tax effect of each non-GAAP adjustment is calculated based on the jurisdictions in which the expense (income) is incurred and the tax laws in effect for each such jurisdiction. | ||||||||||||||||||
(2) Represents income tax expense related to a net increase in the valuation allowance for certain deferred tax assets associated with a ten-year tax credit obtained by a Swiss subsidiary in fiscal 2024. | ||||||||||||||||||
(3) See description of non-GAAP financial measures. |
TE CONNECTIVITY PLC | |||||||||||||||||||
RECONCILIATION OF NON-GAAP FINANCIAL MEASURES TO GAAP FINANCIAL MEASURES | |||||||||||||||||||
For the Six Months Ended March 27, 2026 | |||||||||||||||||||
(UNAUDITED) | |||||||||||||||||||
Adjustments | |||||||||||||||||||
Acquisition- | Restructuring | ||||||||||||||||||
Related | and Other | Amortization | Adjusted | ||||||||||||||||
Charges (1) | Charges, Net (1) | Expense (1) | Tax Items (2) | (Non-GAAP) (3) | |||||||||||||||
($ in millions, except per share data) | |||||||||||||||||||
Operating income: | |||||||||||||||||||
Transportation Solutions | $ | 1,004 | $ | — | $ | 5 | $ | 36 | $ | — | $ | 1,045 | |||||||
Industrial Solutions | 913 | 14 | 15 | 78 | — | 1,020 | |||||||||||||
Total | $ | 1,917 | $ | 14 | $ | 20 | $ | 114 | $ | — | $ | 2,065 | |||||||
Operating margin | 20.4 | % | 21.9 | % | |||||||||||||||
Income tax expense | $ | (297) | $ | (3) | $ | (1) | $ | (23) | $ | (114) | $ | (438) | |||||||
Effective tax rate | 15.6 | % | 21.4 | % | |||||||||||||||
Income from continuing operations | $ | 1,606 | $ | 11 | $ | 19 | $ | 91 | $ | (114) | $ | 1,613 | |||||||
Diluted earnings per share from | $ | 5.43 | $ | 0.04 | $ | 0.06 | $ | 0.31 | $ | (0.39) | $ | 5.45 | |||||||
(1) The tax effect of each non-GAAP adjustment is calculated based on the jurisdictions in which the expense (income) is incurred and the tax laws in effect for each such jurisdiction. | |||||||||||||||||||
(2) Represents a net income tax benefit related primarily to the settlement of prior period tax matters. | |||||||||||||||||||
(3) See description of non-GAAP financial measures. | |||||||||||||||||||
TE CONNECTIVITY PLC | |||||||||||||||||||
RECONCILIATION OF NON-GAAP FINANCIAL MEASURES TO GAAP FINANCIAL MEASURES | |||||||||||||||||||
For the Six Months Ended March 28, 2025 | |||||||||||||||||||
(UNAUDITED) | |||||||||||||||||||
Adjustments | |||||||||||||||||||
Acquisition- | Restructuring | ||||||||||||||||||
Related | and Other | Amortization | Adjusted | ||||||||||||||||
Charges (1) | Charges, Net (1) | Expense (1) | Tax Items (2) | (Non-GAAP) (3) | |||||||||||||||
($ in millions, except per share data) | |||||||||||||||||||
Operating income: | |||||||||||||||||||
Transportation Solutions | $ | 891 | $ | — | $ | 65 | $ | 34 | $ | — | $ | 990 | |||||||
Industrial Solutions | 547 | 17 | 30 | 46 | — | 640 | |||||||||||||
Total | $ | 1,438 | $ | 17 | $ | 95 | $ | 80 | $ | — | $ | 1,630 | |||||||
Operating margin | 18.0 | % | 20.4 | % | |||||||||||||||
Income tax expense | $ | (920) | $ | (3) | $ | (20) | $ | (15) | $ | 587 | $ | (371) | |||||||
Effective tax rate | 63.0 | % | 22.4 | % | |||||||||||||||
Income from continuing operations | $ | 541 | $ | 14 | $ | 75 | $ | 65 | $ | 587 | $ | 1,282 | |||||||
Diluted earnings per share from | $ | 1.80 | $ | 0.05 | $ | 0.25 | $ | 0.22 | $ | 1.95 | $ | 4.26 | |||||||
(1) The tax effect of each non-GAAP adjustment is calculated based on the jurisdictions in which the expense (income) is incurred and the tax laws in effect for each such jurisdiction. | |||||||||||||||||||
(2) Includes income tax expense of | |||||||||||||||||||
(3) See description of non-GAAP financial measures. | |||||||||||||||||||
TE CONNECTIVITY PLC | ||||||||||||||||
RECONCILIATION OF NON-GAAP FINANCIAL MEASURES TO GAAP FINANCIAL MEASURES | ||||||||||||||||
For the Quarter Ended June 27, 2025 | ||||||||||||||||
(UNAUDITED) | ||||||||||||||||
Adjustments | ||||||||||||||||
Acquisition- | Restructuring | |||||||||||||||
Related | and Other | Amortization | Adjusted | |||||||||||||
Charges (1) | Charges, Net (1) | Expense (1) | (Non-GAAP) (2) | |||||||||||||
($ in millions, except per share data) | ||||||||||||||||
Operating income: | ||||||||||||||||
Transportation Solutions | $ | 462 | $ | — | $ | 7 | $ | 17 | $ | 486 | ||||||
Industrial Solutions | 395 | 30 | 7 | 35 | 467 | |||||||||||
Total | $ | 857 | $ | 30 | $ | 14 | $ | 52 | $ | 953 | ||||||
Operating margin | 18.9 | % | 21.0 | % | ||||||||||||
Income tax expense | $ | (208) | $ | (7) | $ | 1 | $ | (11) | $ | (225) | ||||||
Effective tax rate | 24.6 | % | 23.9 | % | ||||||||||||
Income from continuing operations | $ | 638 | $ | 23 | $ | 15 | $ | 41 | $ | 717 | ||||||
Diluted earnings per share from | $ | 2.14 | $ | 0.08 | $ | 0.05 | $ | 0.14 | $ | 2.41 | ||||||
(1) The tax effect of each non-GAAP adjustment is calculated based on the jurisdictions in which the expense (income) is incurred and the tax laws in effect for each such jurisdiction. | ||||||||||||||||
(2) See description of non-GAAP financial measures. | ||||||||||||||||
TE CONNECTIVITY PLC | |||||||||||||||||||
RECONCILIATION OF NON-GAAP FINANCIAL MEASURES TO GAAP FINANCIAL MEASURES | |||||||||||||||||||
For the Year Ended September 26, 2025 | |||||||||||||||||||
(UNAUDITED) | |||||||||||||||||||
Adjustments | |||||||||||||||||||
Acquisition- | Restructuring | ||||||||||||||||||
Related | and Other | Amortization | Adjusted | ||||||||||||||||
Charges (1) | Charges, Net (1) | Expense (1) | Tax Items (2) | (Non-GAAP) (3) | |||||||||||||||
($ in millions, except per share data) | |||||||||||||||||||
Operating income: | |||||||||||||||||||
Transportation Solutions | $ | 1,818 | $ | — | $ | 75 | $ | 70 | $ | — | $ | 1,963 | |||||||
Industrial Solutions | 1,393 | 57 | 51 | 120 | — | 1,621 | |||||||||||||
Total | $ | 3,211 | $ | 57 | $ | 126 | $ | 190 | $ | — | $ | 3,584 | |||||||
Operating margin | 18.6 | % | 20.8 | % | |||||||||||||||
Income tax expense | $ | (1,361) | $ | (12) | $ | (13) | $ | (37) | $ | 618 | $ | (805) | |||||||
Effective tax rate | 42.5 | % | 22.5 | % | |||||||||||||||
Income from continuing operations | $ | 1,843 | $ | 45 | $ | 113 | $ | 153 | $ | 618 | $ | 2,772 | |||||||
Diluted earnings per share from | $ | 6.16 | $ | 0.15 | $ | 0.38 | $ | 0.51 | $ | 2.07 | $ | 9.27 | |||||||
(1) The tax effect of each non-GAAP adjustment is calculated based on the jurisdictions in which the expense (income) is incurred and the tax laws in effect for each such jurisdiction. | |||||||||||||||||||
(2) Represents income tax expense of | |||||||||||||||||||
(3) See description of non-GAAP financial measures. | |||||||||||||||||||
TE CONNECTIVITY PLC | |||
RECONCILIATION OF FORWARD-LOOKING NON-GAAP FINANCIAL MEASURES | |||
TO FORWARD-LOOKING GAAP FINANCIAL MEASURES | |||
As of April 22, 2026 | |||
(UNAUDITED) | |||
Outlook for | |||
Quarter Ending | |||
June 26, | |||
2026 | |||
Diluted earnings per share from continuing operations | $ | 2.44 | |
Acquisition-related charges | 0.02 | ||
Restructuring and other charges, net | 0.22 | ||
Amortization expense | 0.15 | ||
Adjusted diluted earnings per share from continuing operations (1) | $ | 2.83 | |
Net sales growth | 10.3 | % | |
Translation | (1.1) | ||
(Acquisitions) divestitures, net | — | ||
Organic net sales growth (1) | 9.2 | % | |
(1) See description of non-GAAP financial measures. | |||

 View original content to download multimedia:https://www.prnewswire.com/news-releases/te-connectivity-delivers-results-above-guidance-with-15-sales-growth-and-over-20-eps-growth-in-second-quarter-of-fiscal-2026-302749413.html
SOURCE TE Connectivity plc
FAQ
AI-generated questions and answers. How Rhea-AI works. Not financial advice.