Astronics Corporation Reports 14% Growth in Sales in 2024 Second Quarter
-
Sales grew
14% to$198.1 million -
Operating income increased to
$7.6 million 3.8% of sales -
Achieved net income for the quarter of
$1.5 million $0.04 -
Adjusted EBITDA1 grew
28% to$20.2 million 10.2% of sales, an increase of$4.4 million -
Bookings in the quarter were
$219.0 million $633.4 million -
Aerospace achieved its tenth consecutive record backlog of
$554.6 million -
Raising 2024 revenue guidance to
$780 million $800 million
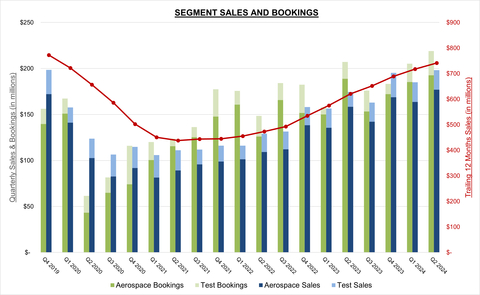
Astronics Segment Sales and Bookings (Graphic: Business Wire)
Peter J. Gundermann, Chairman, President and Chief Executive Officer, commented, “Our second quarter confirmed success with increased demand, new program wins, and our ability to deliver product to our customers more efficiently and predictably. We exceeded our guidance with
| ____________________________ |
1 Adjusted EBITDA is a Non-GAAP Performance Measure. Please see the attached table for a reconciliation of adjusted EBITDA to GAAP net income (loss). |
Second Quarter Results
|
Three Months Ended |
Six Months Ended |
||||||||||||||||||||
($ in thousands) |
June 29, 2024 |
July 1, 2023 |
% Change |
June 29, 2024 |
July 1, 2023 |
% Change |
||||||||||||||||
|
|
|
|
|
|
|
||||||||||||||||
Sales |
$ |
198,114 |
|
$ |
174,454 |
|
13.6 |
% |
$ |
383,188 |
|
$ |
330,992 |
|
15.8 |
% |
||||||
Income from Operations |
$ |
7,550 |
|
$ |
2,396 |
|
215.1 |
% |
$ |
9,216 |
|
$ |
26 |
|
35,346.2 |
% |
||||||
Operating Margin % |
|
3.8 |
% |
|
1.4 |
% |
|
|
2.4 |
% |
|
— |
% |
|
||||||||
Net Gain on Sale of Business |
$ |
— |
|
$ |
— |
|
|
$ |
— |
|
$ |
(3,427 |
) |
|
||||||||
Net Income (Loss) |
$ |
1,533 |
|
$ |
(11,999 |
) |
112.8 |
% |
$ |
(1,645 |
) |
$ |
(16,414 |
) |
90.0 |
% |
||||||
Net Income (Loss) % |
|
0.8 |
% |
|
(6.9 |
)% |
|
|
(0.4 |
)% |
|
(5.0 |
)% |
|
||||||||
|
|
|
|
|
|
|
||||||||||||||||
*Adjusted EBITDA |
$ |
20,243 |
|
$ |
15,844 |
|
27.8 |
% |
$ |
39,316 |
|
$ |
21,922 |
|
79.3 |
% |
||||||
*Adjusted EBITDA Margin % |
|
10.2 |
% |
|
9.1 |
% |
|
|
10.3 |
% |
|
6.6 |
% |
|
||||||||
*Adjusted EBITDA is a Non-GAAP Performance Measure. Please see the attached table for a reconciliation of adjusted EBITDA to GAAP net income (loss). |
||||||||||||||||||||||
Second Quarter 2024 Results (compared with the prior-year period, unless noted otherwise)
Consolidated sales were up
Consolidated operating income increased to
Consolidated sales and operating profit were negatively impacted by
Consolidated net income was
Consolidated adjusted EBITDA increased to
Bookings were
Aerospace Segment Review (refer to sales by market and segment data in accompanying tables)
Aerospace Second Quarter 2024 Results (compared with the prior-year period, unless noted otherwise)
Aerospace segment sales increased
Military Aircraft sales increased
Aerospace segment operating profit of
Aerospace bookings were
Mr. Gundermann commented, “The strong demand for our Aerospace products and technologies continues to gain momentum as the aerospace industry recovers. Encouragingly, we are seeing strength across all of our Aerospace product lines. While our significant position in inflight entertainment and connectivity continues to grow, we are also seeing strong growth in our flight critical power and aircraft lighting thrusts. At the same time, we are continuing to become more efficient at delivering product reliably and predictably and the higher throughput is beginning to show the operating leverage that is inherent in our business.”
Test Systems Segment Review (refer to sales by market and segment data in accompanying tables)
Test Systems Second Quarter 2024 Results (compared with the prior-year period, unless noted otherwise)
Test Systems segment sales were
Test Systems segment operating loss was
In April 2024, the Test Systems segment implemented restructuring initiatives to align the workforce and management structure with near-term revenue expectations and operational needs resulting in
Bookings for the Test Systems segment in the quarter were
Mr. Gundermann commented, “The second quarter was an important reset for our Test business. We finally were awarded the
Liquidity and Financing
Capital expenditures in the quarter were
Cash used for operations in the second quarter of 2024 was primarily the result of a
On July 11, 2024, the Company announced it had amended and expanded its revolving line of credit and refinanced its term loan. The refinancing provides improved liquidity, lower cash costs, and greater financial flexibility for the Company. The refinancing is comprised of an expanded asset-based line of credit and a reduced, lower-cost term loan.
The revolving line of credit was expanded from
The new
The lower combined interest rate is expected to reduce interest expense by
Third quarter 2024 expenses will include refinancing-related fees, the call premium on the previous term loan and the write-off of deferred financing costs related to the previous financing. These expenses in total are estimated to be
2024 Outlook
The Company is increasing its 2024 revenue guidance to
The Company expects third quarter revenue to be in the range of
Backlog at the end of the second quarter was a record
Peter Gundermann commented, “We are making excellent progress as an organization, with first half 2024 sales up
Second Quarter 2024 Webcast and Conference Call
The Company will host a teleconference today at 4:45 p.m. ET. During the teleconference, management will review the financial and operating results for the period and discuss Astronics’ corporate strategy and outlook. A question-and-answer session will follow.
The Astronics conference call can be accessed by calling (412) 317-0518. The listen-only audio webcast can be monitored at investors.astronics.com. To listen to the archived call, dial (412) 317-6671 and enter replay pin number 10189526. The telephonic replay will be available from 8:00 p.m. on the day of the call through Thursday, August 15, 2024. The webcast replay can be accessed via the investor relations section of the Company’s website where a transcript will also be posted once available.
About Astronics Corporation
Astronics Corporation (Nasdaq: ATRO) serves the world’s aerospace, defense, and other mission-critical industries with proven innovative technology solutions. Astronics works side-by-side with customers, integrating its array of power, connectivity, lighting, structures, interiors, and test technologies to solve complex challenges. For over 50 years, Astronics has delivered creative, customer-focused solutions with exceptional responsiveness. Today, global airframe manufacturers, airlines, military branches, completion centers, and Fortune 500 companies rely on the collaborative spirit and innovation of Astronics. The Company’s strategy is to increase its value by developing technologies and capabilities that provide innovative solutions to its targeted markets.
Safe Harbor Statement
This news release contains forward-looking statements as defined by the Securities Exchange Act of 1934. One can identify these forward-looking statements by the use of the words “expect,” “anticipate,” “plan,” “may,” “will,” “estimate,” “feeling” or other similar expressions and include all statements with regard to achieving any revenue or profitability expectations, aircraft production rates, the predictability of the supply chain and productivity of manufacturing personnel and efficiency of staff, the effectiveness on profitability of cost reduction efforts, the effect of pricing on margins, the execution of program wins, the benefit of market position, success with program awards and contributions of innovation, the length of the runway for improved earnings, the level of liquidity and its sufficiency to meet current needs, the rate of acceleration of the business, the level of cash generation, the level of demand by customers and markets. Because such statements apply to future events, they are subject to risks and uncertainties that could cause actual results to differ materially from those contemplated by the statements. Important factors that could cause actual results to differ materially from what may be stated here include the impact of global pandemics and related governmental and other actions taken in response, the trend in growth with passenger power and connectivity on airplanes, the state of the aerospace and defense industries, the market acceptance of newly developed products, internal production capabilities, the timing of orders received, the status of customer certification processes and delivery schedules, the demand for and market acceptance of new or existing aircraft which contain the Company’s products, the impact of regulatory activity and public scrutiny on production rates of a major
FINANCIAL TABLES FOLLOW
ASTRONICS CORPORATION |
||||||||||||||||
CONSOLIDATED STATEMENT OF OPERATIONS DATA |
||||||||||||||||
(Unaudited, $ in thousands except per share data) |
||||||||||||||||
|
|
|
|
|||||||||||||
|
Three Months Ended |
|
Six Months Ended |
|||||||||||||
|
6/29/2024 |
|
7/1/2023 |
|
6/29/2024 |
|
7/1/2023 |
|||||||||
Sales1 |
$ |
198,114 |
|
|
$ |
174,454 |
|
|
$ |
383,188 |
|
|
$ |
330,992 |
|
|
Cost of products sold |
|
156,760 |
|
|
|
141,759 |
|
|
|
307,643 |
|
|
|
270,787 |
|
|
Gross profit |
|
41,354 |
|
|
|
32,695 |
|
|
|
75,545 |
|
|
|
60,205 |
|
|
Gross margin |
|
20.9 |
% |
|
|
18.7 |
% |
|
|
19.7 |
% |
|
|
18.2 |
% |
|
|
|
|
|
|
|
|
|
|||||||||
Selling, general and administrative |
|
33,804 |
|
|
|
30,299 |
|
|
|
66,329 |
|
|
|
60,179 |
|
|
SG&A % of sales |
|
17.1 |
% |
|
|
17.4 |
% |
|
|
17.3 |
% |
|
|
18.2 |
% |
|
Income from operations |
|
7,550 |
|
|
|
2,396 |
|
|
|
9,216 |
|
|
|
26 |
|
|
Operating margin |
|
3.8 |
% |
|
|
1.4 |
% |
|
|
2.4 |
% |
|
|
— |
% |
|
|
|
|
|
|
|
|
|
|||||||||
Net gain on sale of business2 |
|
— |
|
|
|
— |
|
|
|
— |
|
|
|
(3,427 |
) |
|
Other expense (income)3 |
|
435 |
|
|
|
378 |
|
|
|
871 |
|
|
|
(910 |
) |
|
Interest expense, net |
|
5,856 |
|
|
|
5,920 |
|
|
|
11,615 |
|
|
|
11,390 |
|
|
Income (loss) before tax |
|
1,259 |
|
|
|
(3,902 |
) |
|
|
(3,270 |
) |
|
|
(7,027 |
) |
|
Income tax (benefit) expense |
|
(274 |
) |
|
|
8,097 |
|
|
|
(1,625 |
) |
|
|
9,387 |
|
|
Net income (loss) |
$ |
1,533 |
|
|
$ |
(11,999 |
) |
|
$ |
(1,645 |
) |
|
$ |
(16,414 |
) |
|
Net income (loss) % of sales |
|
0.8 |
% |
|
|
(6.9 |
)% |
|
|
(0.4 |
)% |
|
|
(5.0 |
)% |
|
|
|
|
|
|
|
|
|
|||||||||
|
|
|
|
|
|
|
|
|||||||||
Basic earnings (loss) per share: |
$ |
0.04 |
|
|
$ |
(0.37 |
) |
|
$ |
(0.05 |
) |
|
$ |
(0.50 |
) |
|
Diluted earnings (loss) per share: |
$ |
0.04 |
|
|
$ |
(0.37 |
) |
|
$ |
(0.05 |
) |
|
$ |
(0.50 |
) |
|
|
|
|
|
|
|
|
|
|||||||||
Weighted average diluted shares outstanding (in thousands) |
|
35,547 |
|
|
|
32,614 |
|
|
|
34,936 |
|
|
|
32,560 |
|
|
|
|
|
|
|
|
|
|
|||||||||
Capital expenditures |
$ |
1,796 |
|
|
$ |
2,233 |
|
|
$ |
3,394 |
|
|
$ |
3,806 |
|
|
Depreciation and amortization |
$ |
6,203 |
|
|
$ |
6,711 |
|
|
$ |
12,531 |
|
|
$ |
13,373 |
|
|
| ____________________________ |
1 In the six months ended July 1, 2023, |
2 Net gain on sale of business for the six months ended July 1, 2023 is comprised of the additional gain on the sale of the Company’s former semiconductor test business resulting from the contingent earnout for the 2022 calendar year. |
3 Other expense (income) for the six months ended July 1, 2023 includes income of |
Reconciliation to Non-GAAP Performance Measures
In addition to reporting net income, a
ASTRONICS CORPORATION |
||||||||||||||||
RECONCILIATION OF NET INCOME (LOSS) TO ADJUSTED EBITDA |
||||||||||||||||
(Unaudited, $ in thousands) |
||||||||||||||||
|
|
|
|
|
|
|
|
|||||||||
|
Consolidated |
|||||||||||||||
|
Three Months Ended |
|
Six Months Ended |
|||||||||||||
|
6/29/2024 |
|
7/1/2023 |
|
6/29/2024 |
|
7/1/2023 |
|||||||||
Net income (loss) |
$ |
1,533 |
|
|
$ |
(11,999 |
) |
|
$ |
(1,645 |
) |
|
$ |
(16,414 |
) |
|
Add back (deduct): |
|
|
|
|
|
|
|
|||||||||
Interest expense |
|
5,856 |
|
|
|
5,920 |
|
|
|
11,615 |
|
|
|
11,390 |
|
|
Income tax (benefit) expense |
|
(274 |
) |
|
|
8,097 |
|
|
|
(1,625 |
) |
|
|
9,387 |
|
|
Depreciation and amortization expense |
|
6,203 |
|
|
|
6,711 |
|
|
|
12,531 |
|
|
|
13,373 |
|
|
Equity-based compensation expense |
|
1,840 |
|
|
|
1,593 |
|
|
|
4,642 |
|
|
|
3,992 |
|
|
Non-cash annual stock bonus accrual |
|
— |
|
|
|
— |
|
|
|
1,448 |
|
|
|
— |
|
|
Non-cash 401K contribution and quarterly bonus accrual |
|
— |
|
|
|
1,328 |
|
|
|
3,454 |
|
|
|
2,536 |
|
|
Restructuring-related charges including severance |
|
657 |
|
|
|
564 |
|
|
|
774 |
|
|
|
564 |
|
|
Legal reserve, settlements and recoveries |
|
— |
|
|
|
(1,305 |
) |
|
|
— |
|
|
|
(1,305 |
) |
|
Litigation-related legal expenses |
|
4,428 |
|
|
|
4,935 |
|
|
|
8,122 |
|
|
|
9,450 |
|
|
Equity investment accrued payable write-off |
|
— |
|
|
|
— |
|
|
|
— |
|
|
|
(1,800 |
) |
|
Net gain on sale of business |
|
— |
|
|
|
— |
|
|
|
— |
|
|
|
(3,427 |
) |
|
Deferred liability recovery |
|
— |
|
|
|
— |
|
|
|
— |
|
|
|
(5,824 |
) |
|
Adjusted EBITDA |
$ |
20,243 |
|
|
$ |
15,844 |
|
|
$ |
39,316 |
|
|
$ |
21,922 |
|
|
|
|
|
|
|
|
|
|
|||||||||
Sales |
$ |
198,114 |
|
|
$ |
174,454 |
|
|
$ |
383,188 |
|
|
$ |
330,992 |
|
|
Adjusted EBITDA margin on sales |
10.2 |
% |
9.1 |
% |
10.3 |
% |
6.6 |
% |
||||||||
ASTRONICS CORPORATION |
||||||
CONSOLIDATED BALANCE SHEET DATA |
||||||
($ in thousands) |
||||||
|
(unaudited) |
|
|
|||
|
6/29/2024 |
|
12/31/2023 |
|||
ASSETS |
|
|
|
|||
Cash and cash equivalents |
$ |
2,857 |
|
$ |
4,756 |
|
Restricted cash |
|
1,535 |
|
|
6,557 |
|
Accounts receivable and uncompleted contracts |
|
186,295 |
|
|
172,108 |
|
Inventories |
|
200,679 |
|
|
191,801 |
|
Other current assets |
|
21,039 |
|
|
14,560 |
|
Property, plant and equipment, net |
|
82,511 |
|
|
85,436 |
|
Other long-term assets |
|
32,957 |
|
|
34,944 |
|
Intangible assets, net |
|
58,843 |
|
|
65,420 |
|
Goodwill |
|
58,143 |
|
|
58,210 |
|
Total assets |
$ |
644,859 |
|
$ |
633,792 |
|
|
|
|
|
|||
LIABILITIES AND SHAREHOLDERS' EQUITY |
|
|
|
|||
Current maturities of long-term debt |
$ |
1,300 |
|
$ |
8,996 |
|
Accounts payable and accrued expenses |
|
122,207 |
|
|
112,309 |
|
Customer advances and deferred revenue |
|
17,635 |
|
|
22,029 |
|
Long-term debt |
|
172,635 |
|
|
159,237 |
|
Other liabilities |
|
73,202 |
|
|
81,703 |
|
Shareholders' equity |
|
257,880 |
|
|
249,518 |
|
Total liabilities and shareholders' equity |
$ |
644,859 |
|
$ |
633,792 |
|
ASTRONICS CORPORATION |
||||||||
CONSOLIDATED CASH FLOWS DATA |
||||||||
|
|
|
|
|||||
|
Six Months Ended |
|||||||
(Unaudited, $ in thousands) |
6/29/2024 |
|
7/1/2023 |
|||||
Cash flows from operating activities: |
|
|
|
|||||
Net loss |
$ |
(1,645 |
) |
|
$ |
(16,414 |
) |
|
Adjustments to reconcile net loss to cash from operating activities: |
|
|
|
|||||
Non-cash items: |
|
|
|
|||||
Depreciation and amortization |
|
12,531 |
|
|
|
13,373 |
|
|
Amortization of deferred financing fees |
|
1,695 |
|
|
|
1,363 |
|
|
Provisions for non-cash losses on inventory and receivables |
|
2,415 |
|
|
|
1,705 |
|
|
Equity-based compensation expense |
|
4,642 |
|
|
|
3,992 |
|
|
Net gain on sale of business |
|
— |
|
|
|
(3,427 |
) |
|
Operating lease non-cash expense |
|
2,562 |
|
|
|
2,563 |
|
|
Non-cash 401K contribution and quarterly bonus accrual |
|
3,454 |
|
|
|
2,536 |
|
|
Non-cash annual stock bonus accrual |
|
1,448 |
|
|
|
— |
|
|
Non-cash deferred liability reversal |
|
— |
|
|
|
(5,824 |
) |
|
Other |
|
1,827 |
|
|
|
(1,275 |
) |
|
Cash flows from changes in operating assets and liabilities: |
|
|
|
|||||
Accounts receivable |
|
(15,281 |
) |
|
|
(22,619 |
) |
|
Inventories |
|
(11,398 |
) |
|
|
(22,638 |
) |
|
Accounts payable |
|
(4,661 |
) |
|
|
14,081 |
|
|
Accrued expenses |
|
9,255 |
|
|
|
5,611 |
|
|
Income taxes |
|
(4,487 |
) |
|
|
7,422 |
|
|
Operating lease liabilities |
|
(2,447 |
) |
|
|
(2,674 |
) |
|
Customer advance payments and deferred revenue |
|
(4,280 |
) |
|
|
959 |
|
|
Supplemental retirement plan liabilities |
|
(209 |
) |
|
|
(206 |
) |
|
Other assets and liabilities |
|
356 |
|
|
|
321 |
|
|
Net cash used by operating activities |
|
(4,223 |
) |
|
|
(21,151 |
) |
|
Cash flows from investing activities: |
|
|
|
|||||
Proceeds on sale of business and assets |
|
— |
|
|
|
3,427 |
|
|
Capital expenditures |
|
(3,394 |
) |
|
|
(3,806 |
) |
|
Net cash used by investing activities |
|
(3,394 |
) |
|
|
(379 |
) |
|
Cash flows from financing activities: |
|
|
|
|||||
Proceeds from long-term debt |
|
15,392 |
|
|
|
131,732 |
|
|
Principal payments on long-term debt |
|
(9,498 |
) |
|
|
(112,774 |
) |
|
Stock award and employee stock purchase plan activity |
|
(3,172 |
) |
|
|
(601 |
) |
|
Financing-related costs |
|
(1,837 |
) |
|
|
(6,388 |
) |
|
Finance lease principal payments |
|
(70 |
) |
|
|
(24 |
) |
|
Other |
|
(10 |
) |
|
|
— |
|
|
Net cash provided by financing activities |
|
805 |
|
|
|
11,945 |
|
|
Effect of exchange rates on cash |
|
(109 |
) |
|
|
101 |
|
|
Decrease in cash and cash equivalents and restricted cash |
|
(6,921 |
) |
|
|
(9,484 |
) |
|
Cash and cash equivalents and restricted cash at beginning of period |
|
11,313 |
|
|
|
13,778 |
|
|
Cash and cash equivalents and restricted cash at end of period |
$ |
4,392 |
|
|
$ |
4,294 |
|
|
ASTRONICS CORPORATION |
||||||||||||||||
SEGMENT DATA |
||||||||||||||||
(Unaudited, $ in thousands) |
||||||||||||||||
|
|
|
||||||||||||||
|
Three Months Ended |
Six Months Ended |
||||||||||||||
|
6/29/2024 |
7/1/2023 |
6/29/2024 |
7/1/2023 |
||||||||||||
Sales |
|
|
|
|
||||||||||||
Aerospace |
$ |
176,948 |
|
$ |
158,386 |
|
$ |
340,623 |
|
$ |
294,101 |
|
||||
Less inter-segment |
|
(5 |
) |
|
(4 |
) |
|
(42 |
) |
|
(122 |
) |
||||
Total Aerospace |
|
176,943 |
|
|
158,382 |
|
|
340,581 |
|
|
293,979 |
|
||||
|
|
|
|
|
||||||||||||
Test Systems1 |
|
21,171 |
|
|
16,072 |
|
|
42,607 |
|
|
37,013 |
|
||||
Less inter-segment |
|
— |
|
|
— |
|
|
— |
|
|
— |
|
||||
Total Test Systems |
|
21,171 |
|
|
16,072 |
|
|
42,607 |
|
|
37,013 |
|
||||
|
|
|
|
|
||||||||||||
Total consolidated sales |
|
198,114 |
|
|
174,454 |
|
|
383,188 |
|
|
330,992 |
|
||||
|
|
|
|
|
||||||||||||
Segment operating profit and margins |
|
|
|
|
||||||||||||
Aerospace |
|
19,280 |
|
|
13,719 |
|
|
31,377 |
|
|
17,806 |
|
||||
|
|
10.9 |
% |
|
8.7 |
% |
|
9.2 |
% |
|
6.1 |
% |
||||
Test Systems1 |
|
(5,336 |
) |
|
(6,143 |
) |
|
(8,415 |
) |
|
(6,740 |
) |
||||
|
|
(25.2 |
)% |
|
(38.2 |
)% |
|
(19.8 |
)% |
|
(18.2 |
)% |
||||
Total segment operating profit |
|
13,944 |
|
|
7,576 |
|
|
22,962 |
|
|
11,066 |
|
||||
|
|
|
|
|
||||||||||||
|
|
|
|
|
||||||||||||
Net gain on sale of business |
|
— |
|
|
— |
|
|
— |
|
|
(3,427 |
) |
||||
Interest expense |
|
5,856 |
|
|
5,920 |
|
|
11,615 |
|
|
11,390 |
|
||||
Corporate expenses and other2 |
|
6,829 |
|
|
5,558 |
|
|
14,617 |
|
|
10,130 |
|
||||
Income (loss) before taxes |
$ |
1,259 |
|
$ |
(3,902 |
) |
$ |
(3,270 |
) |
$ |
(7,027 |
) |
||||
| ____________________________ |
1 In the six months ended July 1, 2023, |
2 Corporate expenses and other for the six months ended July 1, 2023 includes income of |
| ASTRONICS CORPORATION | |||||||||||||||||||||
SALES BY MARKET |
|||||||||||||||||||||
(Unaudited, $ in thousands) |
|||||||||||||||||||||
|
|
|
|
|
|||||||||||||||||
|
Three Months Ended |
|
Six Months Ended |
2024 YTD |
|||||||||||||||||
|
6/29/2024 |
7/1/2023 |
% Change |
|
6/29/2024 |
7/1/2023 |
% Change |
% of Sales |
|||||||||||||
Aerospace Segment |
|
|
|
|
|
|
|
|
|||||||||||||
Commercial Transport |
$ |
128,399 |
$ |
112,079 |
14.6 |
% |
|
$ |
249,829 |
$ |
206,292 |
21.1 |
% |
65.2 |
% |
||||||
Military Aircraft |
|
24,781 |
|
13,584 |
82.4 |
% |
|
|
41,860 |
|
27,648 |
51.4 |
% |
10.9 |
% |
||||||
General Aviation |
|
19,015 |
|
25,015 |
(24.0 |
)% |
|
|
38,566 |
|
44,463 |
(13.3 |
)% |
10.1 |
% |
||||||
Other |
|
4,748 |
|
7,704 |
(38.4 |
)% |
|
|
10,326 |
|
15,576 |
(33.7 |
)% |
2.7 |
% |
||||||
Aerospace Total |
|
176,943 |
|
158,382 |
11.7 |
% |
|
|
340,581 |
|
293,979 |
15.9 |
% |
88.9 |
% |
||||||
|
|
|
|
|
|
|
|
|
|||||||||||||
Test Systems Segment1 |
|
|
|
|
|
|
|
|
|||||||||||||
Government & Defense |
|
21,171 |
|
16,072 |
31.7 |
% |
|
|
42,607 |
|
37,013 |
15.1 |
% |
11.1 |
% |
||||||
|
|
|
|
|
|
|
|
|
|||||||||||||
Total Sales |
$ |
198,114 |
$ |
174,454 |
13.6 |
% |
|
$ |
383,188 |
$ |
330,992 |
15.8 |
% |
|
|||||||
SALES BY PRODUCT LINE |
|||||||||||||||||||||
(Unaudited, $ in thousands) |
|||||||||||||||||||||
|
|
|
|
|
|||||||||||||||||
|
Three Months Ended |
|
Six Months Ended |
2024 YTD |
|||||||||||||||||
|
6/29/2024 |
7/1/2023 |
% Change |
|
6/29/2024 |
7/1/2023 |
% Change |
% of Sales |
|||||||||||||
Aerospace Segment |
|
|
|
|
|
|
|
|
|||||||||||||
Electrical Power & Motion |
$ |
90,328 |
$ |
67,946 |
32.9 |
% |
|
$ |
173,452 |
$ |
121,400 |
42.9 |
% |
45.4 |
% |
||||||
Lighting & Safety |
|
46,454 |
|
41,918 |
10.8 |
% |
|
|
88,241 |
|
78,471 |
12.5 |
% |
23.0 |
% |
||||||
Avionics |
|
28,971 |
|
30,923 |
(6.3 |
)% |
|
|
54,565 |
|
60,664 |
(10.1 |
)% |
14.2 |
% |
||||||
Systems Certification |
|
3,364 |
|
7,620 |
(55.9 |
)% |
|
|
7,812 |
|
13,297 |
(41.2 |
)% |
2.0 |
% |
||||||
Structures |
|
3,078 |
|
2,271 |
35.5 |
% |
|
|
6,185 |
|
4,571 |
35.3 |
% |
1.6 |
% |
||||||
Other |
|
4,748 |
|
7,704 |
(38.4 |
)% |
|
|
10,326 |
|
15,576 |
(33.7 |
)% |
2.7 |
% |
||||||
Aerospace Total |
|
176,943 |
|
158,382 |
11.7 |
% |
|
|
340,581 |
|
293,979 |
15.9 |
% |
88.9 |
% |
||||||
|
|
|
|
|
|
|
|
|
|||||||||||||
Test Systems Segment1 |
|
21,171 |
|
16,072 |
31.7 |
% |
|
|
42,607 |
|
37,013 |
15.1 |
% |
11.1 |
% |
||||||
|
|
|
|
|
|
|
|
|
|||||||||||||
Total Sales |
$ |
198,114 |
$ |
174,454 |
13.6 |
% |
|
$ |
383,188 |
$ |
330,992 |
15.8 |
% |
|
|||||||
| ____________________________ |
1 Test Systems sales in the six months ended July 1, 2023 included a |
| ASTRONICS CORPORATION | |||||||||||||||
ORDER AND BACKLOG TREND |
|||||||||||||||
(Unaudited, $ in thousands) |
|||||||||||||||
|
Q3 2023 |
Q4 2023 |
Q1 2024 |
Q2 2024 |
Trailing Twelve Months |
||||||||||
|
9/30/2023 |
12/31/2023 |
3/30/2024 |
6/29/2024 |
6/29/2024 |
||||||||||
Sales |
|
|
|
|
|
||||||||||
Aerospace |
$ |
142,104 |
$ |
168,747 |
$ |
163,638 |
$ |
176,943 |
$ |
651,432 |
|||||
Test Systems |
|
20,818 |
|
26,545 |
|
21,436 |
|
21,171 |
|
89,970 |
|||||
Total Sales |
$ |
162,922 |
$ |
195,292 |
$ |
185,074 |
$ |
198,114 |
$ |
741,402 |
|||||
|
|
|
|
|
|
||||||||||
Bookings |
|
|
|
|
|
||||||||||
Aerospace |
$ |
153,272 |
$ |
172,106 |
$ |
185,269 |
$ |
192,664 |
$ |
703,311 |
|||||
Test Systems |
|
22,724 |
|
11,176 |
|
19,986 |
|
26,359 |
|
80,245 |
|||||
Total Bookings |
$ |
175,996 |
$ |
183,282 |
$ |
205,255 |
$ |
219,023 |
$ |
783,556 |
|||||
|
|
|
|
|
|
||||||||||
Backlog |
|
|
|
|
|
||||||||||
Aerospace1 |
$ |
513,881 |
$ |
517,240 |
$ |
538,871 |
$ |
554,592 |
|
||||||
Test Systems |
|
90,405 |
|
75,036 |
|
73,586 |
|
78,774 |
|
||||||
Total Backlog |
$ |
604,286 |
$ |
592,276 |
$ |
612,457 |
$ |
633,366 |
|
N/A |
|||||
|
|
|
|
|
|
||||||||||
Book:Bill Ratio |
|
|
|
|
|
||||||||||
Aerospace |
|
1.08 |
|
1.02 |
|
1.13 |
|
1.09 |
|
1.08 |
|||||
Test Systems |
|
1.09 |
|
0.42 |
|
0.93 |
|
1.25 |
|
0.89 |
|||||
Total Book:Bill |
|
1.08 |
|
0.94 |
|
1.11 |
|
1.11 |
|
1.06 |
|||||
| ____________________________ |
1 In November of 2023, a non-core contract manufacturing customer reported within the Aerospace segment declared bankruptcy, and as a result, Aerospace and Total Backlog was reduced by |
View source version on businesswire.com: https://www.businesswire.com/news/home/20240801227455/en/
Company:
David C. Burney, Chief Financial Officer
(716) 805-1599, ext. 159
david.burney@astronics.com
Investor Relations:
Deborah K. Pawlowski, Kei Advisors LLC
(716) 843-3908
dpawlowski@keiadvisors.com
Source: Astronics Corporation