Bank of San Francisco Reports Fourth Quarter and Year Ended December 31, 2025 Financial Results
Rhea-AI Summary
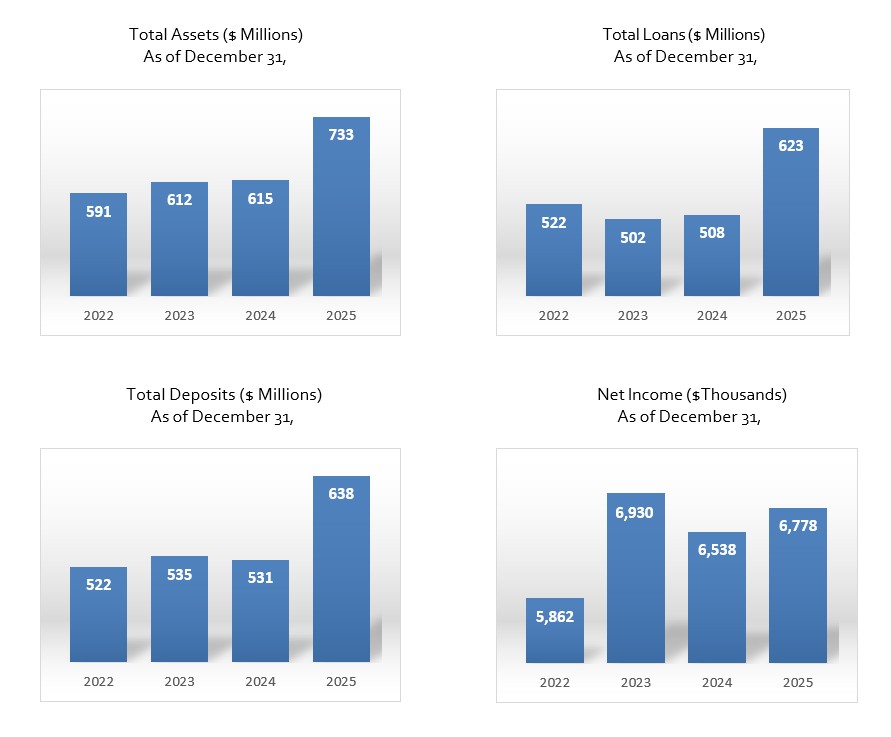
Bank of San Francisco (OTCQX: BSFO) reported unaudited net income of $2.2M and $1.03 diluted EPS for Q4 2025, and net income of $6.8M, or $3.17 diluted EPS for the year ended December 31, 2025.
Key trends: total deposits $637.6M (+20% YoY), total loans $623.0M (+23% YoY), NIM 4.32% for 2025, pre-tax pre-provision income up 17% YoY, and non-performing loans down to 0.09% of assets. The bank opened a new Laurel Village branch and noted higher non-interest expenses tied to hiring and the branch opening.
Positive
- Total loans +23% year-over-year to $623.0M at 12/31/2025
- Total deposits +20% year-over-year to $637.6M at 12/31/2025
- Pre-tax, pre-provision income +17% year-over-year to $10.7M for 2025
- Non-performing loans improved to 0.09% of total assets at 12/31/2025
Negative
- Non-interest expenses +17% year-over-year to $18.7M for 2025
- Quarter non-interest expenses rose ~10% driven by performance compensation, hiring, and branch opening
SAN FRANCISCO, CA / ACCESS Newswire / February 2, 2026 / Bank of San Francisco ("Bank") (OTCQX:BSFO) today reported unaudited net income of
"Our fourth quarter and full-year results reflect the continued execution of our growth strategy and accelerating performance," said William Keller, Chief Executive Officer. "During 2025, the Bank delivered balanced growth, with loans and deposits increasing by
"We are pleased to announce the opening of our Laurel Village office in the Pacific Heights area of San Francisco," said Bill Ward, President and Chief Operating Officer. "This new location is a tangible example of how we approach growth. We expand thoughtfully, where our clients live and work, and invest in teams and infrastructure that allow us to deliver the same high-touch, responsive service no matter our size. We look forward to celebrating the office's official grand opening with the community this spring."
Financial Highlights
Total deposits were
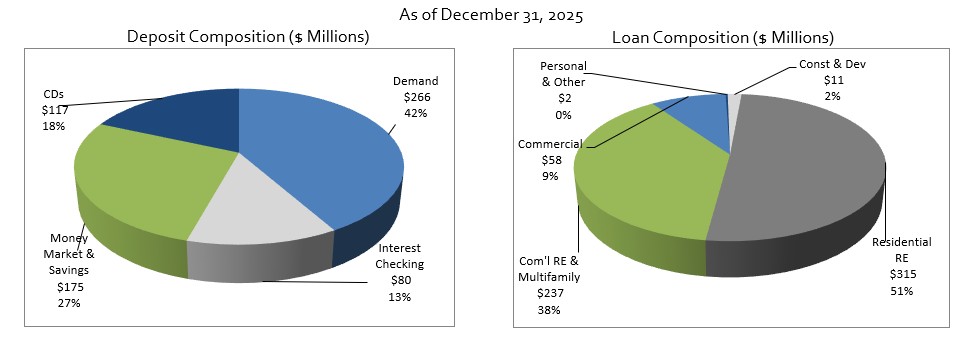
$637.6 million at December 31, 2025, an increase of$31.6 million , or5% from September 30, 2025, and$106.8 million , or20% from December 31, 2024.Non-interest-bearing demand deposits were
$265.5 million at December 31, 2025, an increase of$27.2 million , or11% from September 30, 2025, and$68.0 million , or34% from December 31, 2024. Non-interest-bearing deposits accounted for41.6% of total deposits at December 31, 2025, compared to37.2% at December 31, 2024.Interest-bearing deposits were
$372.1 million at December 31, 2025, an increase of$4.4 million , or1% from September 30, 2025, and$38.9 million , or12% from December 31, 2024. The total cost of funds for the quarter ended December 31, 2025, was1.26% , a decrease of0.01% from the quarter ended September 30, 2025, and a decrease of0.12% from the quarter ended December 31, 2024.Total loans were
$623.0 million at December 31, 2025, an increase of$41.6 million or7% from September 30, 2025, and an increase of$115.1 million , or23% from December 31, 2024. During the year, the portfolio mix shifted slightly toward commercial lending, as loans to finance commercial real estate, including multi-family loans increased to38% of the total loan portfolio at December 31, 2025, compared to30% at December 31, 2024.Credit quality remained strong and improved steadily throughout the year due to payments and the successful resolution of a previously non-performing loan. At December 31, 2025, non-performing loans represented
0.09% of total assets, compared to0.12% at September 30, 2025, and0.22% at December 31, 2024.The net interest margin (NIM) for the year ended December 31, 2025, was
4.32% , compared to3.96% for the year ended December 31, 2024. For the quarter ended December 31, 2025, the NIM was4.44% , compared to4.33% for the quarter ended September 30, 2025.Non-interest expenses for the year ended December 31, 2025, totaled
$18.7 million , an increase of$2.7 million , or17% from the year ended December 31, 2024. Non-interest expenses for the quarter ended December 31, 2025, totaled$5.1 million , an increase of$452,000 , or10% from the quarter ended September 30, 2025, and an increase of$460,000 , or10% from the quarter ended December 31, 2024. The fourth quarter increase was largely driven by performance compensation, new hires, and costs associated with the coming branch opening.Pre-tax, pre-provision income for the year ended December 31, 2025, totaled
$10.7 million ; an increase of$1.6 million , or17% from the year ended December 31, 2024. Pre-tax, pre-provision income for the quarter ended December 31, 2025, totaled$3.3 million , an increase of$357,000 , or12% from the quarter ended September 30, 2025, and an increase of$1.3 million , or64% from the quarter ended December 31, 2024.Total shareholders' equity was
$83.1 million at December 31, 2025, an increase of$2.4 million , or3% from September 30, 2025, and an increase of$7.7 million , or10% from December 31, 2024.Book value per share was
$37.94 at December 31, 2025, an increase of$0.77 , or2% from September 30, 2025, and an increase of$2.69 , or8% from December 31, 2024.The Bank remained well-capitalized, with all capital ratios exceeding regulatory requirements, including a Tier 1 Leverage Ratio of
11.16% , Tier 1 Risk-Based Capital and Common Equity Tier 1 Ratios of16.14% , and a Total Risk-Based Capital Ratio of17.39% .
"The consistency of our results reflects the strength of our culture and our client relationships," Ward added. "Sustained loan and deposit growth, paired with strong credit performance, is the result of teams who know their clients well and serve them exceptionally well."
# # #
Non-GAAP Financial Measure
To supplement our financial statements, which are prepared and presented in accordance with GAAP, we use pre-tax, pre-provision income as a non-GAAP financial measure. Our non-GAAP financial measure does have limitations as analytical tools, and you should not consider pre-tax, pre-provision income in isolation or as a substitute for an analysis of our results under GAAP.
We believe these non-GAAP financial measures provide management and investors with additional information about the financial performance of our business and enable comparison of financial results between periods where certain items may vary independently of business performance. We believe pre-tax, pre-provision income is an important measure because it reflects the financial performance of our business operations. Pre-tax, pre-provision income is a non-GAAP financial measure calculated by subtracting the provision for credit losses and income tax expense from net income.
About Bank of San Francisco
Bank of San Francisco is a locally owned and operated commercial and private bank built on personal relationships and tailored solutions. Since 2005, the Bank has worked with business owners, real estate investors, nonprofits, and families that value direct access to experienced bankers who understand their business and personal needs.
Bank of San Francisco combines high-touch service with select conveniences, including a robust suite of treasury management services, and worldwide ATM fee reimbursement. Growth has been fueled by referrals from long-time loyal clients, colleagues, and community partners. Learn more at www.bankbsf.com.
Forward-Looking Statements
This press release contains certain forward-looking statements that involve risks and uncertainties, including statements relating to new products and anticipated growth. Forward-looking statements are those that are not statements of historical fact and may be identifiable by use of the words "believe," "expect," "intend," "anticipate," "plan," "estimate," "project," or similar expressions. These statements are based on current expectations, estimates and projections about Bank of San Francisco's business based, in part, on assumptions made by management. These statements are not guarantees of future performance and involve risks, uncertainties and assumptions that are difficult to predict. These risks and uncertainties may affect the operations, performance, development, growth, capital needs and results of operations of Bank of San Francisco, and include, but are not limited to, local and national economic conditions; interest rate changes; inflation and monetary policy; changes in the financial performance and/or condition of our loan and deposit clients; changes in the levels of performing and nonperforming assets and charge-offs; timely implementation by Bank of San Francisco of new products and technology enhancements; the impact of competitive products, services and pricing; acts of war, terrorism or civil unrest; the soundness or failure of other financial institutions that may directly or indirectly affect the Bank; potential deposit withdrawals triggered by client concerns following the failures of or risks at other depository institutions; the effect of the COVID-19 pandemic and other infectious illness outbreaks that may arise in the future; natural disasters, such as earthquakes; clients' requirements and preferences; federal, state and local legislation and regulatory developments; the ability to retain or increase market share, retain or grow client relationships and control expenses; changes in regulatory or generally accepted accounting principles and other similar matters. Readers are cautioned not to place undue reliance on forward-looking statements, which are subject to influence by the foregoing risk factors and unanticipated future events. Actual results, accordingly, may differ materially from management expectations. Bank of San Francisco undertakes no obligation to update such forward-looking statements except as required by law.
Bank of San Francisco | ||||||||||||||||||||||||||||
Balance Sheets (Unaudited) | ||||||||||||||||||||||||||||
( | ||||||||||||||||||||||||||||
For the Periods Ended | Year Over Year Change | |||||||||||||||||||||||||||
Assets | 12/31/2025 | 9/30/2025 | 6/30/2025 | 3/31/2025 | 12/31/2024 | $ | % | |||||||||||||||||||||
Cash and due from banks | $ | 10,899 | $ | 6,604 | $ | 8,754 | $ | 9,076 | $ | 6,023 | $ | 4,876 | 81 | % | ||||||||||||||
Interest bearing deposits in banks | 60,827 | 74,188 | 78,541 | 69,116 | 69,200 | (8,373 | ) | -12 | % | |||||||||||||||||||
Total cash and cash equivalents | 71,726 | 80,792 | 87,295 | 78,192 | 75,223 | (3,497 | ) | -5 | % | |||||||||||||||||||
Securities available-for-sale, at fair value | 26,025 | 25,038 | 21,859 | 21,819 | 23,623 | 2,402 | 10 | % | ||||||||||||||||||||
Loans, net of deferred costs/fees | 623,030 | 581,443 | 550,910 | 530,817 | 507,970 | 115,060 | 23 | % | ||||||||||||||||||||
Allowance for credit losses | (7,659 | ) | (7,518 | ) | (7,258 | ) | (6,968 | ) | (6,662 | ) | (997 | ) | 15 | % | ||||||||||||||
Loans, net of allowance of credit losses | 615,371 | 573,925 | 543,652 | 523,849 | 501,308 | 114,063 | 23 | % | ||||||||||||||||||||
Premises and equipment, net | 2,590 | 1,632 | 1,501 | 1,351 | 1,411 | 1,179 | 84 | % | ||||||||||||||||||||
Accrued interest receivable & other assets | 17,342 | 17,021 | 17,608 | 13,696 | 13,872 | 3,470 | 25 | % | ||||||||||||||||||||
Total Assets | $ | 733,054 | $ | 698,408 | $ | 671,915 | $ | 638,907 | $ | 615,437 | $ | 117,617 | 19 | % | ||||||||||||||
Liabilities | ||||||||||||||||||||||||||||
Non-interest bearing deposits | $ | 265,492 | $ | 238,330 | $ | 229,036 | $ | 199,783 | $ | 197,533 | $ | 67,959 | 34 | % | ||||||||||||||
Interest bearing deposits | 372,073 | 367,669 | 353,188 | 353,748 | 333,202 | 38,871 | 12 | % | ||||||||||||||||||||
Total deposits | 637,565 | 605,999 | 582,224 | 553,531 | 530,735 | 106,830 | 20 | % | ||||||||||||||||||||
Accrued interest payable and other liabilities | 12,432 | 11,795 | 11,171 | 8,634 | 9,381 | 3,051 | 33 | % | ||||||||||||||||||||
Total Liabilities | 649,997 | 617,794 | 593,395 | 562,165 | 540,116 | 109,881 | 20 | % | ||||||||||||||||||||
Shareholders' equity | ||||||||||||||||||||||||||||
Common stock | 29,490 | 29,261 | 29,075 | 28,944 | 28,757 | 733 | 3 | % | ||||||||||||||||||||
Retained earnings | 53,521 | 51,309 | 49,475 | 47,841 | 46,743 | 6,778 | 15 | % | ||||||||||||||||||||
Accumulated other comprehensive income | 46 | 44 | (30 | ) | (43 | ) | (179 | ) | 225 | -126 | % | |||||||||||||||||
Total shareholders' equity | 83,057 | 80,614 | 78,520 | 76,742 | 75,321 | 7,736 | 10 | % | ||||||||||||||||||||
Total Liabilities & Shareholders' Equity | $ | 733,054 | $ | 698,408 | $ | 671,915 | $ | 638,907 | $ | 615,437 | $ | 117,617 | 19 | % | ||||||||||||||
Book Value per Common Share | $ | 37.94 | $ | 37.17 | $ | 36.33 | $ | 35.35 | $ | 35.25 | $ | 2.69 | 8 | % | ||||||||||||||
Total Common Shares Outstanding | 2,188,985 | 2,168,841 | 2,161,024 | 2,170,866 | 2,136,822 | 52,163 | 2 | % | ||||||||||||||||||||
Capital Ratios | ||||||||||||||||||||||||||||
Tier 1 Leverage ratio | 11.16 | % | 11.54 | % | 11.83 | % | 11.41 | % | 12.05 | % | -0.89 | % | -7 | % | ||||||||||||||
Tier 1 RBC ratio | 16.14 | % | 17.08 | % | 17.68 | % | 18.16 | % | 18.69 | % | -2.55 | % | -14 | % | ||||||||||||||
Common Equity Tier 1 RBC ratio | 16.14 | % | 17.08 | % | 17.68 | % | 18.16 | % | 18.69 | % | -2.55 | % | -14 | % | ||||||||||||||
Total Risk-Based Capital (RBC) ratio | 17.39 | % | 18.34 | % | 18.93 | % | 19.41 | % | 19.95 | % | -2.56 | % | -13 | % | ||||||||||||||
Other Ratios | ||||||||||||||||||||||||||||
Non-interest bearing to Total Deposits | 41.64 | % | 39.33 | % | 39.34 | % | 36.09 | % | 37.22 | % | 4.42 | % | 12 | % | ||||||||||||||
Loan to Deposit ratio | 97.72 | % | 95.95 | % | 94.62 | % | 95.90 | % | 95.71 | % | 2.01 | % | 2 | % | ||||||||||||||
Allowance for Credit Losses to Total Loans | 1.23 | % | 1.29 | % | 1.32 | % | 1.31 | % | 1.31 | % | -0.08 | % | -6 | % | ||||||||||||||
ACL to Nonperforming Loans | 1099.23 | % | 868.68 | % | 642.31 | % | 593.21 | % | 490.61 | % | 608.62 | % | 124 | % | ||||||||||||||
Nonperforming Assets to Total Assets | 0.09 | % | 0.12 | % | 0.17 | % | 0.18 | % | 0.22 | % | -0.13 | % | -58 | % | ||||||||||||||
n/m - Not Meaningful | ||||||||||||||||||||||||||||
Bank of San Francisco | ||||||||||||||||||||||||||||
Statement of Income (Unaudited) | ||||||||||||||||||||||||||||
( | ||||||||||||||||||||||||||||
Three Months Ended | ||||||||||||||||||||||||||||
12/31/2025 | 9/30/2025 | 6/30/2025 | 3/31/2025 | 12/31/2024 | $ | % | ||||||||||||||||||||||
Interest on loans, including fees | $ | 8,904 | $ | 8,048 | $ | 7,596 | $ | 7,071 | $ | 7,152 | $ | 1,752 | 24 | % | ||||||||||||||
Interest on deposits in banks | 968 | 1,021 | 928 | 677 | 881 | 87 | 10 | % | ||||||||||||||||||||
Interest on investment securities | 247 | 208 | 210 | 221 | 217 | 30 | 14 | % | ||||||||||||||||||||
Other interest income | 79 | 77 | 72 | 74 | 74 | 5 | 7 | % | ||||||||||||||||||||
Total interest income | 10,198 | 9,354 | 8,806 | 8,043 | 8,324 | 1,874 | 23 | % | ||||||||||||||||||||
Deposits interest expense | 2,054 | 1,936 | 1,868 | 1,719 | 1,878 | 176 | 9 | % | ||||||||||||||||||||
Net interest income | 8,144 | 7,418 | 6,938 | 6,324 | 6,446 | 1,698 | 26 | % | ||||||||||||||||||||
Provision (reversal) for credit losses | 300 | 330 | 290 | 300 | (320 | ) | 620 | -194 | % | |||||||||||||||||||
Net interest income after provision | 7,844 | 7,088 | 6,648 | 6,024 | 6,766 | 1,078 | 16 | % | ||||||||||||||||||||
Service charges on deposits | 129 | 111 | 108 | 102 | 112 | 17 | 15 | % | ||||||||||||||||||||
Other non-interest income | 80 | 15 | (5 | ) | 61 | 46 | 34 | 74 | % | |||||||||||||||||||
Total non-interest income | 209 | 126 | 103 | 163 | 158 | 51 | 32 | % | ||||||||||||||||||||
Salaries and employee benefits expense | 3,258 | 2,720 | 2,885 | 3,033 | 3,144 | 114 | 4 | % | ||||||||||||||||||||
Occupancy | 372 | 366 | 336 | 291 | 303 | 69 | 23 | % | ||||||||||||||||||||
Information Technology and Equipment | 342 | 340 | 324 | 315 | 301 | 41 | 14 | % | ||||||||||||||||||||
Other operating expense | 1,087 | 1,181 | 880 | 984 | 851 | 236 | 28 | % | ||||||||||||||||||||
Total non-interest expense | 5,059 | 4,607 | 4,425 | 4,623 | 4,599 | 460 | 10 | % | ||||||||||||||||||||
Income before income taxes | 2,994 | 2,607 | 2,326 | 1,564 | 2,325 | 669 | 29 | % | ||||||||||||||||||||
Income tax expense | 783 | 772 | 692 | 466 | 697 | 86 | 12 | % | ||||||||||||||||||||
Net income | $ | 2,211 | $ | 1,835 | $ | 1,634 | $ | 1,098 | $ | 1,628 | $ | 583 | 36 | % | ||||||||||||||
Basic Earnings per Share | $ | 1.05 | $ | 0.87 | $ | 0.78 | $ | 0.53 | $ | 0.78 | $ | 0.27 | 35 | % | ||||||||||||||
Average Shares Outstanding | 2,109,522 | 2,108,663 | 2,097,194 | 2,090,394 | 2,089,978 | 19,544 | 1 | % | ||||||||||||||||||||
Diluted Earnings per Share | $ | 1.03 | $ | 0.86 | $ | 0.77 | $ | 0.52 | $ | 0.77 | $ | 0.26 | 34 | % | ||||||||||||||
Average Shares Outstanding | 2,136,558 | 2,134,102 | 2,124,402 | 2,130,962 | 2,110,598 | 25,960 | 1 | % | ||||||||||||||||||||
Annualized Performance Ratios | ||||||||||||||||||||||||||||
Return on Average Assets | 1.19 | % | 1.05 | % | 0.98 | % | 0.70 | % | 1.06 | % | 0.13 | % | 12 | % | ||||||||||||||
Return on Average Common Equity | 10.81 | % | 9.22 | % | 8.32 | % | 5.78 | % | 8.86 | % | 1.95 | % | 22 | % | ||||||||||||||
Net Interest Margin | 4.44 | % | 4.33 | % | 4.28 | % | 4.19 | % | 4.18 | % | 0.26 | % | 6 | % | ||||||||||||||
Cost of Funds | 1.26 | % | 1.27 | % | 1.30 | % | 1.30 | % | 1.38 | % | -0.12 | % | -9 | % | ||||||||||||||
Efficiency Ratio | 60.57 | % | 61.07 | % | 62.85 | % | 71.27 | % | 69.64 | % | -9.07 | % | -13 | % | ||||||||||||||
n/m - Not Meaningful | ||||||||||||||||||||||||||||
Reconciliation of GAAP to Non-GAAP Financial Measures | ||||||||||||||||||||||||||||
Net income | $ | 2,211 | $ | 1,835 | $ | 1,634 | $ | 1,098 | $ | 1,628 | $ | 583 | 36 | % | ||||||||||||||
Provision (reversal) for credit losses | 300 | 330 | 290 | 300 | (320 | ) | 620 | -194 | % | |||||||||||||||||||
Income tax expense | 783 | 772 | 692 | 466 | 697 | 86 | 12 | % | ||||||||||||||||||||
Pre-tax, pre-provision income | $ | 3,294 | $ | 2,937 | $ | 2,616 | $ | 1,864 | $ | 2,005 | $ | 1,289 | 64 | % | ||||||||||||||
Bank of San Francisco | ||||||||||||||||
Statement of Income (Unaudited) | ||||||||||||||||
( | ||||||||||||||||
Twelve Months Ended | Year Over Year Change | |||||||||||||||
12/31/2025 | 12/31/2024 | $ | % | |||||||||||||
Interest on loans, including fees | $ | 31,619 | $ | 27,679 | $ | 3,940 | 14 | % | ||||||||
Interest on deposits in banks | 3,594 | 4,794 | (1,200 | ) | -25 | % | ||||||||||
Interest on investment securities | 886 | 283 | 603 | 213 | % | |||||||||||
Other interest income | 302 | 294 | 8 | 3 | % | |||||||||||
Total interest income | 36,401 | 33,050 | 3,351 | 10 | % | |||||||||||
Deposits interest expense | 7,577 | 8,881 | (1,304 | ) | -15 | % | ||||||||||
Net interest income | 28,824 | 24,169 | 4,655 | 19 | % | |||||||||||
Provision (Reversal) for credit losses | 1,220 | (180 | ) | 1,400 | -778 | % | ||||||||||
Net interest income after provision | 27,604 | 24,349 | 3,255 | 13 | % | |||||||||||
Service charges on deposits | 450 | 395 | 55 | 14 | % | |||||||||||
Gains on sale of loans | - | 306 | (306 | ) | -100 | % | ||||||||||
Other non-interest income | 151 | 229 | (78 | ) | -34 | % | ||||||||||
Total non-interest income | 601 | 930 | (329 | ) | -35 | % | ||||||||||
Salaries and employee benefits expense | 11,896 | 10,542 | 1,354 | 13 | % | |||||||||||
Occupancy | 1,365 | 1,239 | 126 | 10 | % | |||||||||||
Information Technology and Equipment | 1,321 | 1,208 | 113 | 9 | % | |||||||||||
Other operating expense | 4,132 | 2,982 | 1,150 | 39 | % | |||||||||||
Total non-interest expense | 18,714 | 15,971 | 2,743 | 17 | % | |||||||||||
Income before income taxes | 9,491 | 9,308 | 183 | 2 | % | |||||||||||
Income tax expense | 2,713 | 2,770 | (57 | ) | -2 | % | ||||||||||
Net income | $ | 6,778 | $ | 6,538 | $ | 240 | 4 | % | ||||||||
Basic Earnings per Share | $ | 3.22 | $ | 3.14 | $ | 0.08 | 3 | % | ||||||||
Average Shares Outstanding | 2,103,241 | 2,084,423 | 18,818 | 1 | % | |||||||||||
Diluted Earnings per Share | $ | 3.17 | $ | 3.10 | $ | 0.07 | 2 | % | ||||||||
Average Shares Outstanding | 2,140,169 | 2,107,815 | 32,354 | 2 | % | |||||||||||
Annualized Performance Ratios | ||||||||||||||||
Return on Average Assets | 0.99 | % | 1.05 | % | -0.06 | % | -6 | % | ||||||||
Return on Average Common Equity | 8.56 | % | 9.10 | % | -0.54 | % | -6 | % | ||||||||
Net Interest Margin | 4.32 | % | 3.96 | % | 0.36 | % | 9 | % | ||||||||
Cost of Funds | 1.28 | % | 1.63 | % | -0.35 | % | -21 | % | ||||||||
Efficiency Ratio | 63.60 | % | 63.63 | % | -0.03 | % | 0 | % | ||||||||
n/m - Not Meaningful | ||||||||||||||||
Reconciliation of GAAP to Non-GAAP Financial Measures | ||||||||||||||||
Net income | $ | 6,778 | $ | 6,538 | $ | 240 | 4 | % | ||||||||
Provision (reversal) for credit losses | 1,220 | (180 | ) | 1,400 | -778 | % | ||||||||||
Income tax expense | 2,713 | 2,770 | (57 | ) | -2 | % | ||||||||||
Pre-tax, pre-provision income | $ | 10,711 | $ | 9,128 | $ | 1,583 | 17 | % | ||||||||
Media Contact
Leslie Katter
media@bankbsf.com
SOURCE: Bank of San Francisco
View the original press release on ACCESS Newswire