International passenger traffic up 4.5% YoY; up 1.2% YoY in Argentina
LUXEMBOURG--(BUSINESS WIRE)--
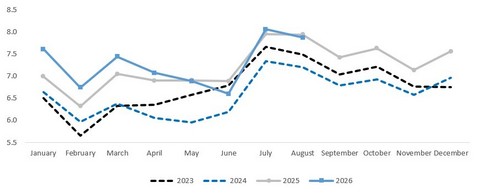
Corporación América Airports S.A. (NYSE: CAAP), (“CAAP” or the “Company”), one of the world’s leading private airport operators, reported today a 0.9% year-on-year (YoY) decrease in passenger traffic in August 2026.
Monthly Passenger Traffic Performance (In million PAX)
Passenger Traffic, Cargo Volume and Aircraft Movements Highlights (2026 vs. 2025)
Statistics
Aug'26
Aug'25
% Var.
YTD’26
YTD’25
% Var.
Domestic Passengers (thousands)
3,669
3,963
-7.4%
27,585
29,020
-4.9%
International Passengers (thousands)
3,378
3,231
4.5%
24,611
22,672
8.6%
Transit Passengers (thousands)
824
746
10.4%
6,099
5,253
16.1%
Total Passengers (thousands)
7,871
7,940
-0.9%
58,294
56,944
2.4%
Cargo Volume (thousand tons)
29
30
-1.8%
255
254
0.4%
Total Aircraft Movements (thousands)
75
78
-3.5%
573
577
-0.7%
Passenger Traffic Overview
Total passenger traffic decreased by 0.9% in August compared to the same month in 2025. Overall traffic performance was supported by double-digit growth in Armenia and continued growth in Uruguay, Italy, Ecuador, Brazil, and Argentina's international operations, partially offset by weaker domestic traffic in Argentina. Domestic traffic declined by 7.4% year over year, primarily reflecting lower traffic in Argentina and Brazil, as well as, to a lesser extent, declines in Ecuador and Italy. International traffic increased by 4.5%, with all operating countries posting year-over-year growth, except for Brazil, where international traffic represents less than 5% of total traffic.
In Argentina, total passenger traffic declined 5.3% year over year in August, as lower domestic traffic more than offset growth in international traffic. Domestic traffic decreased 8.4% year over year, improving from a 9.9% YoY decline in July, and continued to be impacted by lower capacity, mainly reflecting the contraction in Flybondi’s operations. Nevertheless, load factors remained above last year’s levels, indicating resilient demand despite the reduction in capacity. Meanwhile, capacity is being reallocated between Aerolíneas Argentinas and JetSMART, helping to partially offset the impact of Flybondi’s contraction on the overall domestic market. The top three domestic destinations were Bariloche, Iguazú, and Córdoba, all with load factors ranging from 83% to 94%. International traffic increased by 1.2% YoY, despite fewer aircraft movements, as higher capacity per operation and improved load factors continued to support traffic growth, pointing to resilient demand. In terms of capacity dynamics, LATAM and JetSMART more than offset the decline in GOL and Aerolíneas Argentinas, which has been prioritizing its domestic operations as part of its strategic focus. Meanwhile, Iberia recorded its highest monthly traffic ever. The top three international destinations during the month were Santiago de Chile, São Paulo, and Madrid.
In Italy, passenger traffic increased 3.0% year over year, driven by growth in the international segment. International traffic, which represented more than 80% of total passenger traffic, grew 4.2%, supported by strong demand at both airports, led by Pisa International Airport. Meanwhile, domestic traffic declined 1.7% year over year, primarily due to lower volumes at Florence Airport, where the domestic segment accounts for 12% of total passenger traffic.
In Brazil, total passenger traffic increased by 0.5% year over year. Domestic traffic, which accounted for over 50% of total traffic, declined by 6.5% year over year, while transit passengers increased by a strong 12.0% year over year. Among other developments, LATAM launched a new route connecting Brasília and São José do Rio Preto, initially operating three weekly frequencies and increasing to daily service as of October 25, 2025. Brasília International Airport continues to benefit from its position as a key secondary hub within the domestic network.
In Uruguay, total passenger traffic, predominantly international, increased 4.7% year over year. During August, Arajet announced a new nonstop route between Montevideo and Punta Cana, scheduled to launch in March 2027 with three weekly frequencies, further expanding the country’s international connectivity.
In Ecuador, passenger traffic increased 0.6% year over year, although ongoing security concerns continued to weigh on travel demand. International traffic increased 4.5%, supported by strong demand on U.S. routes, the launch of new services by Avianca, JetBlue, and LATAM Airlines, as well as additional frequencies operated by American Airlines. Domestic traffic, however, declined 4.2% year over year, as elevated airfares continued to constrain demand.
In Armenia, passenger traffic increased by a strong 14.1% year over year despite disruptions related to the conflict in Iran, which resulted in flight cancellations and airspace restrictions across the region. However, the impact proved to be more limited than initially expected, as strong demand from Western and Eastern Europe, Asia, and Russia continued to support overall traffic growth. In addition, Wizz Air recently announced the launch of three new routes from Yerevan to Basel, Valencia, and Varna, starting in December 2026. With these additions, Wizz Air will offer service to 22 destinations from Yerevan, further strengthening the airport’s connectivity and supporting its growth outlook.
Cargo Volume and Aircraft Movements
Cargo volume, decreased by 1.8% year over year, with declines in all countries of operation, except Argentina. By country, performance was as follows: Argentina (+10.0%), Brazil (-19.9%), Italy (-6.9%), Uruguay (-6.0%), Ecuador (-0.3%), and Armenia (-25.8%). Argentina, Brazil, and Ecuador accounted for over 80% of total cargo volumes in August.
Aircraft movements declined by 3.5% year over year, as positive contributions from Armenia, Uruguay and Italy, were more than offset by declines in Brazil, Ecuador and Argentina. Performance by country was as follows: Armenia (+9.5%), Uruguay (+6.3%), Italy (+3.6%), Argentina (-8.0%), Brazil (-2.2%), and Ecuador (-0.7%). Argentina, Brazil, and Italy accounted for more than 80% of total aircraft movements in August.
Summary Passenger Traffic, Cargo Volume and Aircraft Movements (2026 vs. 2025)
Aug'26
Aug'25
% Var.
YTD'26
YTD'25
% Var.
Passenger Traffic (thousands)
Argentina
3,854
4,069
-5.3%
30,687
31,063
-1.2%
Italy
1,100
1,068
3.0%
7,007
6,654
5.3%
Brazil
1,514
1,506
0.5%
11,490
10,744
7.0%
Uruguay
175
167
4.7%
1,571
1,524
3.1%
Ecuador
453
450
0.6%
3,281
3,176
3.3%
Armenia
775
679
14.1%
4,258
3,783
12.6%
TOTAL
7,871
7,940
-0.9%
58,294
56,944
2.4%
Cargo Volume (tons)
Argentina
16,995
15,450
10.0%
138,149
132,299
4.4%
Italy
696
747
-6.9%
7,078
8,350
-15.2%
Brazil
3,998
4,993
-19.9%
39,927
41,178
-3.0%
Uruguay
2,386
2,537
-6.0%
21,662
22,859
-5.2%
Ecuador
2,765
2,775
-0.3%
22,312
24,035
-7.2%
Armenia
2,517
3,392
-25.8%
25,999
25,270
2.9%
TOTAL
29,357
29,893
-1.8%
255,127
253,992
0.4%
Aircraft Movements
Argentina
37,940
41,253
-8.0%
304,800
315,311
-3.3%
Italy
9,455
9,125
3.6%
62,359
60,064
3.8%
Brazil
13,446
13,742
-2.2%
101,389
98,405
3.0%
Uruguay
2,318
2,181
6.3%
21,954
21,998
-0.2%
Ecuador
6,960
7,011
-0.7%
51,388
52,672
-2.4%
Armenia
5,214
4,760
9.5%
30,638
28,370
8.0%
TOTAL
75,333
78,072
-3.5%
572,528
576,820
-0.7%
About Corporación América Airports
Corporación América Airports acquires, develops and operates airport concessions. Currently, the Company operates 52 airports in 6 countries across Latin America and Europe (Argentina, Brazil, Uruguay, Ecuador, Armenia and Italy). In 2025, Corporación América Airports served 86.7 million passengers, 9.8% above the 79.0 million passengers served in 2024. The Company is listed on the New York Stock Exchange where it trades under the ticker “CAAP”. For more information, visit http://investors.corporacionamericaairports.com.
Load factors measure how much of a company’s available capacity is actually being used, expressed as a percentage. Think of it like the share of seats filled on a bus or oven space in a bakery: higher load factor means more of the product or service is being sold relative to what could be offered. For investors, it signals operational efficiency and revenue potential—high load factors usually boost profit margins and lower per-unit costs, while low ones can warn of wasted capacity or weak demand.
aircraft movementstechnical
Aircraft movements are the count of individual airplane takeoffs and landings at an airport or airfield, and may also include practice touch-and-goes or overflights depending on how the airport reports them. For investors this is a simple activity measure—like counting cars through a toll booth—that signals demand for passenger and cargo travel, airport revenue opportunities (fees, retail, parking, fuel) and broader local economic activity, so rising or falling movements can affect valuations and forecasts.