Corporación América Airports S.A. Reports February 2024 Passenger Traffic
Total passenger traffic up
International passenger traffic
LUXEMBOURG--(BUSINESS WIRE)--
Corporación América Airports S.A. (NYSE: CAAP), (“CAAP” or the “Company”), one of the leading private airport operators in the world, reported today a
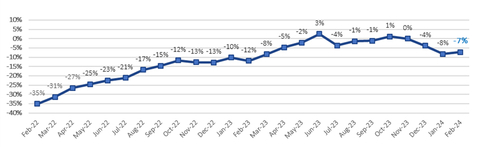
2-Year Passenger Traffic Monthly Performance (vs. 2019) (Graphic: Business Wire)
Passenger Traffic, Cargo Volume and Aircraft Movements Highlights (2024 vs. 2023) |
|||||||||
Statistics |
Feb'24 |
Feb'23 |
% Var. |
|
YTD’24 |
YTD'23 |
% Var. |
||
Domestic Passengers (thousands) |
3,219 |
3,241 |
-0.7 |
% |
|
6,829 |
6,880 |
-0.7 |
% |
International Passengers (thousands) |
2,197 |
1,899 |
15.7 |
% |
|
4,583 |
4,035 |
13.6 |
% |
Transit Passengers (thousands) |
546 |
519 |
5.3 |
% |
|
1,189 |
1,250 |
-4.9 |
% |
Total Passengers (thousands) |
5,962 |
5,659 |
5.4 |
% |
|
12,602 |
12,166 |
3.6 |
% |
Cargo Volume (thousand tons) |
28.1 |
25.4 |
10.6 |
% |
|
56.6 |
51.7 |
9.5 |
% |
Total Aircraft Movements (thousands) |
62.9 |
60.6 |
3.9 |
% |
|
132.7 |
129.7 |
2.3 |
% |
Passenger Traffic, Cargo Volume and Aircraft Movements Highlights (2024 vs. 2019) |
|||||||||
Statistics |
Feb'24 |
Feb'19 |
% Var. |
|
YTD’24 |
YTD'19 |
% Var. |
||
Domestic Passengers (thousands) |
3,219 |
3,590 |
-10.3 |
% |
|
6,829 |
7,600 |
-10.1 |
% |
International Passengers (thousands) |
2,197 |
2,107 |
4.2 |
% |
|
4,583 |
4,487 |
2.1 |
% |
Transit Passengers (thousands) |
546 |
729 |
-25.1 |
% |
|
1,189 |
1,578 |
-24.7 |
% |
Total Passengers (thousands) |
5,962 |
6,426 |
-7.2 |
% |
|
12,602 |
13,666 |
-7.8 |
% |
Cargo Volume (thousand tons) |
28.1 |
33.8 |
-17.0 |
% |
|
56.6 |
66.8 |
-15.2 |
% |
Total Aircraft Movements (thousands) |
62.9 |
66.5 |
-5.4 |
% |
|
132.7 |
141.2 |
-6.0 |
% |
Passenger Traffic Overview
Total passenger traffic grew
In
In
In
In
In
In
Cargo Volume and Aircraft Movements
Cargo volume increased
Aircraft movements increased
Summary Passenger Traffic, Cargo Volume and Aircraft Movements (2024 vs. 2023) |
|||||||||
|
Feb'24 |
Feb'23 |
% Var. |
|
YTD'24 |
YTD'23 |
% Var. |
||
Passenger Traffic (thousands) |
|
|
|
|
|
|
|
||
|
3,461 |
3,204 |
8.0 |
% |
|
7,200 |
6,789 |
6.1 |
% |
|
442 |
386 |
14.7 |
% |
|
902 |
809 |
11.5 |
% |
|
1,192 |
1,252 |
-4.8 |
% |
|
2,690 |
2,844 |
-5.4 |
% |
|
206 |
154 |
33.9 |
% |
|
437 |
337 |
29.8 |
% |
|
352 |
344 |
2.2 |
% |
|
697 |
705 |
-1.1 |
% |
|
308 |
319 |
-3.4 |
% |
|
676 |
682 |
-0.8 |
% |
TOTAL |
5,962 |
5,659 |
5.4 |
% |
|
12,602 |
12,166 |
3.6 |
% |
(1) Following the friendly termination process concluded in February 2024, CAAP no longer operates Natal airport. Statistics for Natal are available up to February 18, 2024.
|
|||||||||
Cargo Volume (tons) |
|
|
|
||||||
|
14,173 |
12,736 |
11.3 |
% |
|
29,643 |
26,095 |
13.6 |
% |
|
1,009 |
1,056 |
-4.5 |
% |
|
2,037 |
2,108 |
-3.3 |
% |
|
4,999 |
4,839 |
3.3 |
% |
|
9,652 |
9,796 |
-1.5 |
% |
|
2,275 |
2,076 |
9.6 |
% |
|
4,297 |
4,061 |
5.8 |
% |
|
2,712 |
2,434 |
11.4 |
% |
|
5,665 |
5,181 |
9.3 |
% |
|
2,916 |
2,257 |
29.2 |
% |
|
5,345 |
4,505 |
18.7 |
% |
TOTAL |
28,083 |
25,398 |
10.6 |
% |
|
56,640 |
51,746 |
9.5 |
% |
Aircraft Movements |
|
|
|
|
|
|
|
||
|
36,174 |
33,554 |
7.8 |
% |
|
75,526 |
71,196 |
6.1 |
% |
|
4,046 |
3,732 |
8.4 |
% |
|
8,405 |
7,845 |
7.1 |
% |
|
11,394 |
11,711 |
-2.7 |
% |
|
24,059 |
25,313 |
-5.0 |
% |
|
2,978 |
2,712 |
9.8 |
% |
|
6,813 |
6,479 |
5.2 |
% |
|
5,986 |
6,099 |
-1.9 |
% |
|
12,580 |
12,730 |
-1.2 |
% |
|
2,365 |
2,765 |
-14.5 |
% |
|
5,326 |
6,145 |
-13.3 |
% |
TOTAL |
62,943 |
60,573 |
3.9 |
% |
|
132,709 |
129,708 |
2.3 |
% |
Summary Passenger Traffic, Cargo Volume and Aircraft Movements (2024 vs. 2019) |
|||||||||
|
Feb'24 |
Feb'19 |
% Var. |
|
YTD'24 |
YTD'19 |
% Var. |
||
Passenger Traffic (thousands) |
|
|
|
|
|
|
|
||
|
3,461 |
3,509 |
-1.4 |
% |
|
7,200 |
7,362 |
-2.2 |
% |
|
442 |
429 |
3.0 |
% |
|
902 |
889 |
1.4 |
% |
|
1,192 |
1,521 |
-21.6 |
% |
|
2,690 |
3,387 |
-20.6 |
% |
|
206 |
211 |
-2.5 |
% |
|
437 |
458 |
-4.5 |
% |
|
352 |
342 |
2.9 |
% |
|
697 |
695 |
0.3 |
% |
|
308 |
167 |
85.1 |
% |
|
676 |
379 |
78.6 |
% |
|
|
247 |
- |
|
|
- |
496 |
- |
|
TOTAL |
5,962 |
6,426 |
-7.2 |
% |
|
12,602 |
13,666 |
-7.8 |
% |
(1) Following the friendly termination process concluded in February 2024, CAAP no longer operates Natal airport. Statistics for Natal are available up to February 18, 2024.
|
|||||||||
Cargo Volume (tons) |
|
|
|
||||||
|
14,173 |
17,067 |
-17.0 |
% |
|
29,643 |
35,911 |
-17.5 |
% |
|
1,009 |
990 |
1.9 |
% |
|
2,037 |
2,017 |
1.0 |
% |
|
4,999 |
8,441 |
-40.8 |
% |
|
9,652 |
14,483 |
-33.4 |
% |
|
2,275 |
1,916 |
18.8 |
% |
|
4,297 |
4,036 |
6.5 |
% |
|
2,712 |
3,626 |
-25.2 |
% |
|
5,665 |
7,358 |
-23.0 |
% |
|
2,916 |
1,368 |
113.2 |
% |
|
5,345 |
2,227 |
140.0 |
% |
|
- |
418 |
- |
|
|
- |
787 |
- |
|
TOTAL |
28,083 |
33,824 |
-17.0 |
% |
|
56,640 |
66,820 |
-15.2 |
% |
Aircraft Movements |
|
|
|
|
|
|
|
||
|
36,174 |
36,403 |
-0.6 |
% |
|
75,526 |
76,543 |
-1.3 |
% |
|
4,046 |
4,302 |
-6.0 |
% |
|
8,405 |
8,946 |
-6.0 |
% |
|
11,394 |
12,710 |
-10.4 |
% |
|
24,059 |
27,380 |
-12.1 |
% |
|
2,978 |
2,848 |
4.6 |
% |
|
6,813 |
6,789 |
0.4 |
% |
|
5,986 |
6,545 |
-8.5 |
% |
|
12,580 |
13,699 |
-8.2 |
% |
|
2,365 |
1,552 |
52.4 |
% |
|
5,326 |
3,500 |
52.2 |
% |
|
- |
2,174 |
- |
|
|
- |
4,338 |
- |
|
TOTAL |
62,943 |
66,534 |
-5.4 |
% |
|
132,709 |
141,195 |
-6.0 |
% |
About Corporación América Airports
Corporación América Airports acquires, develops and operates airport concessions. Currently, the Company operates 52 airports in 6 countries across
View source version on businesswire.com: https://www.businesswire.com/news/home/20240319105096/en/
Patricio Iñaki Esnaola
Email: patricio.esnaola@caairports.com
Phone: +5411 4899-6716
Source: Corporación América Airports