Corporación América Airports S.A. Reports October 2023 Passenger Traffic
Corporación América Airports S.A. (CAAP) reports a 14.5% YoY increase in passenger traffic in October 2023, surpassing October 2019 levels by 1.2%. International passengers up 20.3% and cargo volume up 7.9% YoY.
Positive
Corporación América Airports S.A. (CAAP) experienced a significant 14.5% year-on-year (YoY) increase in passenger traffic in October 2023, surpassing October 2019 levels by 1.2%.
International passengers showed a remarkable 20.3% increase, highlighting the recovery in travel demand and the gradual resumption of routes and frequencies across all countries of operations.
Cargo volume also saw a positive 7.9% YoY growth, reflecting an overall recovery in the aviation industry.
11/21/2023 - 04:31 PM
Total passenger traffic up 14.5% YoY and 1.2% above pre-pandemic levels
All countries except Brazil above October 2019 levels
Aircraft movements 1.9% above October 2019
LUXEMBOURG--(BUSINESS WIRE)--
Corporación América Airports S.A. (NYSE: CAAP), (“CAAP” or the “Company”), one of the leading private airport operators in the world, reported today a 14.5% year-on-year (YoY) increase in passenger traffic in October 2023, surpassing October 2019 levels by 1.2% .
This press release features multimedia. View the full release here: https://www.businesswire.com/news/home/20231121975207/en/
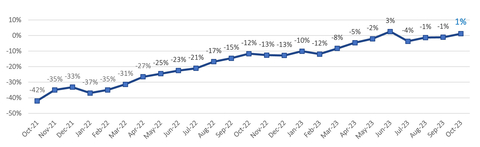
2-Year Passenger Traffic Monthly Performance (vs. 2019) (Graphic: Business Wire)
Passenger Traffic, Cargo Volume and Aircraft Movements Highlights (2023 vs. 2022)
Statistics
Oct'23
Oct'22
% Var.
YTD’23
YTD'22
% Var.
Domestic Passengers (thousands)
4,043
3,470
16.5%
37,899
30,935
22.5%
International Passengers (thousands)
2,587
2,151
20.3%
23,859
17,498
36.4%
Transit Passengers (thousands)
582
676
-14.0%
5,880
5,122
14.8%
Total Passengers (thousands)
7,212
6,297
14.5%
67,638
53,554
26.3%
Cargo Volume (thousand tons)
33.1
30.7
7.9%
301.7
281.3
7.3%
Total Aircraft Movements (thousands)
74.0
67.6
9.4%
713.9
605.4
17.9%
Passenger Traffic, Cargo Volume and Aircraft Movements Highlights (2023 vs. 2019)
Statistics
Oct'23
Oct'19
% Var.
YTD’23
YTD'19(1)(2)
% Var.
Domestic Passengers (thousands)
4,043
4,035
0.2%
37,899
39,498
-4.0%
International Passengers (thousands)
2,587
2,378
8.8%
23,859
23,968
-0.5%
Transit Passengers (thousands)
582
717
-18.8%
5,880
6,915
-15.0%
Total Passengers (thousands)
7,212
7,130
1.2%
67,638
70,381
-3.9%
Cargo Volume (thousand tons)
33.1
38.8
-14.7%
301.7
348.9
-13.5%
Total Aircraft Movements (thousands)
74.0
72.6
1.9%
713.9
717.9
-0.6%
(1)
Note that preliminary passenger traffic figures for 2019, as well as January 2020 for Ezeiza Airport, in Argentina , were adjusted to include additional inbound passengers not accounted for in the initial count, for an average of approximately 5% of total passenger traffic at Ezeiza Airport and 1% of total traffic at CAAP, during that period. Importantly, inbound traffic does not affect revenues, as tariffs are applicable on departure passengers.
(2)
Cargo volumes in Uruguay were rectified from January 2019 to June 2020, to reflect all cargo passing through the cargo terminal, instead of air cargo only.
Passenger Traffic Overview
Total passenger traffic grew 14.5% compared to the same month of 2022, supported by the ongoing recovery in travel demand after the Covid-19 pandemic and the gradual resumption of routes and frequencies across all countries of operations. Overall passenger traffic reached 101.2% of October 2019 levels, up from the 98.9% posted in September, with all countries except Brazil above pre-pandemic. International passenger traffic surpassed pre-pandemic levels of October 2019 by 8.8% , while domestic traffic also improved versus the prior month slightly exceeding October 2019 levels.
In Argentina , total passenger traffic continued to recover in October, increasing by 18.7% year-over-year (YoY) and surpassing pre-pandemic volumes by 10.4% . Domestic traffic was 18.3% higher than the levels in October 2019 and benefited from a government program to boost domestic tourism. International passenger traffic also continued to recover, reaching 96.0% of pre-pandemic levels, up from the 90.7% recorded in September.
In Italy , passenger traffic grew by 21.6% compared to the same month in 2022 and surpassed pre-pandemic levels for the fourth consecutive month, increasing by 6.4% compared to October 2019, up from the 1.6% recorded in September. International passenger traffic, which accounted for 80% of the total traffic, was 7.9% above October 2019 levels, while domestic passenger traffic surpassed pre-pandemic levels by 1.3% . Although domestic traffic is still below pre-pandemic levels at Pisa airport, both airports exceeded October 2019 overall traffic volumes.
In Brazil , total passenger traffic increased slightly by 0.1% YoY, reaching 84.5% of October 2019 levels, down from the 92.9% recorded in September. Domestic traffic, which accounted for almost two-thirds of the total traffic, reached 86.5% of pre-pandemic levels, while transit passengers stood at 79.9% of October 2019 levels, a decrease from the 87.5% recorded in September. Traffic in Brazil remained impacted by financial and aircraft constraints in some local airlines.
In Uruguay , total passenger traffic, which is largely international, continued to recover and increased 28.6% YoY, surpassing pre-pandemic levels for the first time, at 107.4% of October 2019 levels, up from 94.5% recorded in September.
In Ecuador , passenger traffic increased 0.5% YoY and surpassed pre-pandemic volumes by 9.0% . Both domestic and international passenger traffic exceeded pre-pandemic levels by 11.5% and 5.5% , respectively.
In Armenia , passenger traffic continued its solid recovery trend, increasing by 29.1% YoY and surpassing the pre-pandemic levels of October 2019 by 62.5% .
Cargo Volume and Aircraft Movements
Cargo volume increased 7.9% YoY and reached 85.3% of October 2019 levels, or 86.3% when adjusting for the discontinuation of operations in Peru . Cargo volumes in Armenia and Ecuador were above pre-pandemic levels, whereas Italy stood at 93.1% , Argentina at 78.8% , Uruguay at 86.0% , and Brazil at 83.1% . Almost 70% of cargo volume originated in Argentina , Ecuador and Uruguay .
Aircraft movements increased 9.4% YoY and surpassed October 2019 levels by 1.9% , or 5.6% when adjusting for the discontinuation of operations in Peru . All the countries of operations, except Ecuador and Brazil , exceeded October 2019 pre-pandemic levels.
Summary Passenger Traffic, Cargo Volume and Aircraft Movements (2023 vs. 2022)
Oct'23
Oct'22
% Var.
YTD'23
YTD'22
% Var.
Passenger Traffic (thousands)
Argentina (1)
3,917
3,300
18.7%
35,927
27,249
31.8%
Italy
823
677
21.6%
7,191
5,827
23.4%
Brazil
1,415
1,414
0.1%
14,185
12,818
10.7%
Uruguay
179
139
28.6%
1,597
1,145
39.5%
Ecuador
394
392
0.5%
4,067
3,508
15.9%
Armenia
485
375
29.1%
4,672
3,008
55.3%
TOTAL
7,212
6,297
14.5%
67,638
53,554
26.3%
(1) See Footnote 1 in previous table. (2) See Footnote 2 in previous table.
Cargo Volume (tons)
Argentina
17,501
15,722
11.3%
156,066
150,439
3.7%
Italy
1,170
1,258
-7.0%
10,649
12,348
-13.8%
Brazil
5,936
5,281
12.4%
54,366
46,511
16.9%
Uruguay (2)
2,324
2,572
-9.6%
25,667
26,770
-4.1%
Ecuador
2,775
2,951
-6.0%
27,106
28,178
-3.8%
Armenia
3,366
2,870
17.3%
27,840
17,051
63.3%
TOTAL
33,070
30,653
7.9%
301,694
281,297
7.3%
Aircraft Movements
Argentina
40,560
35,745
13.5%
383,594
312,404
22.8%
Italy
7,794
6,695
16.4%
68,246
60,187
13.4%
Brazil
13,015
12,640
3.0%
132,419
118,080
12.1%
Uruguay
2,637
2,466
6.9%
25,780
22,005
17.2%
Ecuador
6,130
6,464
-5.2%
65,818
64,009
2.8%
Armenia
3,846
3,634
5.8%
38,066
28,755
32.4%
TOTAL
73,982
67,644
9.4%
713,923
605,440
17.9%
Summary Passenger Traffic, Cargo Volume and Aircraft Movements (2023 vs. 2019)
Oct'23
Oct'19
% Var.
YTD'23
YTD'19
% Var.
Passenger Traffic (thousands)
Argentina (1)
3,917
3,548
10.4%
35,927
36,307
-1.0%
Italy
823
773
6.4%
7,191
7,204
-0.2%
Brazil
1,415
1,675
-15.5%
14,185
15,622
-9.2%
Uruguay
179
167
7.4%
1,597
1,831
-12.8%
Ecuador
394
361
9.0%
4,067
3,744
8.6%
Armenia
485
298
62.5%
4,672
2,723
71.6%
Peru
309
-
-
2,951
-
TOTAL
7,212
7,130
1.2%
67,638
70,381
-3.9%
(1) See Footnote 1 in previous table. (2) See Footnote 2 in previous table.
Cargo Volume (tons)
Argentina
17,501
22,211
-21.2%
156,066
186,588
-16.4%
Italy
1,170
1,256
-6.9%
10,649
10,823
-1.6%
Brazil
5,936
7,140
-16.9%
54,366
75,501
-28.0%
Uruguay (2)
2,324
2,702
-14.0%
25,667
23,685
8.4%
Ecuador
2,775
2,707
2.5%
27,106
32,067
-15.5%
Armenia
3,366
2,295
46.7%
27,840
15,991
74.1%
Peru
-
446
-
-
4,217
-
TOTAL
33,070
38,757
-14.7%
301,694
348,873
-13.5%
Aircraft Movements
Argentina
40,560
36,582
10.9%
383,594
374,646
2.4%
Italy
7,794
7,315
6.5%
68,246
68,829
-0.8%
Brazil
13,015
14,047
-7.3%
132,419
133,336
-0.7%
Uruguay
2,637
2,083
26.6%
25,780
24,208
6.5%
Ecuador
6,130
7,449
-17.7%
65,818
68,407
-3.8%
Armenia
3,846
2,598
48.0%
38,066
23,022
65.3%
Peru
-
2,514
-
-
25,451
-
TOTAL
73,982
72,588
1.9%
713,923
717,899
-0.6%
About Corporación América Airports
Corporación América Airports acquires, develops and operates airport concessions. Currently, the Company operates 53 airports in 6 countries across Latin America and Europe (Argentina , Brazil , Uruguay , Ecuador , Armenia and Italy ). In 2022, Corporación América Airports served 65.6 million passengers, 83.7% above the 35.7 million passengers served in 2021 and 22.1% below the 84.2 million served in 2019. The Company is listed on the New York Stock Exchange where it trades under the ticker “CAAP”. For more information, visit http://investors.corporacionamericaairports.com .
View source version on businesswire.com: https://www.businesswire.com/news/home/20231121975207/en/
Investor Relations Contact
Patricio Iñaki Esnaola
Email: patricio.esnaola@caairports.com
Phone: +5411 4899-6716
Source: Corporación América Airports
What is the percentage increase in passenger traffic for Corporación América Airports S.A. (CAAP) in October 2023?
Corporación América Airports S.A. (CAAP) reported a 14.5% year-on-year (YoY) increase in passenger traffic in October 2023.
How much did international passengers increase for Corporación América Airports S.A. (CAAP) in October 2023?
International passengers increased by 20.3% for Corporación América Airports S.A. (CAAP) in October 2023.
What was the percentage growth in cargo volume for Corporación América Airports S.A. (CAAP) in October 2023?
Corporación América Airports S.A. (CAAP) experienced a 7.9% year-on-year (YoY) growth in cargo volume in October 2023.