
U.S. Retail Occupancy Continued to Improve in the Third Quarter of 2026
Austin led annual occupancy gains among retail markets with at least 100 million square feet of inventory, followed by Phoenix.
Sentiment and the balance of points
Rhea-AI Sentiment reads the wording of the document, how positive or negative its language is on a 1 to 5 scale. The balance of points shown with the takes weighs what the document actually discloses, so the two can disagree, for example when a trial that missed its main goal is described in upbeat language.


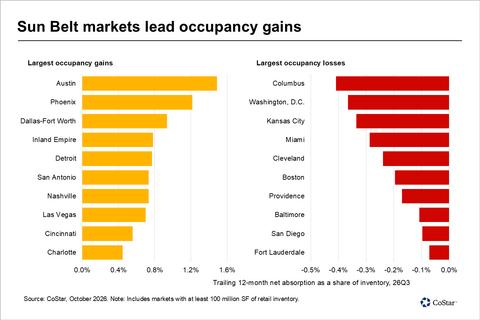
Sun Belt markets lead occupancy gains
In Q3 2026, roughly 8.5 million more square feet was occupied nationally, following a gain of 10.3 million square feet in the previous quarter.
Tenants moved into nearly 96.7 million square feet of existing space during the quarter – the highest total since mid-2022 and the second consecutive quarter above 96 million square feet. Move-outs eased to roughly 92.3 million square feet, down
“Recent occupancy gains have come almost entirely from tenants filling existing space,” said Brandon Svec, national director of retail analytics at CoStar Group. "Expanding retailers continue to absorb locations vacated by large chains, while the limited supply of available space has encouraged tenants to commit quickly when suitable sites become available. Newly constructed space has played a smaller role in the absorption picture, with newly delivered buildings totaling about 12.3 million square feet – the smallest quarterly contribution since 2021.”
Among markets with at least 100 million square feet of retail inventory,
Several large markets continued to shed occupied space, led by
The full analysis can be found here.
For more information about the company and its products and services, please visit costargroup.com.
About CoStar Group
CoStar Group (NASDAQ: CSGP) is a leading global provider of online real estate marketplaces, information, analytics, and digital twins in the property markets. Founded in 1986, CoStar Group is dedicated to digitizing the world’s real estate, empowering all people to discover properties, insights, and connections that improve their businesses and lives.
CoStar Group’s major brands include CoStar, a leading global provider of commercial real estate data, analytics, and news; LoopNet, the most trafficked commercial real estate marketplace; Apartments.com, the leading platform for apartment rentals; Homes.com, the fastest-growing residential real estate marketplace; and Domain, one of Australia’s leading property marketplaces.
CoStar Group’s industry-leading brands also include Matterport, a leading spatial data company whose platform turns buildings into data to make every space more valuable and accessible; STR, a global leader in hospitality data and benchmarking; Zonda, a leading provider of data, analytics, software, and marketplace solutions for the residential construction industry; Ten-X, an online platform for commercial real estate auctions and negotiated bids; and OnTheMarket, a leading residential property portal in the United Kingdom.
CoStar Group’s websites attracted 121 million average monthly unique visitors in the third quarter of 2026, serving clients around the world. Headquartered in Arlington, Virginia, CoStar Group is committed to transforming the real estate industry through innovative technology and comprehensive market intelligence. From time to time, we plan to utilize our corporate website as a channel of distribution for material company information. For more information, visit CoStarGroup.com.
View source version on businesswire.com: https://www.businesswire.com/news/home/20261028416000/en/
News Media Contacts
Haley Luther
Senior Communications Manager
(216) 278-0627
hluther@costar.com
Source: CoStar Group