
EPAM Reports Results for Second Quarter 2024 and Updates Full Year Outlook
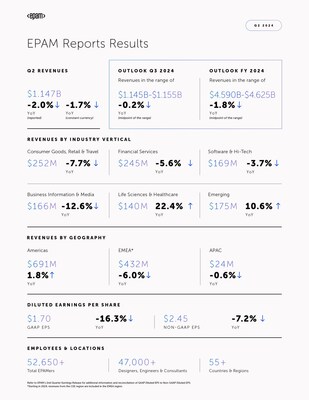
EPAM Systems (NYSE: EPAM) reported Q2 2024 results with revenues of $1.147 billion, down 2.0% year-over-year.
Rhea-AI Summary
EPAM Systems (NYSE: EPAM) reported Q2 2024 results with revenues of $1.147 billion, down 2.0% year-over-year. GAAP income from operations was 10.5% of revenues, while non-GAAP income from operations was 15.2%. GAAP diluted EPS decreased to $1.70, and non-GAAP diluted EPS fell to $2.45. For the full year, EPAM narrowed its revenue forecast to $4.590-$4.625 billion and updated GAAP diluted EPS to $7.18-$7.38 and non-GAAP diluted EPS to $10.20-$10.40. The company announced a new $500 million share repurchase program. EPAM cited a challenging macro-demand environment but highlighted its ability to adapt and optimize operations while strengthening its offerings and client value propositions.
Positive
- New $500 million share repurchase program approved
- Cash provided by operating activities increased to $186.9 million for H1 2024
- Maintained consistent delivery professional headcount at 47,000
- Narrowed full-year revenue guidance, showing improved visibility
Negative
- Q2 revenues decreased by 2.0% year-over-year to $1.147 billion
- GAAP income from operations decreased by 16.5% to $120.6 million
- GAAP diluted EPS decreased by 16.3% to $1.70
- Non-GAAP diluted EPS decreased by 7.2% to $2.45
- Cash, cash equivalents and restricted cash decreased by 12.3% to $1.792 billion
Details
News Market Reaction – EPAM
The recorded move for EPAM in the trading session of this news was -8.17%.
Data tracked by StockTitan Argus. Session date unavailable.
AI-generated analysis. How Rhea-AI works. Not financial advice.




- Second quarter revenues of
$1.147 billion 2.0% year-over-year - GAAP income from operations was
10.5% of revenues and non-GAAP income from operations was15.2% of revenues for the second quarter - Second quarter GAAP diluted EPS of
$1.70 $0.33 $2.45 $0.19 - For the full year, EPAM narrows expected range for revenues to
$4.590 billion $4.625 billion $7.18 $7.38 $10.20 $10.40 - For the third quarter, EPAM expects revenues to be in the range of
$1.145 billion $1.155 billion $1.75 $1.83 $2.65 $2.73 - New Share Repurchase Program - On August 1, 2024, the Board of Directors approved a new share repurchase program with authorization to purchase up to
$500 million
"With ongoing exposure to a challenging macro-demand environment, EPAM's solid performance highlights the Company's ability to adapt and optimize operations, while continuing to strengthen its offerings and client value propositions," said Arkadiy Dobkin, CEO & President at EPAM. "We are continuously improving our geographic delivery footprint, while simultaneously strengthening our transformational capabilities, including our GenAI-relevant expertise and assets, and preparing ourselves to be our clients' partner of choice once the demand environment improves."
Second Quarter 2024 Highlights
- Revenues decreased to
$1.147 billion $23.6 million 2.0% . On an organic constant currency basis excluding the impact of the exit fromRussia , revenues were down2.8% compared to the second quarter of 2023; - GAAP income from operations was
$120.6 million $23.8 million 16.5% , compared to$144.3 million - Non-GAAP income from operations was
$174.5 million $16.3 million 8.5% , compared to$190.8 million - Diluted earnings per share ("EPS") on a GAAP basis was
$1.70 $0.33 16.3% , compared to$2.03 - Non-GAAP diluted EPS was
$2.45 $0.19 7.2% , compared to$2.64
Cash Flow and Other Metrics
- Cash provided by operating activities was
$186.9 million $176.4 million - Cash, cash equivalents and restricted cash totaled
$1.792 billion $251.5 million 12.3% , from$2.043 billion - Total headcount was approximately 52,650 as of June 30, 2024. Included in this number were approximately 47,000 delivery professionals, a level consistent with that as of March 31, 2024.
Share Repurchase Program
- The Company repurchased 1.160 million shares of its common stock for
$214.5 million $41.4 million $500 million - On August 1, 2024, the Board of Directors approved a new share repurchase program with authorization to purchase up to
$500 million - EPAM may repurchase shares of its common stock from time to time through open market purchases, in privately negotiated transactions, or by other means, including through the use of trading plans intended to qualify under Rule 10b5-1 under the Securities Exchange Act of 1934, as amended, in accordance with applicable securities laws and other restrictions. The timing and total amount of stock repurchases will depend upon business, economic and market conditions, corporate and regulatory requirements, prevailing stock prices, and other considerations. The share repurchase program will have a term of 24 months, may be suspended or discontinued at any time, and does not obligate the company to acquire any amount of common stock.
2024 Outlook - Full Year and Third Quarter
Full Year
While client demand has stabilized, the Company is expecting no aggregate improvement in demand for the remainder of the year. As a result, EPAM now expects the following for the full year:
- The Company narrows its expected range for revenues to
$4.590 billion $4.625 billion 1.8% at the midpoint of the range. The Company expects that revenues on an organic constant currency basis excluding the impact of the exit fromRussia will decline2.9% at the midpoint of the range; - For the full year, EPAM expects GAAP income from operations to now be in the range of
10.5% to11.0% of revenues and non-GAAP income from operations to now be in the range of15.5% to16.0% of revenues; - The Company expects its GAAP effective tax rate to now be approximately
21% and continues to expect its non-GAAP effective tax rate to be approximately24% ; and - EPAM expects GAAP diluted EPS to now be in the range of
$7.18 $7 $10.20 $10.40
Third Quarter
EPAM expects the following for the third quarter:
- The Company expects revenues will be in the range of
$1.145 billion $1.155 billion 0.2% at the midpoint of the range. The Company expects that revenues on an organic constant currency basis excluding the impact of the exit fromRussia will decline1.4% at the midpoint of the range; - For the third quarter, EPAM expects GAAP income from operations to be in the range of
10.0% to11.0% of revenues and non-GAAP income from operations to be in the range of16.0% to17.0% of revenues; - The Company expects both its GAAP effective tax rate and its non-GAAP effective tax rate to be approximately
24% ; and - EPAM expects GAAP diluted EPS will be in the range of
$1.75 $1.83 $2.65 $2.73
Conference Call Information
EPAM will host a conference call to discuss the results on Thursday, August 8, 2024, at 8:00 a.m. EDT. The conference call will be available live on the EPAM website at https://investors.epam.com. Please visit the website at least 15 minutes prior to the call to register for the event. For those who cannot access the live webcast, a replay will be available in the Investor Relations section of the website.
About EPAM Systems
Since 1993, EPAM Systems, Inc. (NYSE: EPAM) has used its software engineering expertise to become a leading global provider of digital engineering, cloud and AI-enabled transformation services, and a leading business and experience consulting partner for global enterprises and ambitious startups. We address our clients' transformation challenges by fusing EPAM Continuum's integrated strategy, experience and technology consulting with our 30+ years of engineering execution to speed our clients' time to market and drive greater value from their innovations and digital investments.
We make GenAI real with our testing, engineering and AI LLM orchestration solutions, EPAM EliteA™, EPAM AI/RUN™ and EPAM DIAL, respectively.
We deliver globally but engage locally with our expert teams of consultants, architects, designers, and engineers, making the future real for our clients, our partners, and our people around the world.
We believe the right solutions are the ones that improve people's lives and fuel competitive advantage for our clients across diverse industries. Our thinking comes to life in the experiences, products and platforms we design and bring to market.
Added to the S&P 500 and the Forbes Global 2000 in 2021 and recognized by Glassdoor as a Best Workplace in 2023 and 2024, our multidisciplinary teams serve customers across six continents. We are proud to be among the top 15 companies in Information Technology Services in the Fortune 1000 and to be recognized as a leader in the IDC MarketScapes for Worldwide Experience Build Services, Worldwide Experience Design Services and Worldwide Software Engineering Services as well as a leader in the 2023 Gartner® Magic Quadrant™ for Custom Software Development Services, Worldwide.*
Learn more at https://www.epam.com and follow us on LinkedIn.
* Gartner does not endorse any vendor, product or service depicted in its research publications, and does not advise technology users to select only those vendors with the highest ratings or other designation. Gartner research publications consist of the opinions of Gartner's research organization and should not be construed as statements of fact. Gartner disclaims all warranties, expressed or implied, with respect to this research, including any warranties of merchantability or fitness for a particular purpose.
Non-GAAP Financial Measures
EPAM supplements results reported in accordance with
Forward-Looking Statements
This press release includes estimates and statements which may constitute forward-looking statements made pursuant to the safe harbor provisions of the Private Securities Litigation Reform Act of 1995, the accuracy of which are necessarily subject to risks, uncertainties, and assumptions as to future events that may not prove to be accurate. Our estimates and forward-looking statements are mainly based on our current expectations and estimates of future events and trends, which affect or may affect our business and operations. These statements may include words such as "may," "will," "should," "believe," "expect," "anticipate," "intend," "plan," "estimate" or similar expressions. Those future events and trends may relate to, among other things, developments relating to the war in
EPAM SYSTEMS, INC. AND SUBSIDIARIES CONDENSED CONSOLIDATED STATEMENTS OF INCOME (Unaudited) (In thousands, except per share data) | |||||||
Three Months Ended June 30, | Six Months Ended June 30, | ||||||
2024 | 2023 | 2024 | 2023 | ||||
Revenues | $ 1,146,597 | $ 1,170,206 | |||||
Operating expenses: | |||||||
Cost of revenues (exclusive of depreciation and | 810,857 | 808,715 | 1,645,191 | 1,664,616 | |||
Selling, general and administrative expenses | 194,058 | 194,377 | 392,511 | 406,264 | |||
Depreciation and amortization expense | 21,121 | 22,768 | 43,267 | 45,550 | |||
Income from operations | 120,561 | 144,346 | 231,093 | 264,717 | |||
Interest and other income, net | 12,036 | 11,710 | 27,078 | 23,231 | |||
Foreign exchange gain/(loss) | 1,213 | (6,010) | (706) | (10,618) | |||
Income before provision for income taxes | 133,810 | 150,046 | 257,465 | 277,330 | |||
Provision for income taxes | 35,165 | 30,013 | 42,577 | 55,005 | |||
Net income | $ 98,645 | $ 120,033 | $ 214,888 | $ 222,325 | |||
Net income per share: | |||||||
Basic | $ 1.71 | $ 2.07 | $ 3.72 | $ 3.84 | |||
Diluted | $ 1.70 | $ 2.03 | $ 3.67 | $ 3.75 | |||
Shares used in calculation of net income per share: | |||||||
Basic | 57,594 | 57,993 | 57,716 | 57,848 | |||
Diluted | 58,149 | 59,181 | 58,540 | 59,240 | |||
EPAM SYSTEMS, INC. AND SUBSIDIARIES CONDENSED CONSOLIDATED BALANCE SHEETS (Unaudited) (In thousands, except par value) | |||
As of June 30, 2024 | As of December 31, 2023 | ||
Assets | |||
Current assets | |||
Cash and cash equivalents | $ 1,787,182 | $ 2,036,235 | |
Trade receivables and contract assets, net of allowance of and | 960,866 | 897,032 | |
Short-term investments | 61,492 | 60,739 | |
Prepaid and other current assets | 106,103 | 97,355 | |
Total current assets | 2,915,643 | 3,091,361 | |
Property and equipment, net | 210,378 | 235,053 | |
Operating lease right-of-use assets, net | 129,953 | 134,898 | |
Intangible assets, net | 78,241 | 71,118 | |
Goodwill | 608,072 | 562,459 | |
Deferred tax assets | 213,074 | 197,901 | |
Other noncurrent assets | 67,968 | 59,575 | |
Total assets | $ 4,223,329 | $ 4,352,365 | |
Liabilities | |||
Current liabilities | |||
Accounts payable | $ 30,954 | $ 31,992 | |
Accrued compensation and benefits expenses | 367,670 | 412,747 | |
Accrued expenses and other current liabilities | 129,539 | 124,823 | |
Income taxes payable, current | 37,466 | 38,812 | |
Operating lease liabilities, current | 36,829 | 36,558 | |
Total current liabilities | 602,458 | 644,932 | |
Long-term debt | 25,501 | 26,126 | |
Operating lease liabilities, noncurrent | 103,654 | 109,261 | |
Other noncurrent liabilities | 93,757 | 100,576 | |
Total liabilities | 825,370 | 880,895 | |
Commitments and contingencies | |||
Equity | |||
Stockholders' equity | |||
Common stock, | 57 | 58 | |
Additional paid-in capital | 1,087,411 | 1,008,766 | |
Retained earnings | 2,379,332 | 2,501,107 | |
Accumulated other comprehensive loss | (69,423) | (39,040) | |
Total EPAM Systems, Inc. stockholders' equity | 3,397,377 | 3,470,891 | |
Noncontrolling interest in consolidated subsidiaries | 582 | 579 | |
Total equity | 3,397,959 | 3,471,470 | |
Total liabilities and equity | $ 4,223,329 | $ 4,352,365 | |
EPAM SYSTEMS, INC. AND SUBSIDIARIES Reconciliations of Non-GAAP Financial Measures to Comparable GAAP Financial Measures (Unaudited) (In thousands, except percent and per share amounts)
| |||
Reconciliation of revenue decline as reported on a GAAP basis to revenue decline on an organic constant currency basis | |||
Three Months Ended June 30, 2024 | Six Months Ended June 30, 2024 | ||
Revenue decline as reported | (2.0) % | (2.9) % | |
Foreign exchange rates impact | 0.3 % | (0.2) % | |
Inorganic revenue growth | (1.6) % | (1.2) % | |
Impact of exit from | 0.5 % | 0.5 % | |
Revenue decline on an organic constant currency basis excluding the impact of the exit from | (2.8) % | (3.8) % | |
Reconciliation of various income statement amounts from GAAP to non-GAAP for the three and six months ended | |||||||||||
Three Months Ended June 30, 2024 | Six Months Ended June 30, 2024 | ||||||||||
GAAP | Adjustments | Non-GAAP | GAAP | Adjustments | Non-GAAP | ||||||
Cost of revenues (exclusive of depreciation and | $ (17,504) | $ 1,645,191 | $ (40,520) | $ 1,604,671 | |||||||
Selling, general and administrative expenses(2) | $ (30,620) | $ 392,511 | $ (64,713) | ||||||||
Income from operations(3) | $ 53,945 | $ 231,093 | $ 117,003 | ||||||||
Operating margin | 10.5 % | 4.7 % | 15.2 % | 10.0 % | 5.1 % | 15.1 % | |||||
Net income(4) | $ 98,645 | $ 43,621 | $ 214,888 | $ 72,624 | |||||||
Diluted earnings per share | $ 1.70 | $ 2.45 | $ 3.67 | $ 4.91 | |||||||
Three Months Ended June 30, 2023 | Six Months Ended June 30, 2023 | ||||||||||
GAAP | Adjustments | Non-GAAP | GAAP | Adjustments | Non-GAAP | ||||||
Cost of revenues (exclusive of depreciation and amortization)(1) | $ (20,314) | $ 1,664,616 | $ (46,135) | $ 1,618,481 | |||||||
Selling, general and administrative expenses(2) | $ (20,654) | $ 406,264 | $ (47,193) | ||||||||
Income from operations(3) | $ 46,451 | $ 264,717 | $ 104,348 | ||||||||
Operating margin | 12.3 % | 4.0 % | 16.3 % | 11.1 % | 4.4 % | 15.5 % | |||||
Net income(4) | $ 36,167 | $ 222,325 | $ 80,468 | ||||||||
Diluted earnings per share | $ 2.03 | $ 2.64 | $ 3.75 | $ 5.11 | |||||||
Items (1) through (4) above are detailed in the table below with the specific cross-reference noted in the appropriate item. |
Three Months Ended June 30, | Six Months Ended June 30, | ||||||
2024 | 2023 | 2024 | 2023 | ||||
Stock-based compensation expenses | $ 16,937 | $ 15,416 | $ 39,294 | $ 31,427 | |||
Humanitarian support in | 567 | 2,853 | 1,226 | 5,293 | |||
Unbilled business continuity resources (b) | — | 2,045 | — | 9,415 | |||
Total adjustments to GAAP cost of revenues(1) | 17,504 | 20,314 | 40,520 | 46,135 | |||
Stock-based compensation expenses | 18,747 | 17,694 | 41,181 | 40,262 | |||
Cost Optimization charges (c) | 9,513 | — | 16,530 | — | |||
Humanitarian support in | 2,119 | 1,049 | 4,739 | 4,666 | |||
Other acquisition-related expenses | 456 | 1,340 | 1,679 | 1,581 | |||
Geographic repositioning (d) | 104 | 230 | 825 | 442 | |||
One time (benefits)/charges | (319) | 341 | (241) | 242 | |||
Total adjustments to GAAP selling, general and administrative expenses(2) | 30,620 | 20,654 | 64,713 | 47,193 | |||
Amortization of acquired intangible assets | 5,821 | 5,483 | 11,770 | 11,020 | |||
Total adjustments to GAAP income from operations(3) | 53,945 | 46,451 | 117,003 | 104,348 | |||
Foreign exchange (gain)/loss | (1,213) | 6,010 | 706 | 10,618 | |||
Change in fair value of contingent consideration included in Interest and other income, net | 1,485 | 1,218 | 2,535 | 1,518 | |||
Provision for income taxes: | |||||||
Tax effect on non-GAAP adjustments | (10,632) | (10,151) | (25,027) | (21,665) | |||
Tax shortfall/(excess tax benefits) related to stock-based compensation | 103 | (7,361) | (20,763) | (13,383) | |||
Net discrete benefit from tax planning (e) | (67) | — | (1,830) | (968) | |||
Total adjustments to GAAP net income(4) | $ 43,621 | $ 36,167 | $ 72,624 | $ 80,468 | |||
(a) Humanitarian support in | |
(b) Given the uncertainty in the region introduced by | |
(c) Cost Optimization charges include severance, facilities and contract termination charges incurred in connection with the programs initiated in the third quarter of 2023 and second quarter of 2024. Consistent with the Company's historical non-GAAP policy, costs incurred in connection with formal restructuring initiatives have been excluded from non-GAAP results as these are one-time and unusual in nature. | |
(d) Geographic repositioning includes expenses associated with the relocation to other countries of employees based outside of | |
(e) One-time benefit related to the implementation of tax planning to disregard certain foreign subsidiaries as separate entities for |
EPAM SYSTEMS, INC. AND SUBSIDIARIES Reconciliations of Guidance Non-GAAP Financial Measures to Comparable GAAP Financial Measures (Unaudited) | |||
The below guidance constitutes forward-looking statements within the meaning of the federal securities laws and is based on a | |||
Reconciliation of expected revenue decline on a GAAP basis to expected revenue decline on an organic constant currency basis | |||
Third Quarter 2024 | Full Year 2024 | ||
Revenue decline (at midpoint of the range) | (0.2) % | (1.8) % | |
Foreign exchange rates impact | 0.2 % | (0.1) % | |
Inorganic revenue growth | (1.5) % | (1.3) % | |
Impact of exit from | 0.1 % | 0.3 % | |
Revenue decline on an organic constant currency basis excluding the | (1.4) % | (2.9) % | |
Reconciliation of expected GAAP to non-GAAP income from operations as a percentage of revenues is presented in the table below: | |||
Third Quarter 2024 | Full Year 2024 | ||
GAAP income from operations as a percentage of revenues | |||
Stock-based compensation expenses | 4.1 % | 3.6 % | |
Included in cost of revenues (exclusive of depreciation and amortization) | 2.0 % | 1.8 % | |
Included in selling, general and administrative expenses | 2.1 % | 1.8 % | |
Humanitarian support in | 0.3 % | 0.2 % | |
Cost Optimization charges (c) | 1.0 % | 0.7 % | |
One-time charges and Other acquisition-related expenses (f) | — % | — % | |
Amortization of acquired intangible assets | 0.6 % | 0.5 % | |
Non-GAAP income from operations as a percentage of revenues | |||
(f) EPAM has not included the impact of potential future One-time charges including asset impairments, unusual gains and losses, expenses incurred in connection with future cost optimization actions, and Other acquisition-related expenses, if any, because the Company is unable to predict these amounts with reasonable certainty. |
Reconciliation of expected GAAP to non-GAAP effective tax rate is presented in the table below: | |||
Third Quarter 2024 | Full Year 2024 | ||
GAAP effective tax rate (approximately) | 24 % | 21 % | |
Tax effect on non-GAAP adjustments | (0.8) % | (1.2) % | |
Excess tax benefits related to stock-based compensation | 0.8 % | 4.2 % | |
Non-GAAP effective tax rate (approximately) | 24 % | 24 % | |
Reconciliation of expected GAAP to non-GAAP diluted earnings per share is presented in the table below: | |||
Third Quarter 2024 | Full Year 2024 | ||
GAAP diluted earnings per share | |||
Stock-based compensation expenses | 0.79 | 2.95 | |
Included in cost of revenues (exclusive of depreciation and amortization) | 0.39 | 1.46 | |
Included in selling, general and administrative expenses | 0.40 | 1.49 | |
Humanitarian support in | 0.05 | 0.22 | |
Cost Optimization charges (c) | 0.19 | 0.63 | |
One-time charges and Other acquisition-related expenses (f) | — | 0.03 | |
Amortization of acquired intangible assets | 0.10 | 0.41 | |
Change in fair value of contingent consideration | — | 0.04 | |
Foreign exchange loss | 0.02 | 0.05 | |
Provision for income taxes: | |||
Tax effect on non-GAAP adjustments | (0.23) | (0.89) | |
Excess tax benefits related to stock-based compensation | (0.02) | (0.39) | |
Net discrete benefit from tax planning (e) | — | (0.03) | |
Non-GAAP diluted earnings per share | |||

 View original content to download multimedia:https://www.prnewswire.com/news-releases/epam-reports-results-for-second-quarter-2024-and-updates-full-year-outlook-302217457.html
SOURCE EPAM Systems, Inc.
FAQ
AI-generated questions and answers. How Rhea-AI works. Not financial advice.