
High Tide Reports Record-Breaking Third Quarter 2026 Financial Results
Record Q3 revenue, margins and cash generation highlight accelerating earnings leverage across High Tide’s Canadian retail and German medical cannabis platforms.
Rhea-AI Summary
High Tide (HITI) reported record Q3 2026 revenue and profitability growth across key metrics on September 14, 2026.
Revenue reached a record $198.8 million, up 33% year over year and 11% sequentially, marking a fifth consecutive quarterly high. Gross profit was a record $52.7 million, up 32% with gross margin stable at 27%. Adjusted EBITDA hit a record $16.2 million, up 53% year over year and 17% sequentially, with an 8.2% margin, the highest in 12 quarters. Net income rose to a record $12.7 million versus $0.8 million a year earlier, while cash flow from operations before working capital was a record $11.9 million, supporting free cash flow of $7.0 million.
Canna Cabana held a 14% market share in its Canadian provinces (ex-BC) with 232 stores, and Remexian generated record German medical cannabis revenue of $38.2 million. Cash and equivalents were $47.1 million, and the company closed new $40 million senior secured credit facilities with Bank of Montreal.
Positive
- Revenue $198.8M in Q3 2026, up 33% YoY and 11% QoQ
- Adjusted EBITDA $16.2M, up 53% YoY with 8.2% margin, highest in 12 quarters
- Net income $12.7M in Q3 2026 versus $0.8M a year earlier
- Free cash flow $7.0M in Q3 2026, up 373% sequentially from $1.5M
- German medical cannabis revenue $38.2M, volumes up 62% YoY and 35% QoQ
- Market share for Canna Cabana 14% in operating provinces (ex-BC), up from 13%
Negative
- Free cash flow Q3 2026 down 9% YoY to $7.0M from $7.7M
- Cash and equivalents $47.1M, down from $63.8M a year earlier
- Total expenses for Q3 2026 up 21% YoY to $44.0M
News Explained
Operating growth outpaced average basic share-count growth, while the release does not establish that existing holders avoided dilution.
High Tide released results for the quarter ended
The release’s comparison is a growth-rate claim, not a statement that existing holders’ percentage ownership was preserved: issuing additional shares increases the total share count and reduces an existing holder’s percentage ownership absent offsetting changes.
Details
Market reaction after 3Q26 earnings report: HITI +5.70%
Following this news, HITI has gained 5.70%, reflecting a notable positive market reaction. Argus tracked a peak move of +10.6% during the session. Our momentum scanner has triggered 30 alerts so far, indicating elevated trading interest and price volatility. The stock is currently trading at $2.78. Trading volume is exceptionally heavy at 7.2x the average, suggesting very strong buying interest.
Data tracked by StockTitan Argus (15 min delayed). Upgrade to Gold for real-time data.
Key Figures
- Revenue
- $198.8 million
- Q3 2026; up 33% year over year
- Gross Profit
- $52.7 million
- Q3 2026; up 32% year over year
- Adjusted EBITDA
- $16.2 million
- Q3 2026; up 53% year over year
- Adjusted EBITDA Margin
- 8.2%
- Q3 2026; highest level in 12 quarters
- Income From Operations
- $8.7 million
- Q3 2026; up 133% year over year
- Net Income
- $12.7 million
- Q3 2026; compared with $0.8 million a year earlier
- Free Cash Flow
- $7.0 million
- Q3 2026; compared with $7.7 million in the prior year
- Medical Cannabis Distribution
- 10.2 tonnes
- Remexian Q3 2026; up 62% year over year
Previous Earnings Reports
-
Record revenue and Adjusted EBITDA with positive free cash flow and net income
-
Record revenue and gross profit with improving Adjusted EBITDA and reduced net loss
-
Record quarterly revenue and EBITDA with annual free cash flow and German expansion
-
Record revenue and EBITDA with positive free cash flow and German market entry
-
Revenue growth, positive free cash flow and expansion into German medical cannabis
24h Move is the share-price change in the day after each event; other market factors may also have contributed.
Key Terms
adjusted ebitda financial
free cash flow financial
non-ifrs financial measure financial
working capital financial
derivative liability financial
AI-generated analysis. How Rhea-AI works. Not financial advice.





- RECORD Quarterly Revenue of
$199 Million $800 Million - RECORD Gross Profit of
$52.7 Million - RECORD Adjusted EBITDA of
$16.2 Million - RECORD Income From Operations of
$8.7 Million - RECORD Net Income of
$12.7 Million - RECORD Cash Flow From Operations Before Changes in Non-Cash Working Capital of
$11.9 Million $7.0 Million - Canna Cabana Held a
14% Share of the Cannabis Retail Market in the Provinces Where it Operates, Excluding British Columbia, Up From13% a Year Ago1
"Nearly every major financial metric moved in the right direction this quarter, with many reaching the highest levels in our history. We delivered record revenue, record gross profit, record Adjusted EBITDA, record income from operations, record net income and record operating cash flow before working capital. But what excites me most is that our bottom line is now growing substantially faster than our top line. That is the operating leverage we have spent years building toward," said Raj Grover, Founder and Chief Executive Officer of High Tide.
"High Tide is approaching an
Third Fiscal Quarter 2026 – Financial Highlights:
- Revenue was a record
$198.8 million $149.7 million 33% , representing the fastest growth rate in 13 quarters. Revenue was up11% sequentially, representing the fastest growth rate in 15 quarters. This was the fifth consecutive quarter marking a new all-time high in revenue. - Gross profit was a record
$52.7 million 32% compared to the previous year and up9% sequentially. - Gross margin was
27% for the three months ended July 31, 2026, which was consistent with a year ago and sequentially. - Adjusted EBITDA was yet another record of
$16.2 million 53% compared to last year and up17% sequentially. The Company generated Adjusted EBITDA margin of8.2% in the three months ended July 31, 2026, which marked the highest level in 12 quarters. - The Company continued to create shareholder value by growing key fundamental metrics far in excess of share dilution. Specifically, even excluding the non-controlling interest, revenue grew 2.5x faster than its average basic share count during the three months ended July 31, 2026, compared to the prior year, while Adjusted EBITDA grew 3.9x faster than its average basic share count.
- Cash flow from operations before changes in non-cash working capital was a record
$11 44% compared to last year and36% sequentially. - The Company generated
$7.0 million 373% versus$1.5 million $7.7 million $4.2 million - General and administration expenses represented
3.9% of revenue in the three months ended July 31, 2026, which improved from4.4% during the previous year, and4.0% sequentially, and was the lowest level in eight quarters. - Salaries, wages, and benefits represented
11.4% of revenue in the three months ended July 31, 2026, which improved from12.2% during the previous year, and11.9% sequentially, and was the lowest level in 12 quarters. - Income from operations was a record
$8.7 million 133% compared to last year, and43% sequentially. - During the third fiscal quarter, the Company generated record net income of
$12.7 million $0.8 million $2.2 million $0.9 million $0.8 million - Cash and cash equivalents, including restricted cash, as at July 31, 2026 totaled
$47.1 million $63.8 million $36.5 million
Third Fiscal Quarter 2026 – Retail Highlights:
- Canna Cabana remains the largest cannabis retail chain in
Canada with 232 operating locations. ExcludingBritish Columbia , Canna Cabana's market share was14% , up from13% in the previous year.2 - Canadian Cabana Club membership has surpassed 2.73 million, an increase of
27% compared to last year, and3% sequentially. Cabana Club remains the largest cannabis loyalty program globally. The Company has also exceeded 186,000 ELITE members inCanada , an increase of62% from the previous year and4% sequentially. - The average Canna Cabana store generated 1.8x revenue versus peers.3
- Same-store sales for the entirety of the third fiscal quarter of 2026 were consistent with the prior year; however, comparative sales showed positive growth in each of the months of June 2026 and July 2026 versus the prior year. The Company notes that, in terms of transaction count, on a same-store basis, Canna Cabana posted a
1.1% gain during the third fiscal quarter. Since the launch of its discount club model in October 2021, same store sales at Canna Cabana are up171% while the average operator has experienced a1% decline in sales.4 - For the 12 months ended June 2026, total industry sales in the five provinces where the Company operates were up
3% year over year.5 In contrast, total Canna Cabana sales were up10% during this period. - Canna Cabana had a shrink rate of
0.2% during the three months ended July 31, 2026, which was consistent with the three months ended April 30, 2026, and July 31, 2025. - Excluding stores open less than six months which are still ramping up, annualized retail sales per square foot were
$1,721
Third Fiscal Quarter 2026 – Medical Cannabis Update
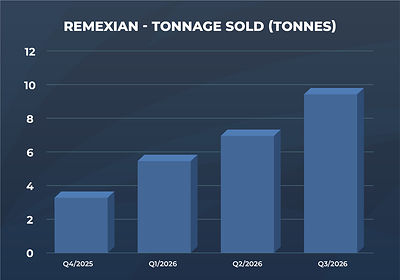
- During the third fiscal quarter of 2026, Remexian distributed a record 10.2 tonnes of medical cannabis into the German market, marking the highest quarterly distribution volume in the company's history. Volumes increased
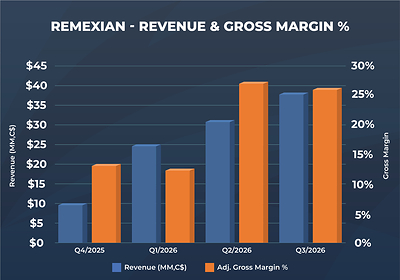
62% compared to the previous year and35% sequentially. - The segment generated record revenue of
$38.2 million $31.6 million - During the third fiscal quarter of 2026, Remexian generated gross margin of
26% .
Third Fiscal Quarter 2026 – Operational Highlights (May 1, 2026 – July 31, 2026):
- The Company opened new Canna Cabana locations in
Toronto ,Welland ,Ottawa andCalgary . - The Company closed the acquisition of four additional stores in Ontario—Bowmanville,
Oshawa ,Courtice and Kingston—through the acquisition of100% of the equity interests of J. Supply Holdings Inc., operating as Northern Helm. - Certain officers, directors, and consultants, led by the Company's President and Chief Executive Officer, in the aggregate, acquired 90,882 common shares in the capital of High Tide on the open market between May 6, 2026, and May 8, 2026, at an average price of
$3.39
Subsequent Events (August 1, 2026 – Present):
- The Company closed its previously announced senior secured credit facilities with Bank of Montreal in the aggregate principal amount of
$40 million - The Company announced the voting results from its annual general and special meeting of shareholders of the Company held on August 11, 2026, where each nominee listed in the Company's management information circular dated June 29, 2026, was elected as a director of the Company, and where the Company's revised Shareholder Rights Plan was approved.
- The Company announced the opening of three new Canna Cabana locations across Lindsay, Orléans, and Regina, bringing the Canadian Canna Cabana store count to 232, including 105 in
Ontario and 14 inSaskatchewan .
Selected financial information for the three and nine months ended, July 31, 2026:
(Expressed in thousands of Canadian Dollars)
|
|
Three months ended July 31, |
Nine months ended July 31, |
|||||||||
|
|
2026 |
|
2025 |
|
Change |
|
2026 |
|
2025 |
|
Change |
|
|
$ |
|
$ |
|
∆ |
|
$ |
|
$ |
|
∆ |
|
Free cash flow(i) |
7,017 |
|
7,682 |
|
(9) % |
|
11,438 |
|
10,678 |
|
7 % |
|
Net cash provided by operating activities |
10,091 |
|
10,650 |
|
(5) % |
|
20,384 |
|
19,588 |
|
4 % |
|
Revenue |
198,818 |
|
149,690 |
|
33 % |
|
556,443 |
|
429,955 |
|
29 % |
|
Gross profit |
52,746 |
|
40,091 |
|
32 % |
|
145,546 |
|
111,002 |
|
31 % |
|
Gross margin(ii) |
27 % |
|
27 % |
|
— % |
|
26 % |
|
26 % |
|
— % |
|
Operating expense(iii) |
(36,514) |
|
(29,448) |
|
24 % |
|
(105,423) |
|
(85,208) |
|
24 % |
|
Operating expense as a % of revenue(iv) |
18 % |
|
20 % |
|
(2) % |
|
19 % |
|
20 % |
|
(1) % |
|
Total expenses |
(44,036) |
|
(36,352) |
|
21 % |
|
(128,368) |
|
(106,264) |
|
21 % |
|
Income from operations |
8,710 |
|
3,739 |
|
133 % |
|
17,178 |
|
4,738 |
|
263 % |
|
Adjusted EBITDA(v) |
16,232 |
|
10,643 |
|
53 % |
|
41,605 |
|
25,794 |
|
61 % |
|
Adjusted EBITDA as a percentage of revenue(vi) |
8 % |
|
7 % |
|
1 % |
|
7 % |
|
6 % |
|
1 % |
|
Net income (loss) |
12,748 |
|
832 |
|
— % |
|
12,420 |
|
(4,693) |
|
— % |
|
Adjusted net income (loss)(vii) |
2,246 |
|
875 |
|
157 % |
|
(606) |
|
(4,650) |
|
(87) % |
|
Basic income (loss) per share |
0.13 |
|
0.01 |
|
— % |
|
0.14 |
|
(0.06) |
|
— % |
|
Diluted income (loss) per share |
0.12 |
|
0.01 |
|
— % |
|
0.13 |
|
(0.06) |
|
— % |
|
i. Free cash flow is a non-IFRS financial measure prepared based on the calculation below. |
|
ii. Gross margin is a non-IFRS financial measure. Gross margin is calculated by dividing gross profit by revenue. |
|
iii. Operating expense is a non-IFRS measure and includes salaries, wages and benefits, general & administration, professional fees, advertising & promotion, and interest & bank charges. |
|
iv. Operating expense as a % of revenue is a non-IFRS financial measure. This metric is calculated as operating expense divided by revenue. |
|
v. Adjusted EBITDA is a non-IFRS financial measure. A reconciliation of the Adjusted EBITDA to Net income (loss) is found below. |
|
vi. Adjusted EBITDA as a percentage of revenue is a non-IFRS financial measure. This metric is calculated as adjusted EBITDA divided by revenue. |
|
vii. Adjusted net income (loss) is a non-IFRS financial measure calculated by excluding the fair value changes in the derivative liability and long-term contract asset from net income (loss). |
The reconciling items between net earnings, EBITDA, and Adjusted EBITDA are as follows:
|
|
2026 |
2025 |
2024 |
|||||
|
|
Q3 |
Q2 |
Q1 |
Q4 |
Q3 |
Q2 |
Q1 |
Q4 |
|
Net (loss) Income |
12,748 |
24 |
(352) |
(46,711) |
832 |
(2,836) |
(2,689) |
(4,802) |
|
Income/deferred tax (recovery) expense |
(93) |
295 |
40 |
(178) |
69 |
46 |
38 |
(153) |
|
Accretion and interest |
3,531 |
3,151 |
3,155 |
1,213 |
1,795 |
1,950 |
2,101 |
2,308 |
|
Depreciation and amortization |
6,644 |
6,146 |
8,026 |
6,503 |
6,080 |
5,880 |
5,847 |
5,362 |
|
EBITDA(i) |
22,830 |
9,616 |
10,869 |
(39,173) |
8,776 |
5,040 |
5,297 |
2,715 |
|
Inventory fair value |
- |
792 |
690 |
865 |
— |
— |
— |
— |
|
Foreign exchange loss (gain) |
979 |
(212) |
(144) |
333 |
120 |
114 |
(13) |
5 |
|
Transaction and acquisition costs |
2,047 |
2,077 |
2,958 |
2,682 |
881 |
1,616 |
630 |
773 |
|
Other (gain) loss |
— |
— |
— |
(41) |
(1) |
42 |
— |
(874) |
|
Impairment loss |
— |
— |
— |
23,564 |
— |
— |
— |
4,964 |
|
Share-based compensation |
878 |
881 |
370 |
668 |
824 |
1,250 |
1,175 |
750 |
|
(Gain) loss on fair value change in derivative liability |
(11,787) |
762 |
(3,286) |
23,516 |
43 |
— |
— |
(88) |
|
Loss on fair value change in long term contract asset |
1,285 |
— |
— |
— |
— |
— |
— |
— |
|
Adjusted EBITDA(i) |
16,232 |
13,916 |
11,457 |
12,414 |
10,643 |
8,062 |
7,089 |
8,245 |
|
Adjusted EBITDA margin(ii) |
8 % |
8 % |
6 % |
8 % |
7 % |
6 % |
5 % |
6 % |
|
Adjusted EBITDA - trailing twelve months |
54,019 |
48,430 |
42,576 |
38,208 |
34,039 |
33,010 |
34,989 |
38,335 |
|
i. EBITDA and Adjusted EBITDA are non-IFRS financial measures. |
|
ii. Adjusted EBITDA margin is a non-IFRS financial measure. This metric is calculated as Adjusted EBITDA divided by revenue. |
|
|
2026 |
2025 |
2024 |
|||||
|
|
Q3 |
Q2 |
Q1 |
Q4 |
Q3 |
Q2 |
Q1 |
Q4 |
|
Cash flow from operating activities |
11,886 |
8,752 |
5,486 |
6,599 |
8,231 |
4,686 |
4,644 |
6,179 |
|
Changes in non-cash working capital |
(1,795) |
(4,319) |
374 |
(2,321) |
2,419 |
3,569 |
(3,961) |
3,473 |
|
Net cash provided by operating activities |
10,091 |
4,433 |
5,860 |
4,278 |
10,650 |
8,255 |
683 |
9,652 |
|
Sustaining capex |
(492) |
(289) |
(286) |
(345) |
(460) |
(692) |
(361) |
(533) |
|
Lease liability payments |
(2,582) |
(2,662) |
(2,635) |
(2,610) |
(2,508) |
(2,667) |
(2,222) |
(3,211) |
|
Free cash flow(i) |
7,017 |
1,482 |
2,939 |
1,323 |
7,682 |
4,896 |
(1,900) |
5,908 |
|
Free cash flow - trailing twelve months |
12,761 |
13,426 |
16,840 |
12,001 |
16,586 |
11,996 |
16,483 |
21,991 |
|
i. Free cash flow is a non-IFRS measure. |
OUTLOOK
Bricks-and-Mortar Retail
High Tide's wholly owned subsidiary, Canna Cabana, is the largest cannabis retail chain in
White Label Initiatives
The Company continues to expand its white label cannabis product portfolio under its flagship Queen of Bud and Cabana Cannabis Co. brands, increasing from 41 to 48 SKUs sequentially. The Company is also developing several new offerings to further grow its white label portfolio. Currently, white label cannabis SKUs represent approximately
Cabana Club & ELITE
The Company's Cabana Club and ELITE loyalty programs, which remain the largest such cannabis loyalty programs in the world, continue to expand at a rapid pace across
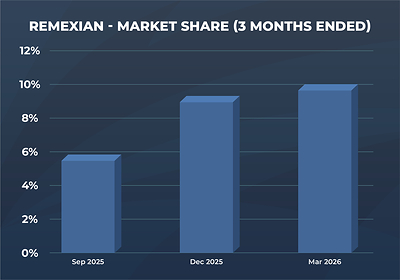
High Tide's German medical cannabis subsidiary, Remexian Pharma GmbH, has continued to gain momentum since the Company's acquisition of a majority stake, with market share increasing from
The Company's conviction in the long-term opportunity for its
Federal reform in the
The Company believes that broader rescheduling, if ultimately implemented, could have significant implications for the
The Company continues to engage with multiple counterparties in the
WEBCAST LINK FOR TIDE EARNINGS EVENT
The Company will host a webcast and conference call to discuss its unaudited results and outlook at 11:30 AM (Eastern Time) on Tuesday, September 15, 2026.
https://app.webinar.net/4WqyjMOJnKb
Participants are encouraged to pre-register for the webcast by clicking on the link above prior to the beginning of the live webcast. Three hours after the live webcast, a replay of the webcast will be available at the same link above.
Participants who wish to ask questions during the event may do so through the call-in line, the access information for which is as follows:
North American Toll Free: 1-888-510-2154
International Toll Free (
ABOUT HIGH TIDE
High Tide Inc. is the leading community-grown, retail-forward cannabis enterprise engineered to unleash the full value of the world's most powerful plant. Its wholly owned subsidiary, Canna Cabana, is the second-largest cannabis retail brand globally. High Tide (HITI) is uniquely-built around the cannabis consumer, with wholly-diversified and fully-integrated operations across all components of cannabis, including:
Retail: Canna Cabana™ is the largest cannabis retail chain in Canada, with 232 domestic and 1 international location. The Company's Canadian bricks-and-mortar operations span British Columbia, Alberta, Saskatchewan, Manitoba, and Ontario. Excluding British Columbia, where store counts are capped at 8, the Company holds a growing
Medical Cannabis Distribution: Remexian Pharma GmbH is a leading German pharmaceutical company, with a
High Tide consistently moves ahead of the currents, having been named one of Canada's Top Growing Companies by the Globe and Mail's Report on Business in 2025 for the fifth consecutive year and was recognized as a top 50 company by the TSX Venture Exchange (the "TSXV") in 2022, 2024 and 2025. High Tide was also ranked number one in the retail category on the Financial Times list of Americas' Fastest Growing Companies for 2023. To discover the full impact of High Tide, visit www.hightideinc.com. For investment performance, don't miss the High Tide profile pages on SEDAR+ and EDGAR.
Neither the TSXV nor its Regulation Services Provider (as that term is defined in the policies of the TSXV) accepts responsibility for the adequacy or accuracy of this release.
CONTACT INFORMATION
Media Inquiries
Omar Khan
Chief Communications and Public Affairs Officer
High Tide Inc.
omar@hightideinc.com
403-770-3080
Investor Inquiries
Vahan Ajamian
Capital Markets Advisor
High Tide Inc.
vahan@hightideinc.com
CAUTIONARY NOTE REGARDING FORWARD-LOOKING STATEMENTS
This press release may contain "forward-looking information" and "forward-looking statements" within the meaning of applicable securities legislation. The use of any of the words "could", "intend", "expect", "believe", "will", "projected", "estimated" and similar expressions and statements relating to matters that are not historical facts are intended to identify forward-looking information and are based on the Company's current belief or assumptions as to the outcome and timing of such future events. The forward-looking statements herein include, but are not limited to, statements regarding:
The Company's business objectives and milestones and the anticipated timing of, and costs in connection with, the execution or achievement of such objectives and milestones (including, without limitation, proposed acquisitions, expansions and store openings); the Company's future growth prospects and intentions to pursue one or more viable business opportunities; the development of the Company's business and future activities following the date hereof; expectations relating to market size and anticipated growth in the jurisdictions within which the Company may from time to time operate or contemplate future operations; expectations with respect to economic, business, regulatory, or competitive factors related to the Company or the cannabis industry generally; the market for the Company's current and proposed product offerings, as well as the Company's ability to capture market share; the distribution methods expected to be used by the Company to deliver its product offerings; the Company's strategic investments and capital expenditures, and related benefits; changes in general and administrative expenses; future business operations and activities and the timing and performance thereof; the future tax liability of the Company; the estimated future contractual obligations of the Company; the future liquidity and financial capacity of the Company and its ability to fund its working capital requirements and forecasted capital expenditures; the competitive landscape within which the Company operates and the Company's market share or reach; the Company adding the number of additional cannabis retail store locations the Company proposes to add to the Company's business upon the timelines indicated herein; the Company remaining on a positive growth trajectory; same-store sales continuing to increase; the Company making increases to its revenue profile; the Company completing the development of its cannabis retail stores; the Company's ability to generate positive free cash flow and remain free cash flow positive for the fiscal year; free cash flow allowing the Company to finance its growth with internal cash flows; the Company's ability to maximize shareholder value; the Company's ability to obtain, maintain, and renew or extend, applicable authorizations, including the timing and impact of the receipt thereof; the realization of cost savings, synergies or benefits from the Company's recent and proposed acquisitions; the Company's ability to successfully integrate the operations of any business acquired within the Company's business; the anticipated sales from continuing operations; the ability of the company to use cash generated from existing operations to fund future locations; Cabana Club and ELITE loyalty programs membership continuing to increase; the anticipated changes to and effects of the ELITE program on the business and operations of the Company; the Company hitting its forecasted revenue and sales projections; the intention of the Company to complete any offering of securities of the Company; the aggregate amount of the total proceeds that the Company will receive pursuant to any future offering; the Company's expected use of the net proceeds from any future offering; the listing of Common Shares offered in any future offering; the anticipated effects of any future offering on the business and operations of the Company; the Company's ability to enter emerging legal cannabis jurisdictions, the ability of the Company to capture additional market share in the amount and on the timelines indicated herein; the ability of the Company to add over 20 stores this calendar year and reach its goals of 350 stores nationwide, 3 million Cabana Club members in Canada, the ability of the Company to sustain or grow its share of the German medical cannabis market and to expand into further European markets in coming quarters; whether additional working capital will be needed to grow Remexian; the ability to remain free cash flow positive for the 2026 fiscal year; the closing of announced acquisitions, the ability of the Company to develop and launch cannabis, white label, and consumption accessory offerings and for sales of its higher-margin white label brands to grow; the ability to fund store growth internally; and the ability of the Company and its subsidiaries to capitalize on further federal reforms in the U.S. and elsewhere and for these to be a growth opportunity for the Company.
Readers are cautioned to not place undue reliance on forward-looking information. Actual results and developments may differ materially from those contemplated by these statements. Although the Company believes that the expectations reflected in these statements are reasonable, such statements are based on expectations, factors, and assumptions concerning future events which may prove to be inaccurate and are subject to numerous risks and uncertainties, certain of which are beyond the Company's control, including but not limited to the risk factors discussed under the heading "Non-Exhaustive List of Risk Factors" in Schedule A to our current annual information form, and elsewhere in this press release, as such factors may be further updated from time to time in our periodic filings, available at www.sedarplus.ca and www.sec.gov, which factors are incorporated herein by reference. Forward-looking statements contained in this press release are expressly qualified by this cautionary statement and reflect the Company's expectations as of the date hereof and are subject to change thereafter. The Company undertakes no obligation to update or revise any forward-looking statements, whether as a result of new information, estimates or opinions, future events or results, or otherwise, or to explain any material difference between subsequent actual events and such forward-looking information, except as required by applicable law.
CAUTIONARY NOTE REGARDING FUTURE ORIENTED FINANCIAL INFORMATION
This press release may contain future oriented financial information ("FOFI") within the meaning of applicable securities legislation about prospective results of operations, financial position or cash flows, which is subject to the same assumptions, risk factors, limitations, and qualifications as set out in the above "Cautionary Note Regarding Forward-Looking Statements". FOFI is not presented in the format of a historical balance sheet, income statement or cash flow statement. FOFI does not purport to present the Company's financial condition in accordance with IFRS as issued by the International Accounting Standards Board, and there can be no assurance that the assumptions made in preparing the FOFI will prove accurate. The actual results of operations of the Company and the resulting financial results will likely vary from the amounts set forth in the analysis presented, and such variation may be material (including due to the occurrence of unforeseen events occurring subsequent to the preparation of the FOFI). The Company and management believe that the FOFI has been prepared on a reasonable basis, reflecting management's best estimates and judgments as of the applicable date. However, because this information is highly subjective and subject to numerous risks, readers are cautioned not to place undue reliance on the FOFI as necessarily indicative of future results. Except as required by applicable securities laws, the Company undertakes no obligation to update such FOFI.
Importantly, the FOFI contained in this press release are, or may be, based upon certain additional assumptions that management believes to be reasonable based on the information currently available to management, including, but not limited to, assumptions about: (i) the future pricing for the Company's products, (ii) the future market demand and trends within the jurisdictions in which the Company may from time to time conduct the Company's business, (iii) the Company's ongoing inventory levels, and operating cost estimates, and (iv) the Company's net proceeds from the ATM Program and future financings. The FOFI or financial outlook contained in this press release do not purport to present the Company's financial condition in accordance with IFRS as issued by the International Accounting Standards Board, and there can be no assurance that the assumptions made in preparing the FOFI will prove accurate. The actual results of operations of the Company and the resulting financial results will likely vary from the amounts set forth in the analysis presented in any such document, and such variation may be material (including due to the occurrence of unforeseen events occurring subsequent to the preparation of the FOFI). The Company and management believe that the FOFI has been prepared on a reasonable basis, reflecting management's best estimates and judgments as at the applicable date. However, because this information is highly subjective and subject to numerous risks including the risks discussed under the heading above entitled "Cautionary Note Regarding Forward-Looking Statements" and under the heading "Risk Factors" in the Company's public disclosures, FOFI or financial outlook within this press release should not be relied on as necessarily indicative of future results.
Readers are cautioned not to place undue reliance on the FOFI, or financial outlook contained in this press release. Except as required by Canadian securities laws, the Company does not intend, and does not assume any obligation, to update such FOFI.
|
__________________________ |
|
1 Based on publicly available data from Statistics Canada, excluding |
|
2 Based on publicly available data from Statistics Canada, excluding |
|
3 For the month of June 2026, based on publicly available store count data in the five Canadian provinces where Canna Cabana operates and as per publicly available data from Statistics Canada and provincial regulators |
|
4 Calculated by chaining monthly data, and based on publicly available store count data in the five Canadian provinces where Canna Cabana operates and as per publicly available data from Statistics Canada and provincial regulators |
|
5 Based on latest data from Statistics Canada |

 View original content to download multimedia:https://www.prnewswire.com/news-releases/high-tide-reports-record-breaking-third-quarter-2026-financial-results-302878002.html
SOURCE High Tide Inc.
FAQ
AI-generated questions and answers. How Rhea-AI works. Not financial advice.
How did High Tide’s operating efficiency metrics change in Q3 2026?
General and administration expenses fell to 3.9% of revenue from 4.4% a year earlier, the lowest in eight quarters. Salaries, wages and benefits declined to 11.4% of revenue from 12.2% a year earlier, the lowest level in 12 quarters. Operating expenses were 18% of revenue, down from 20% a year ago.
What were the key developments in High Tide’s Canadian retail footprint during the quarter?
Canna Cabana operated 232 stores in Canada and remained the largest cannabis retail chain nationally. During the quarter, the company opened new locations in Toronto, Welland, Ottawa and Calgary and closed the acquisition of four Ontario stores (Bowmanville, Oshawa, Courtice and Kingston) through purchasing 100% of J. Supply Holdings’ equity interests. Subsequent to quarter-end, three additional stores opened in Lindsay, Orléans and Regina.
How is High Tide’s loyalty program performing?
Cabana Club membership surpassed 2.73 million, up 27% year over year and 3% sequentially, which the company describes as the largest cannabis loyalty program globally. ELITE membership in Canada exceeded 186,000, growing 62% year over year and 4% sequentially.
What were the main highlights from Remexian’s German medical cannabis operations?
Remexian distributed a record 10.2 tonnes of medical cannabis into the German market in Q3 2026, with volumes increasing 62% year over year and 35% sequentially. Segment revenue reached a record $38.2 million, up from $31.6 million in Q2 2026, and the segment generated a 26% gross margin.
What capital structure action did High Tide complete after quarter-end?
Subsequent to July 31, 2026, the company closed previously announced senior secured credit facilities with Bank of Montreal totaling $40 million in aggregate principal amount.
What are High Tide’s stated growth goals for its bricks-and-mortar network?
The company reiterates a long-term goal of surpassing 350 locations across Canada and plans to open over 20 locations in calendar 2026, mainly through organic growth while also evaluating additional M&A opportunities.