Ivanhoe Mines Issues 2025 Fourth Quarter and Annual Financial Results
Rhea-AI Summary
Ivanhoe Mines (OTCQX: IVPAF) reported 2025 profit of $228M (vs. $193M in 2024) and adjusted EBITDA of $578M. Kamoa-Kakula generated $3.28B revenue and $1.45B EBITDA (44% margin), with cash costs of $2.16/lb and 2026 C1 guidance of $2.20–$2.50/lb.
Kipushi delivered $441M revenue and $91M EBITDA during ramp-up, while Platreef Phase 1 achieved first concentrate. The new 500ktpa smelter is over 60% ramped, and cash plus short-term deposits totaled $885M at year-end.
Positive
- 2025 profit after tax increased to $228M from $193M in 2024
- Kamoa-Kakula 2025 revenue $3.28B, EBITDA $1.45B, 44% margin
- Kamoa-Kakula 2025 capex $1.24B, below revised guidance range
- Kipushi 2025 revenue $441M, EBITDA $91M during ramp-up
- Kipushi 2025 C1 cash cost $0.92/lb, near low end of guidance
- Strong liquidity with $885M in cash and short-term deposits at 2025 year-end
Negative
- Adjusted EBITDA declined to $578M in 2025 from $625M in 2024
- Kamoa-Kakula C1 cash cost rose to $2.16/lb from $1.65/lb in 2024
- Kamoa-Kakula cost of sales increased to $2.82/lb vs. $1.71/lb in 2024
- Kamoa-Kakula copper sold fell to 351,674 tonnes from 396,972 tonnes in 2024
- High 2025 capital expenditure at Kamoa-Kakula of $1.24B
- Exploration budget of $90M in 2026, up 88% from 2024 spend
News Market Reaction – IVPAF
In the Feb 19 session, IVPAF declined 3.56%, reflecting a moderate negative market reaction.
Data tracked by StockTitan Argus on the day of publication.
AI-generated analysis. How Rhea-AI works. Not financial advice.
Ivanhoe Mines reports profit of
Kamoa-Kakula generates 2025 revenue of
Kamoa-Kakula cost of sales of
Kamoa-Kakula cash cost (C1) guidance of
Ramp up of Africa's largest and highest-technology copper smelter advancing ahead of schedule at over
First shipment of
Kipushi generates 2025 revenue of
Kipushi cost of sales of
Kipushi 2026 cash cost (C1) guidance of
Engineering contractor mobilized for Phase 2 expansion of Platreef; over 400+% increase in production from Phase 1 expected from Q4 2027
Updated Mineral Resource Estimate for Makoko District in Western Forelands targeted for mid-year
Johannesburg, South Africa--(Newsfile Corp. - February 18, 2026) - Ivanhoe Mines' (TSX: IVN) (OTCQX: IVPAF) President and Chief Executive Officer, Marna Cloete, and Chief Financial Officer David van Heerden today announce the company's financial results for the fourth quarter and year ended December 31, 2025, and provide an operations and project development update.
Ivanhoe Mines is a leading Canadian mining company with three principal Tier-One mining operations in Southern Africa. The company is primarily focused on operations at the Kamoa-Kakula Copper Complex in the Democratic Republic of the Congo (DRC); the ultra-high-grade Kipushi zinc-copper-lead-germanium mine in the DRC; and the Platreef platinum, palladium, nickel, rhodium, gold, and copper mine in South Africa.
In addition, Ivanhoe Mines is expanding the Makoko District copper discovery in the Western Forelands, as well as exploring for new sedimentary-hosted copper discoveries across its expansive and highly prospective exploration licences across the DRC, Angola, Zambia, and Kazakhstan.
All figures are in U.S. dollars unless otherwise stated.
Founder and Co-Chairman Robert Friedland commented:
"2026 marks a decisive turning point for Ivanhoe Mines… a year in which the extraordinary efforts made at each of our Tier-One mines coincide with increasingly tighter global commodity markets.
"As copper prices push to historic highs, we are turning the corner at Kamoa-Kakula following the 2025 seismic event. This extraordinary complex, which is the highest-grade major copper complex, has many decades of life ahead, powered by clean hydroelectric power… And, in the Western Forelands, we continue to expand our copper resource at a discovery cost of below a penny per pound of copper, at a
"In addition, at Platreef, we are ramping up the Phase 1 concentrator, as platinum, palladium, nickel, rhodium, copper and gold prices approach multi-year highs, positioning the operation as one of the most important polymetallic mines on the planet… And, Kipushi is ascending to its place as the world's fourth-largest zinc mine, as zinc prices also reach multi-year highs.
"We remain, as always, engaged in strategic discussions with sovereign governments and leading industry participants around the globe. Our growth pipeline is aligned with the intense and ever-increasing long-term demand for responsibly produced critical metals.
"Finally, I would like to extend our warmest wishes to our Chinese friends and partners for prosperity and success in the Year of the Fire Horse, and to thank all of our stakeholders for their continued confidence as we advance the next phase of our growth."
FINANCIAL HIGHLIGHTS
- Ivanhoe Mines recorded a profit after tax of
$228 million in 2025 compared with a profit of$193 million in 2024, equivalent to basic earnings per share of$0.19 and$0.17 , respectively.
- Ivanhoe Mines' adjusted EBITDA was
$578 million in 2025 compared with$625 million in 2024, which includes an attributable share of EBITDA from Kamoa-Kakula of$569 million .
- Kamoa-Kakula sold 351,674 tonnes of copper (net of payability) in 2025 at an average realized copper price per pound (lb.) of
$4.40 /lb., compared with 396,972 tonnes in 2024 at an average realized copper price of$4.09 /lb.
- 2026 copper sales from Kamoa-Kakula are expected to be approximately 30,000 tonnes higher than copper production as the on-site inventory of unsold copper concentrate is destocked now that the smelter is operational, predominantly during the first half of the year.
- Kamoa-Kakula recognized revenue of
$3.28 billion , operating profit of$0.91 billion and EBITDA of$1.45 billion for 2025, equivalent to a margin of44% . This compares with revenue of$3.11 billion , operating profit of$1.43 billion and EBITDA of$1.81 billion in 2024.
- Kamoa-Kakula recognized EBITDA of
$331 million for the fourth quarter of 2025, up from$196 million in the third quarter, in part impacted by stronger sales during the quarter and a favourable remeasurement of contract receivables due to higher copper prices.
- Kamoa-Kakula's cost of sales per pound of payable copper sold was
$2.82 /lb. for 2025 compared with$1.71 /lb. in 2024. Cash cost (C1) per pound of payable copper produced in 2025 totaled$2.16 /lb., achieving guidance, compared with$1.65 /lb. in 2024. The higher cash costs during Q4 2025 were primarily due to processing low-grade surface stockpiles and lower-grade run-of-mine ore, as well as elevated logistics costs on a per pound basis due to lower contained copper in concentrate being transported and one-off higher charges associated with G&A.
- Ivanhoe Mines announces Kamoa-Kakula's 2026 cash cost (C1) guidance of
$2.20 /lb. to$2.50 /lb. of payable copper produced. Cash cost (C1) for 2026 is expected to improve throughout the year as head grades increase and production improves. 2027 cash cost (C1) guidance is set to improve to between$1.90 /lb. and$2.30 /lb. of payable copper, as production continues to ramp-up to full capacity.
- Kamoa-Kakula's 2025 capital expenditure was
$1.24 billion , below the revised guidance range of$1.30 billion to$1.50 billion . Ivanhoe Mines adjusts Kamoa-Kakula's 2026 capital expenditure guidance range to include the underspend from 2025 to between$1.10 billion and$1.40 billion , from$800 million to$1 ,30 billion. In addition, the 2027 capital expenditure guidance range has been set at$750 million to$950 million .
- Kipushi sold 171,275 tonnes of zinc (net of payability) during ramp-up in 2025 at an average realized zinc price of
$1.31 /lb., recognizing revenue of$441 million .
- Kipushi's cost of sales per pound (lb.) of payable zinc sold was
$1.12 /lb. for 2025 and cash cost (C1) per pound of payable zinc sold totaled$0.92 /lb., towards the lower end of the guidance range. During the fourth quarter Kipushi cash cost (C1) decreased to$0.86 /lb.
- Kipushi recognized 2025 EBITDA of
$91 million , equivalent to an EBITDA margin of21% . This includes$44 million of EBITDA in the fourth quarter alone, at a margin of32% .
- Ivanhoe Mines announces Kipushi's 2026 cash cost (C1) guidance of
$0.85 /lb. to$0.95 /lb. of payable zinc sold.
- Kipushi's 2026 capital expenditure was
$86 million , close to guidance of$80 million , and included the completion of the de-bottlenecking project. 2026 guidance for Kipushi is now sustaining capital of$60 million , falling to$35 million in 2027.
- Platreef's 2025 capital expenditure of
$252 million was at the lower end of guidance, as Phase 1 was completed under budget. Ivanhoe Mines reconfirms Platreef's 2026 capital expenditure guidance range of$350 million to$380 million . In addition, the 2027 capital expenditure guidance range has been set at$380 million to$420 million , as execution of the Phase 2 expansion continues.
- Platreef's 2026 and 2027 capital expenditure will be focused predominantly on the Phase 2 expansion, which will partly be funded by the
$700 million senior project finance facility, as announced on January 12, 2026. The new Phase 2 senior project finance facility was signed on February 18, 2026, with financial close targeted for the end of the first quarter. Funding will be drawn in stages, subject to the satisfaction of conditions precedent.
- Ivanhoe Mines has a strong balance sheet with cash and cash equivalents and short-term deposits on hand of
$885 million as at December 31, 2025.
OPERATIONAL HIGHLIGHTS
- Kamoa-Kakula's concentrators milled a record total of 14.3 million tonnes of ore, at an average grade of
3.14% copper, producing 388,841 tonnes of copper in 2025. This includes a record contribution from the Phase 3 concentrator, which milled 6.4 million tonnes of ore, which is approximately30% above design capacity, at an average grade of2.62% producing a record 144,489 tonnes of copper
- Ivanhoe Mines maintains 2026 production guidance for Kamoa-Kakula of 380,000 to 420,000 tonnes of copper, and 500,000 to 540,000 tonnes of copper for 2027, as announced on December 3, 2025.
- Stage Two dewatering of the Kakula Mine was completed in December, as planned. With the completion of Stage Two, dewatering activities are now off the critical path and selective mining on the eastern side of the Kakula Mine restarted. Dewatering below the Stage Two pumps will continue into Q2 2026, using refurbished underground pumping infrastructure that was previously water-damaged (Stage Three dewatering).
- An updated life-of-mine plan for Kamoa-Kakula is on track for the end of March 2026. The plan will update reserve and resource estimates, based on updated mining methods and technical parameters implemented since the seismic event and subsequent recovery plan, and targets increasing mining rates to 17 million tonnes per annum, to fully utilize Phase 1, 2 and 3 concentrator capacity, prior to a potential Phase 4 expansion.
- Kamoa-Kakula's 500,000-tonne-per-annum on-site, direct-to-blister copper smelter, the largest in Africa, cast the first batch of anodes in late December 2025. Ramp-up of the smelter is advancing ahead of expectations, with the concentrate feed rate already at over
60% of design capacity.
- Most of the copper concentrate produced by Kamoa-Kakula in the future is expected to be smelted on-site, resulting in significant cost savings on logistics costs, as well as by-product credits from sulphuric acid sales.
- Production of by-product, high-strength sulphuric acid from the smelter is averaging 1,200 tonnes per day, equivalent to over
60% of design capacity. The average realized price for high-strength acid sales to date is over$450 per tonne. Kamoa-Kakula expects the realized price for acid to moderate between$350 and$400 per tonne over the medium-term.
- The first batch of copper anodes produced by the Kamoa-Kakula smelter is set to be delivered to the Atlantic port of Lobito, in Angola, via the Lobito Atlantic Railway in the coming days. The anodes will then be shipped to Europe for refining, to produce some of the world’s lowest-carbon intensive refined copper.
- Kamoa-Kakula's Project 95 is
75% complete, with completion expected in early Q2 2026. The "Project 95" initiative for the Phase 1 and 2 concentrators aims to increase the overall recovery rate up to95% , up from the design recovery rate of87% .
- Construction of Kamoa-Kakula's on-site, solar (PV) facilities, with battery storage, is advancing to plan at approximately
70% complete. The two sites, with a total capacity of 60 MW, are expected to be operational during Q2 2026.
- The refurbishment of the 178-MW Turbine #5 at the Inga II hydroelectric dam was completed in early Q4 2025. Kamoa-Kakula is receiving an initial 50 MW of power from Inga II, ramping up to 85 MW in late Q1 2026. As transmission improvement initiatives are completed over the next 12 months, power delivered to Kamoa-Kakula from Inga II is expected to increase to 150 MW.
- At Kipushi, the concentrator milled a record 667,747 tonnes of ore at an average grade of
35.2% zinc during 2025, producing a record 203,168 tonnes of zinc in concentrate, achieving guidance.
- Kipushi's concentrator throughput rates notably improved in the fourth quarter, following the completion of the debottlenecking program in August. Multiple concentrator records have since been achieved, including a monthly record of 22,629 tonnes of zinc in concentrate produced in December.
- Ivanhoe Mines maintains 2026 production guidance for Kipushi of 240,000 to 290,000 tonnes of zinc in concentrate.
- At the Platreef Mine, the first production of platinum-palladium-nickel-rhodium- gold-copper concentrate from the Phase 1 concentrator took place on November 19, 2025. Phase 1 is the first step in a three-phase expansion plan that aims to make the Platreef Mine one of the world's largest and lowest-cost producers of platinum, palladium, rhodium and gold, with significant nickel and copper by-products.
- Production from the Phase 1 concentrator is currently being campaigned with development ore until the new Shaft #3 is commissioned and is ready to hoist ore in late April 2026. Thereafter, long-hole stoping (production mining) of the Flatreef orebody is expected to commence in early Q2 2026, enabling the ramp-up of the concentrator to continue with run-of-mine ore.
- Work on the Phase 2 expansion has commenced, with the appointment of the engineering, procurement, and construction management (EPCM) in Q4 2025. Early works on the 3.3-million-tonne-per-annum, Phase 2 concentrator site, located adjacent to the Phase 1 concentrator, and associated infrastructure have commenced.
- Platreef's Phase 2 expansion is targeting completion in Q4 2027. Phase 2 production is expected to be more than four times larger than Phase 1, producing approximately 450,000 ounces of platinum, palladium, rhodium, and gold (3PE + Au), plus approximately 9,000 tonnes of nickel and 6,000 tonnes of copper.
- The Platreef Mine is projected to be the lowest-cost primary platinum-group-metals producer globally. The Phase 2 life-of-mine total cash cost is estimated to be
$599 per ounce of 3PE+Au, net of nickel and copper by-product credits. This compares very favourably with a basket spot price of approximately$2,318 per ounce of 3PE+Au, as at February 16, 2026.
- In the Western Forelands, Ivanhoe continues exploration across its vast licence area, adjacent to Kamoa-Kakula. Drilling efforts during 2025 focused on the Makoko District, as well as the new target areas of Tshipaya and Kamilli. Drilling to the east of the Makoko District has identified an extension of mineralization that will continue to be tested during the wet season. An updated Mineral Resource Estimate for the Makoko District is planned by mid-2026.
- Ivanhoe Mines announces an exploration budget of approximately
$90 million across its portfolio, including approximately$50 million budgeted in the Western Forelands, and$40 million spread across its exploration activities in Angola, Kazakhstan, South Africa and Zambia. This represents an increase of88% compared to 2024 spend of$48 million .
To view an enhanced version of this graphic, please visit:
https://images.newsfilecorp.com/files/3396/284365_fc95c4cbb463283a_002full.jpg
Conference call for investors on Thursday, February 19, 2026
Ivanhoe Mines will hold an investor conference call to discuss the results on Thursday, February 19, 2026, at 10:30 a.m. Eastern time / 7:30 a.m. Pacific time. The conference call will conclude with a question-and-answer (Q&A) session. Media are invited to attend on a listen-only basis.
To view the webcast, use the link:
https://meetings.lumiconnect.com/400-110-047-205
Audience Phone Number:
Local - Toronto: (+1) 416-855-9085
Toll Free - North America: (+1) 800- 990-2777
An audio webcast recording of the conference call, together with supporting presentation slides, will be available on Ivanhoe Mines' website at www.ivanhoemines.com.
After issuance, the audited consolidated annual financial statements and Management's Discussion and Analysis will be available at www.ivanhoemines.com and www.sedarplus.ca.
Read Ivanhoe's Q4 2025 Sustainability Review:
During the fourth quarter of 2025, the group achieved a combined Lost Time Injury Frequency Rate (LTIFR) of 0.49 and a Total Recordable Injury Frequency Rate (TRIFR) of 2.29 per 1,000,000 hours worked. Regrettably, after quarter-end, a fatality occurred at Kamoa-Kakula. Two contractors were conducting surface maintenance at the Phase 2 concentrator when a flammable liquid ignited, causing a flash fire. Despite all efforts, one of the contractors sadly succumbed to his injuries. The other contractor is stable and recovering.
A breakdown of Ivanhoe’s health and safety performance can be found in the latest quarterly Sustainability Review on the company’s website. The Ivanhoe Mines 2025 Annual Sustainability Report will be published in April.
https://www.ivanhoemines.com/investors/document-library/#sustainability
To view an enhanced version of this graphic, please visit:
https://images.newsfilecorp.com/files/3396/284365_ivanhoe.jpg
Principal projects and review of activities
1. Kamoa-Kakula Copper Complex
Democratic Republic of Congo
The Kamoa-Kakula Copper Complex is operated as the Kamoa Holding joint venture between Ivanhoe Mines and Zijin Mining. The complex covers a licence area of 400 square kilometres and is approximately 25 kilometres southwest of the town of Kolwezi on the far western edge of the Central African Copperbelt.
Kamoa Holding holds an
Copper production at Kamoa-Kakula commenced in May 2021, following the ahead-of-schedule completion of the Phase 1 concentrator. Since then, the Phase 2 and Phase 3 mine and concentrator expansions have also been successfully delivered ahead of schedule, ranking Kamoa-Kakula among the largest and highest-grade copper operations globally.
The first cast of anodes from the 500,000-tonne-per-annum on-site direct-to-blister copper smelter took place in December 2025, significantly lowering the carbon footprint and boosting the margins of Kamoa-Kakula's copper production.
Kamoa-Kakula summary of operating and financial data
| FY 2025 | Q4 2025 | Q3 2025 | Q2 2025 | Q1 2025 | |
| Ore tonnes milled (000's tonnes) | 14,335 | 3,534 | 3,456 | 3,622 | 3,723 |
| Copper ore grade processed (%) | |||||
| Copper recovery (%) | |||||
| Copper in concentrate produced (tonnes) | 388,841 | 71,569 | 72,143 | 112,009 | 133,120 |
| Payable copper sold (tonnes)(1) | 351,674 | 78,469 | 61,528 | 101,714 | 109,963 |
| Cost of sales per pound ($ per lb.) | 2.82 | 3.80 | 3.23 | 2.85 | 1.87 |
| Cash cost (C1) ($ per lb.) | 2.16 | 2.99 | 2.62 | 1.89 | 1.69 |
| Realized copper price ($ per lb.) | 4.40 | 4.98 | 4.42 | 4.34 | 4.19 |
| Sales revenue before remeasurement ($'000) | 3,129,241 | 782,691 | 555,293 | 868,846 | 922,411 |
| Remeasurement of contract receivables ($'000) | 151,854 | 83,353 | 11,072 | 6,443 | 50,986 |
| Sales revenue after remeasurement ($'000) | 3,281,095 | 866,044 | 566,365 | 875,289 | 973,397 |
| EBITDA ($'000) | 1,446,236 | 331,121 | 195,597 | 325,181 | 594,337 |
| EBITDA margin (% of sales revenue) |
All figures in the above tables are on a
(1) Payable copper sold is net of the payability factor of circa
C1 cash cost per pound of payable copper produced can be further broken down as follows:
| FY 2025 | Q4 2025 | Q3 2025 | Q2 2025 | Q1 2025 | |||||||||||||||
| Mining | ($ per lb.) | 0.87 | 1.22 | 1.22 | 0.73 | 0.63 | |||||||||||||
| Processing | ($ per lb.) | 0.38 | 0.51 | 0.50 | 0.34 | 0.29 | |||||||||||||
| Logistics charges | ($ per lb.) | 0.48 | 0.70 | 0.38 | 0.49 | 0.41 | |||||||||||||
| TC, RC, smelter charges | ($ per lb.) | 0.17 | 0.14 | 0.21 | 0.14 | 0.19 | |||||||||||||
| General & Administrative | ($ per lb.) | 0.26 | 0.42 | 0.31 | 0.19 | 0.17 | |||||||||||||
| Cash cost (C1) per pound of payable copper produced | ($ per lb.) | 2.16 | 2.99 | 2.62 | 1.89 | 1.69 | |||||||||||||
The cost of power, which is allocated between mining and processing in the above cash cost split, can be split out as follows:
| FY 2025 | Q4 2025 | Q3 2025 | Q2 2025 | Q1 2025 | ||||||||||||||
| Power costs included in Mining and Processing cost | ($ per lb.) | 0.26 | 0.33 | 0.35 | 0.20 | 0.24 | ||||||||||||
| Power costs as a proportion of cash cost (C1) per pound of payable copper produced | (%) |
Cash cost (C1) is prepared on a basis consistent with the industry standard definitions by Wood Mackenzie cost guidelines, but is not a measure recognized under IFRS Accounting Standards. In calculating the C1 cash cost, the costs are measured on the same basis as the Company's share of profit from the Kamoa Holding joint venture, which is contained in the financial statements. C1 cash cost is used by management to evaluate operating performance and includes all direct mining, processing, and general and administrative costs. Smelter charges and freight deductions on sales to the final port of destination, which are recognized as a component of sales revenues, are added to C1 cash cost to arrive at an approximate cost of delivered, finished metal. C1 cash cost excludes royalties, production taxes, and non-routine charges as they are not direct production costs.
All figures are on a
Elevated cash costs (C1) in the fourth quarter were predominantly due to elevated logistics costs on a per pound basis due to lower contained copper product being transported and one-off general & administrative charges, in addition to higher mining costs associated with lower concentrator feed grades.
Concentrate sold in the fourth quarter was lower grade, averaging
During the fourth quarter, approximately 9,000 tonnes of excess copper in concentrate, predominantly from the Phase 3 concentrator and previously stockpiled for the smelter ramp-up, was sold, resulting in payable copper sold exceeding copper produced and contributing to higher-than-normal logistics costs. In addition, ongoing destocking of concentrate at the Lualaba Copper Smelter (LCS) in Kolwezi since Q3 2025 meant that less fourth quarter concentrate was sold to LCS for conversion into blister copper. Concentrate sold to LCS typically carries lower logistics costs because it is exported as approximately
Elevated G&A expenses during the fourth quarter were primarily related to one-time bank charges, working-capital rebalancing and inventory write-downs.
Kamoa-Kakula produced 388,841 tonnes of copper in 2025, achieving guidance, supported by record 144,489 tonnes of copper produced by the Phase 3 concentrator
Kamoa-Kakula produced a total of 388,841 tonnes of copper in concentrate in 2025, within the revised guidance range of 370,000 tonnes to 420,000 tonnes. Total copper production consisted of 385,811 tonnes of copper in concentrate produced by the Phase 1, 2 and 3 concentrators, as well as 3,030 tonnes of copper in concentrate produced by the slag concentrator located at the on-site smelter.
Kamoa-Kakula produced 71,569 tonnes of copper in concentrate during the fourth quarter. The slag concentrator was temporarily used to assist with copper production prior to the start-up of the smelter in December 2025.
Prior to the first feed of concentrate into the smelter furnace, as announced on December 1, 2025, the smelter’s slag concentrator was used to reprocess fines and spillage from the Phase 1, 2 and 3 concentrators during Q3 and Q4 2025. The smelter site at Kamoa-Kakula includes a 600,000-tonne-per-annum conventional concentrator plant, which under normal operating conditions is used to regrind and refloat slag produced by the smelter. Slag produced by the smelter contains approximately
Kamoa-Kakula’s copper production was supported by a record 144,489 tonnes of copper produced by the Phase 3 concentrator during 2025. The Phase 3 concentrator milled 6.4 million tonnes of ore during 2025, approximately
Smelter ramp-up advances with
As announced on January 2, 2026, the casting of the first anode at the Kamoa-Kakula copper smelter took place in late December 2025. Ramp-up of
The first truckloads of
As at the end of December, Kamoa-Kakula's unsold copper in concentrate inventory totaled 50,000 tonnes, down slightly from 59,000 tonnes at the end of September due to destocking at LCS and the sale of some Phase 3 concentrate for working capital management. 2026 copper sales are expected to be approximately 30,000 tonnes higher than copper production as the on-site inventory of unsold copper concentrate is destocked, predominantly during the first half of 2026. Total unsold copper in concentrate at the smelter, held in stockpiles and the smelting circuit, is expected to be reduced to approximately 17,000 tonnes during 2026 as the smelter ramps up. As destocking occurs, Kamoa-Kakula's management aims to capitalize on near-record-high copper prices.
Kamoa-Kakula's operating margins are set to expand due to reduced logistics costs and from revenue generated from by-product, high-strength sulphuric acid sales.
Kamoa-Kakula's margins are expected to expand as the smelter ramps up, as concentrates produced by Phase 1, 2, and 3 concentrators are smelted on-site rather than exported unbeneficiated. Kamoa-Kakula's logistics costs are expected to approximately halve as the copper content per truck-load exported more than doubles, from
Further improvement in Kamoa-Kakula's margins is also expected to be achieved through the revenues generated from sulphuric acid sales. In addition to the production of copper anodes, the Kamoa-Kakula smelter is currently producing approximately 1,200 tonnes per day, equivalent to over
The smelter is expected to produce up to 700,000 tonnes per annum of high-strength sulphuric acid at steady-state operations, which will be sold to local mining operations.
Sulphuric acid is currently in high demand globally, as well as by other mining operations across the Central African Copperbelt. This is due to a number of factors, including increased production driven by high copper prices, export restrictions on acid imposed by Zambia, and elevated seaborne prices for sulphur. Spot high-strength sulphuric acid prices have reached as high as
The year-to-date realized price for high-strength sulphuric acid sales by the smelter has averaged
First shipment of anodes to international markets along the Lobito Railway Corridor expected imminently, to produce some of the world’s lowest-carbon-intensive refined copper
The first shipment of copper anodes to be transported along the Lobito Railway Corridor is expected to be made in the coming days. The anodes, produced by the Kamoa-Kakula Copper Complex, have been delivered to Trafigura’s dry port facility in Kolwezi, in the DRC. From there, the anodes will be transported along the Lobito Railway Corridor to the Atlantic Port of Lobito, and then shipped to Aurubis Group’s European facilities for refining. Aurubis is a leading global provider of non-ferrous refined metals, with best-in-class sustainability standards. This initial delivery marks a significant step in producing some of the world’s lowest-carbon-intensive refined copper.
Kamoa-Kakula expects that for the foreseeable future, approximately
The Lobito Atlantic Railway plans to ramp up the annualized outbound capacity to 1.5 million tonnes by the end of the decade. Average journey times between Kolwezi and Lobito takes between six and eight days, compared with 20-25 days trucking from mine gate to the ports of Durban in South Africa, or Dar es Salaam in Tanzania. Cycle times, as well as the costs of transporting exports along the railway line, are expected to further improve as capacity ramps up, with the consortium targeting the westbound journey to be reduced over time to as little as four days.
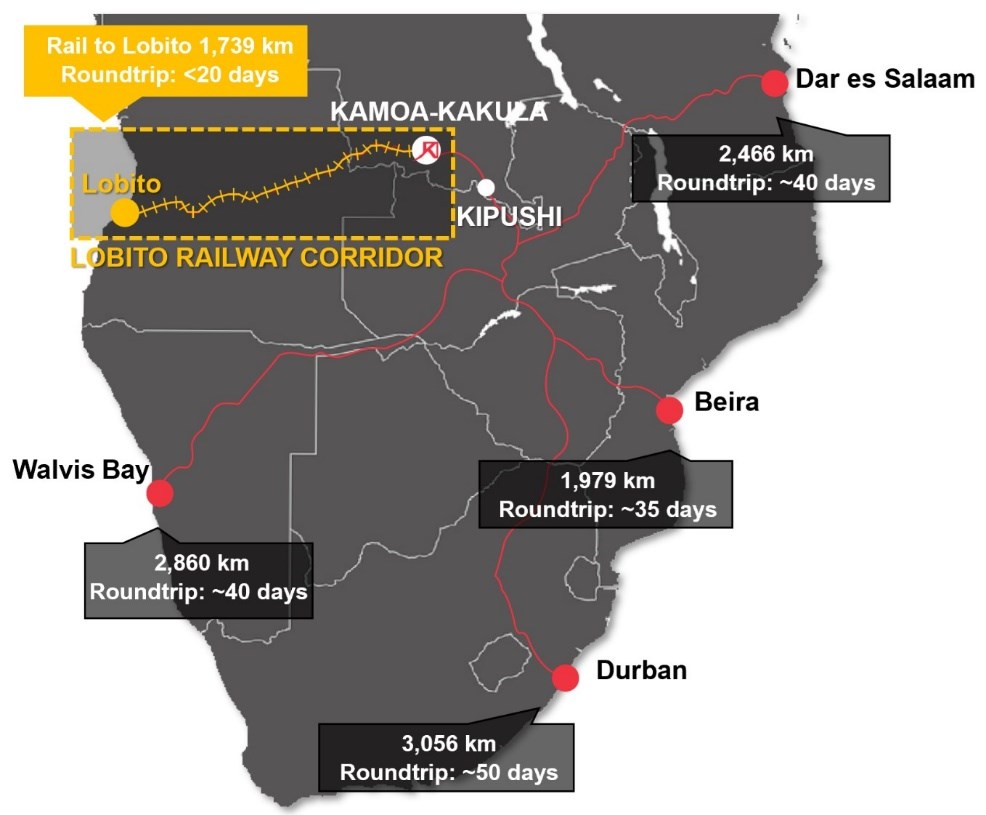
Figure 1: Map of export routes currently used by Kamoa-Kakula in red, as well as the Lobito Corridor route in orange.
To view an enhanced version of this graphic, please visit:
https://images.newsfilecorp.com/files/3396/284365_fc95c4cbb463283a_004full.jpg
Stage Two dewatering of Kakula Mine is complete; selective mining on the eastern side commenced ahead of schedule in late December
As announced on January 2, 2026, Stage Two dewatering activities were completed in December 2025, with the first pair of high-capacity submersible dewatering pumps (Pumps 3 and 4) running dry. Stage Three dewatering activities are currently ramping up and are expected to continue into Q2 2026, and will not be on the critical path for Kakula's mining operations.
Stage Three dewatering activities consist of re-commissioning the existing, water-damaged underground horizontal pump stations, which are used for steady-state operations. The rehabilitation work consists of fitting new pump motors, substations and electrical cabling. All required equipment is on site.
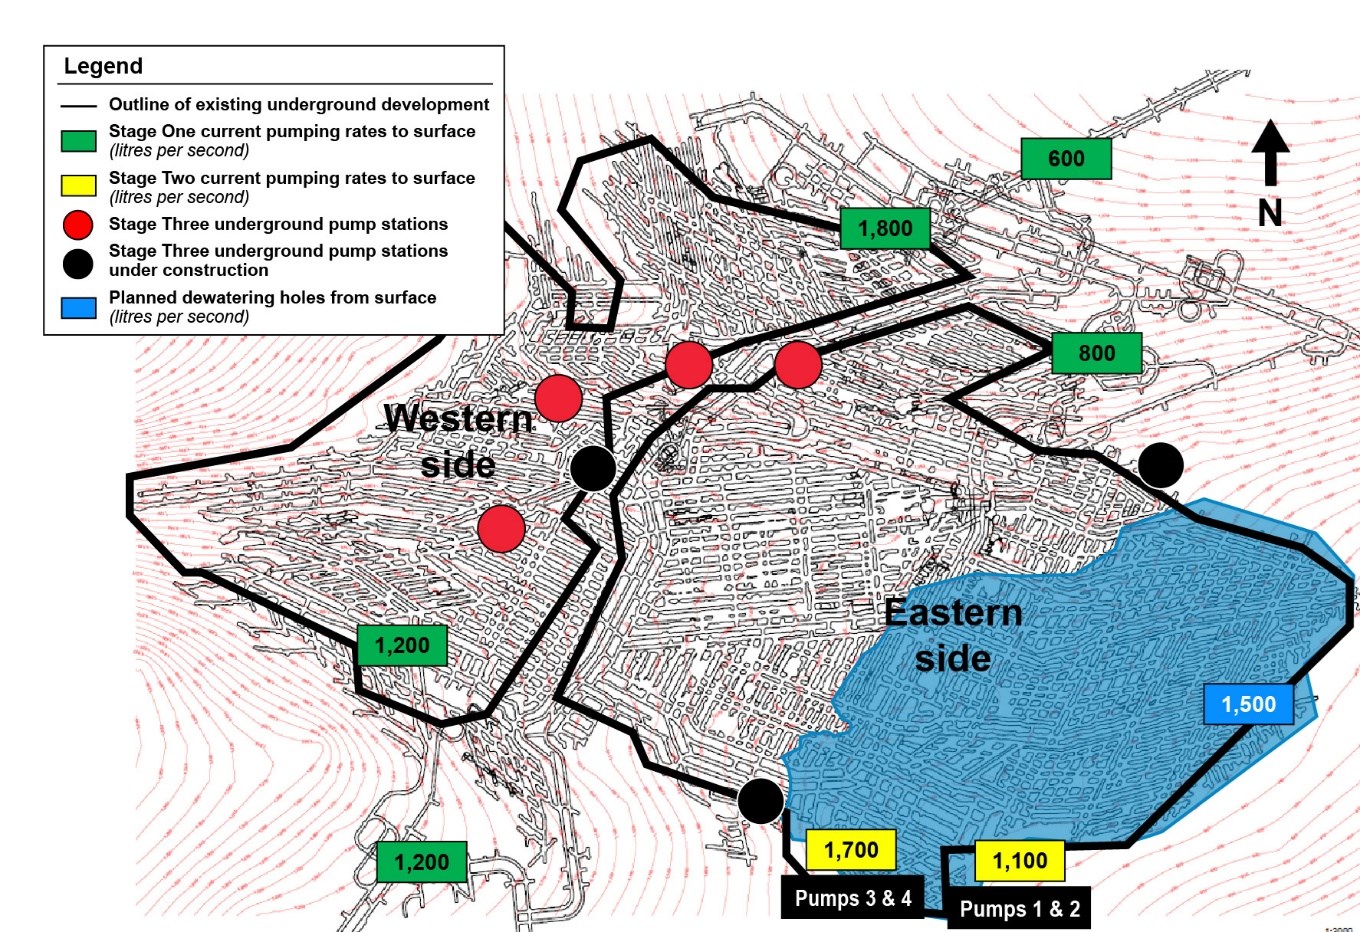
Figure 2. A schematic of the underground water levels at the Kakula Mine as at the end of January, 2026, overlaid with the underground pumping infrastructure.
To view an enhanced version of this graphic, please visit:
https://images.newsfilecorp.com/files/3396/284365_fc95c4cbb463283a_005full.jpg
Updated life-of-mine plan for Kamoa-Kakula on track for completion end of Q1 2026; targeting increase of annualized copper production to between 500,000 and 550,000 tonnes from Phase 1, 2 and 3 concentrators
An updated life-of-mine plan for Kamoa-Kakula is on track for the end of March 2026. The plan will update reserve and resource estimates, based on updated mining methods and technical parameters implemented since the seismic event and subsequent recovery plan, with input from geotechnical and other subject matter experts.
The study targets ramping up mining rates to 17 million tonnes per year from the planned recovery at Kakula underground mine and expanded mining rates from Kansoko, Kamoa 1 and Kamoa 2 underground mines, in order to fully utilize Phase 1, 2 and 3 concentrator capacity. Copper production is targeted in the range of 500,000 to 550,000 tonnes over the medium-term, prior to the implantation of the potential Phase 4 expansion.
Kamoa-Kakula's Project 95 advancing for completion in early Q2 2026, boosting copper recoveries of Phase 1 and 2 concentrators
Kamoa-Kakula's Project 95 is over
During the interim period, while the Kakula Mine is undergoing turnaround, a portion of the ore feed to the Phase 1 and 2 concentrators, sourced from both the Kakula and Kamoa mines, will be of lower grade. Kamoa-Kakula's engineering team aims to maintain a recovery rate from the lower-grade sources of at least
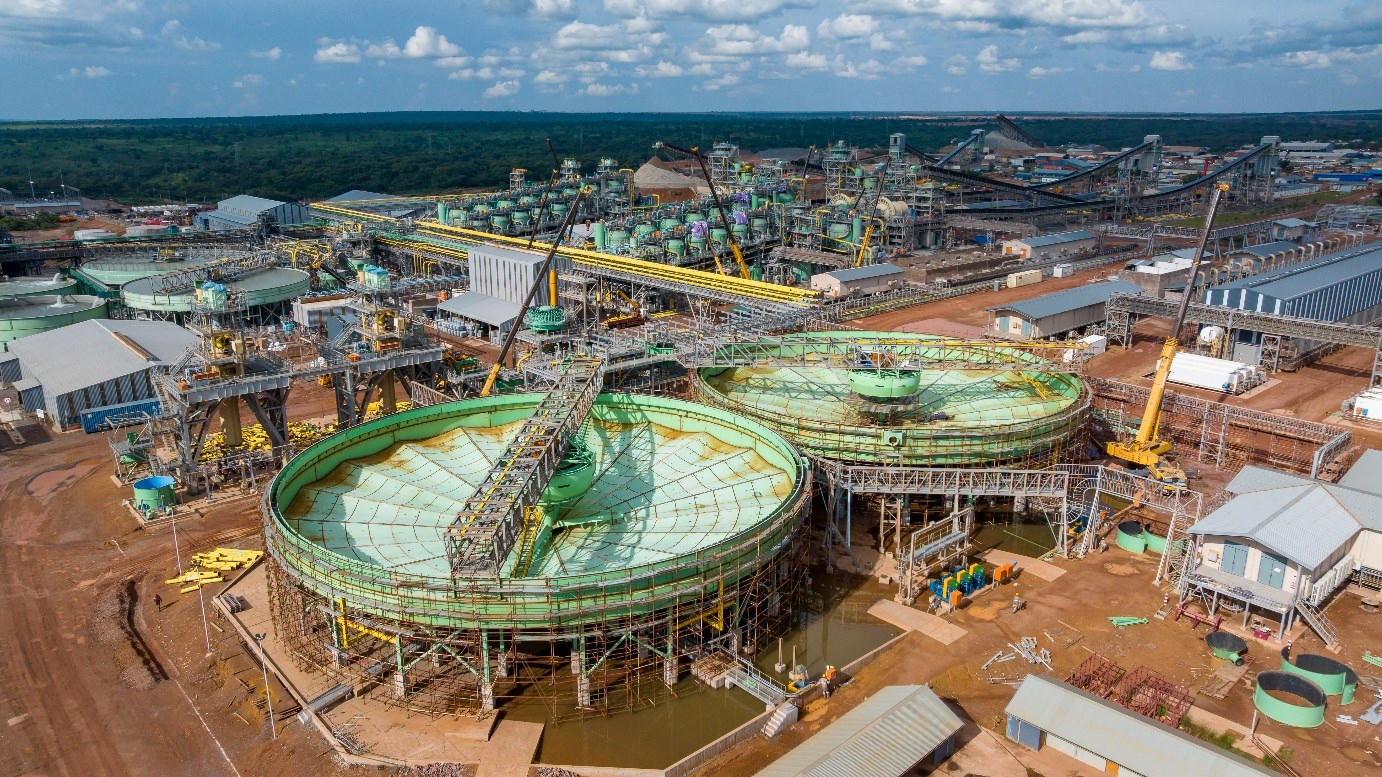
Project 95 construction works are advancing well for completion in early Q2 2026. The foreground shows newly installed thickeners, with the adjacent Phase 1 and 2 concentrators in the background.
To view an enhanced version of this graphic, please visit:
https://images.newsfilecorp.com/files/3396/284365_fc95c4cbb463283a_006full.jpg
Kamoa-Kakula's 60-megawatt, on-site solar (PV) facility construction is progressing well at
Construction of the two on-site 30-MW solar facilities is progressing well. The facilities, which will be owned, operated, and funded by CrossBoundary Energy and Green World Energie, have a combined installed capacity of 433 MW of Solar Photovoltaic (PV) and 1,107 megawatt-hours (MWh) of battery energy storage system (BESS) capacity. Kamoa Copper will be the sole off-taker of the electricity produced by both facilities. Construction is advancing well at approximately
Kamoa-Kakula plans to expand its on-site solar facilities further over time, targeting a baseload capacity of up to 120 MW.
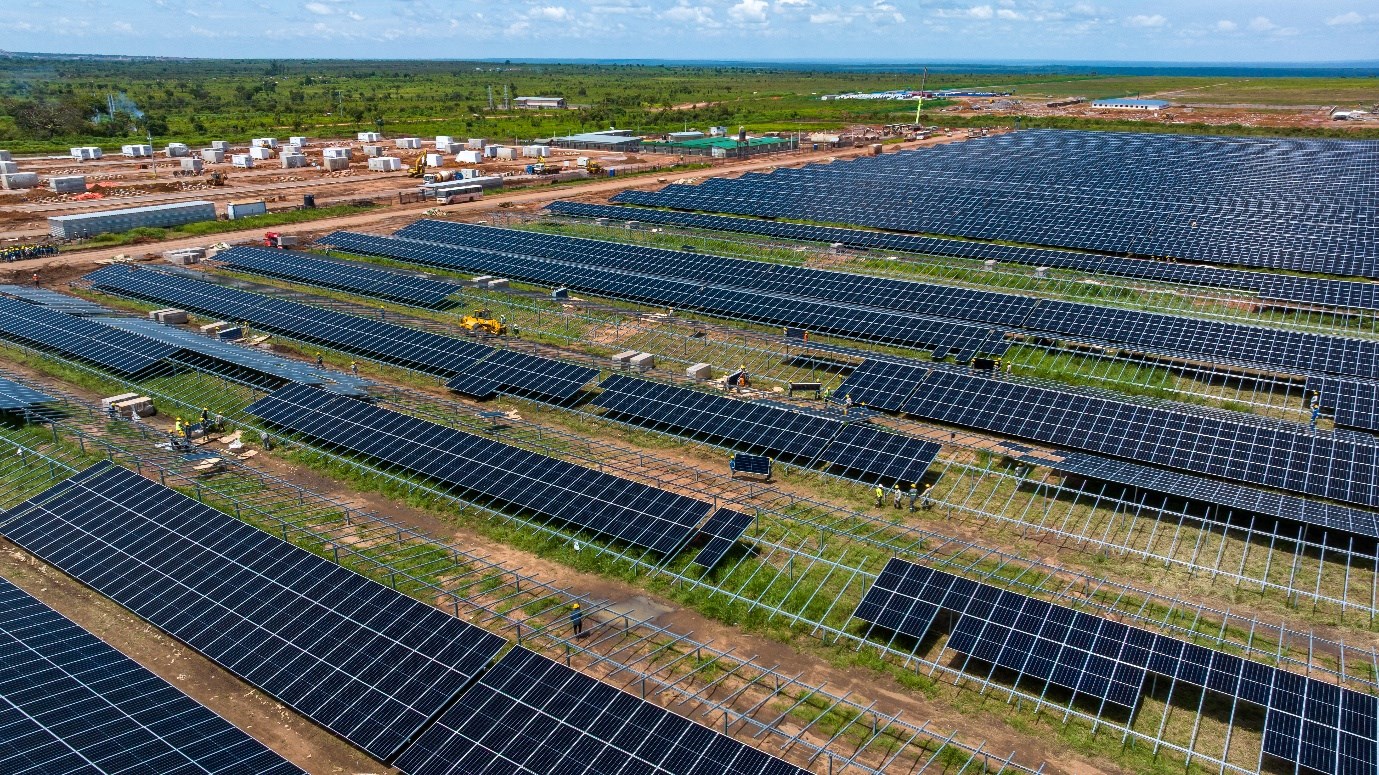
Aerial view of the 60-MW solar (PV) power plant, with battery storage, at Kamoa-Kakula. Commercial operation of the facility is expected during Q2 2026.
To view an enhanced version of this graphic, please visit:
https://images.newsfilecorp.com/files/3396/284365_fc95c4cbb463283a_007full.jpg
DRC grid transmission upgrades increasing power delivered to Kamoa-Kakula from newly refurbished 178-megawatt Turbine #5 at Inga II
The newly refurbished Turbine #5 at the Inga II hydroelectric facility ramped up to full capacity in early Q4 2025, delivering approximately 178 MW of clean, hydroelectric power into the DRC grid. Of the 178 MW being delivered to the grid, Kamoa-Kakula is currently receiving an initial 50 MW, bringing its total domestically sourced power to approximately 110 MW.
As grid upgrades are completed, hydroelectric power delivery to Kamoa-Kakula is expected to increase, along with improved voltage stability. The grid improvement initiatives primarily focus on upgrades to substations at Inga and Kolwezi. The first upgrades, consisting of upgraded resistor banks at the Inga and Kolwezi substations, were completed in Q2 2025 and Q4 2025, respectively.
A static compensator upgrade at the Kolwezi substation is currently underway for completion by the end of Q1 2026, increasing power delivery to the Kamoa-Kakula by a further 35 MW. The remaining workstreams to upgrade the filter banks at the Inga and Kolwezi substations will occur in phases over the next 12 months, ultimately increasing the total power delivered to Kamoa-Kakula from Turbine #5 to 150 MW.
2026 AND 2027 COPPER PRODUCTION, CAPITAL EXPENDITURE AND CASH COST GUIDANCE
| Kamoa-Kakula Guidance | 2026 | 2027 |
| Contained copper in concentrate (tonnes) | 380,000 - 420,000 | 500,000 - 540,000 |
| Cash cost (C1) ($/lb. payable copper produced) | 2.20 - 2.50 | 1.90 - 2.30 |
| Capital expenditure ($ million) | 1,100 - 1,400 | 750 - 950 |
Guidance figures are on a
Kamoa-Kakula's guidance is based on several assumptions and estimates. It involves estimates of known and unknown risks, uncertainties, and other factors that may cause the actual results to differ materially.
Although mining in the western side of the Kakula Mine has restarted, risk factors remain, including the integrity of underground infrastructure once fully dewatered, the ability to ramp up underground operations in line with expectations, the ability to access in the required time new mining areas. Guidance for Kamoa-Kakula is based on an assessment of these factors that management believes are reasonable at this time, given all available information.
Production is reported as contained copper in concentrate in tonnes, in line with previous years. With the ongoing ramp-up of the on-site Kamoa-Kakula smelter to its annualized run rate of 500,000 tonnes per annum, the majority of concentrate produced by the Phase 1, 2, and 3 concentrators is expected to be processed through the smelter producing copper anodes, with any excess concentrate toll-treated at the Lualaba Copper Smelter (LCS), near Kolwezi, on the DRC Copperbelt. The mid-point of Kamoa-Kakula's copper production is 400,000 tonnes of copper, representing approximately
The Kamoa-Kakula Copper Complex produced a total of 71,569 tonnes of copper in concentrate for the fourth quarter of 2025 and 388,841 for the year.
Cash cost (C1) guidance is based primarily on assumptions, including tonnes of ore mined, feed grades of processed copper ore, concentrator recoveries, as well as the timing and ramp-up of the on-site smelter, among other variables.
Cash cost (C1) is a non-GAAP measure used by management to evaluate operating performance and includes all direct mining, processing, stockpile rehandling charges, and general and administrative costs. Smelter charges and freight deductions on sales to the final port of destination (typically China), which are recognized as a component of sales revenues, are added to cash cost (C1) to arrive at an approximate cost of delivered finished metal.
For historical comparatives and a reconciliation to the most directly comparable measure under IFRS, see the non-GAAP Financial Performance Measures section in this press release and the company's MD&A for the three and twelve months ended December 31, 2025.
2. Kipushi Mine
Democratic Republic of Congo
The ultra-high grade Kipushi underground zinc-copper-germanium-silver-lead mine in the DRC is located adjacent to the town of Kipushi on the Zambian border, approximately 30 kilometres southwest of Lubumbashi on the Central African Copperbelt. Kipushi is approximately 250 kilometres southeast of the Kamoa-Kakula Copper Complex. Ivanhoe acquired a
Ivanhoe, together with its joint-venture partner, restarted the Kipushi zinc mine in mid-2024, with the ramp-up to steady state operations continuing during the quarter. On November 17, 2024, His Excellency Félix Tshisekedi, President of the Democratic Republic of the Congo, along with a government delegation, officially reopened the Kipushi zinc mine. Ramp-up of the Kipushi concentrator, following the successful completion of the debottlenecking program, was completed in Q4 2025.
Kipushi summary of operating and financial data
| FY 2025 | Q4 2025 | Q3 2025 | Q2 2025 | Q1 2025 | |||||||||||
| Kipushi concentrator | |||||||||||||||
| Ore tonnes milled (tonnes) | 667,747 | 194,140 | 168,862 | 153,342 | 151,403 | ||||||||||
| Feed grade of ore milled (%) | |||||||||||||||
| Zinc recovery (%) | |||||||||||||||
| Zinc in concentrate produced (tonnes) | 203,168 | 61,444 | 57,200 | 41,788 | 42,736 |
Data in bold denotes a quarterly or annual record
| FY 2025 | Q4 2025 | Q3 2025 | Q2 2025 | Q1 2025 | |||||||||||
| Payable zinc sold (tonnes) | 171,275 | 48,075 | 49,744 | 43,348 | 30,108 | ||||||||||
| Cost of sales per pound ($ per lb.) | 1.12 | 1.13 | 1.11 | 1.05 | 1.23 | ||||||||||
| Cash cost (C1) ($ per lb.) | 0.92 | 0.86 | 0.95 | 0.96 | 0.93 | ||||||||||
| Realized zinc price ($ per lb.) | 1.31 | 1.44 | 1.27 | 1.23 | 1.29 | ||||||||||
| Sales revenue before remeasurement ($'000) | 433,235 | 133,792 | 126,855 | 92,875 | 79,713 | ||||||||||
| Remeasurement of contract receivables ($'000) | 7,983 | 4,246 | 2,548 | 3,882 | (2,693 | ) | |||||||||
| Sales revenue after remeasurement ($'000) | 441,218 | 138,038 | 129,403 | 96,757 | 77,020 | ||||||||||
| EBITDA ($'000) | 90,688 | 44,211 | 26,674 | 9,295 | 10,508 | ||||||||||
| EBITDA margin (% of sales revenue) |
C1 cash cost per pound of payable zinc sold can be further broken down as follows:
| FY 2025 | Q4 2025 | Q3 2025 | Q2 2025 | Q1 2025 | ||||||||||||||
| Mining | ($ per lb.) | 0.17 | 0.18 | 0.18 | 0.16 | 0.16 | ||||||||||||
| Processing | ($ per lb.) | 0.09 | 0.09 | 0.05 | 0.08 | 0.12 | ||||||||||||
| Logistics charges | ($ per lb.) | 0.47 | 0.44 | 0.49 | 0.50 | 0.47 | ||||||||||||
| Treatment charges | ($ per lb.) | 0.06 | 0.07 | 0.07 | 0.07 | 0.05 | ||||||||||||
| Support services | ($ per lb.) | 0.13 | 0.08 | 0.16 | 0.15 | 0.13 | ||||||||||||
| Cash cost (C1) per pound of payable zinc sold | ($ per lb.) | 0.92 | 0.86 | 0.95 | 0.96 | 0.93 |
Cash cost (C1) is prepared on a basis consistent with the industry standard definitions by Wood Mackenzie cost guidelines, but cash cost per pound for the Kipushi Mine has been presented on a per tonne sold basis to eliminate the impact of unsold tonnes of zinc concentrate in inventory. Cash cost (C1) and cash cost per pound are not measures recognized under IFRS Accounting Standards. C1 cash cost is used by management to evaluate operating performance and includes all direct mining, processing, and general and administrative costs. Smelter charges and freight deductions on sales to the final port of destination, which are recognized as a component of sales revenues, are added to C1 cash cost to arrive at an approximate cost of delivered, finished metal. C1 cash cost excludes royalties, production taxes, and non-routine charges as they are not direct production costs.
All figures are on a
Kipushi concentrator produced a record 203,168 tonnes of zinc in 2025, achieving guidance, including a record 61,444 tonnes of zinc in Q4 2025
Zinc production from the Kipushi concentrator continued to improve in the fourth quarter, breaking the third-quarter throughput and production records. The improvement in production rates was attributed to the ramp-up following the completion of the debottlenecking program in the third quarter, as well as improved power availability due to the installation of additional back-up generator power mid-quarter.
Following improved production rates in the second half of 2025, the Kipushi operations achieved the originally stated production guidance of between 180,000 and 240,000 tonnes of zinc.
Engineering work on the debottlenecking program commenced in late Q3 2024 to boost the concentrator throughput rate by
Multiple concentrator records have since been achieved, including a monthly record of 22,629 tonnes of zinc in concentrate produced in December. In addition, during December, recoveries averaged a record
Despite improved production rates, operations remain affected by electrical grid instability. An additional six megawatts of back-up generator capacity were installed in the fourth quarter, improving operational consistency. The new generators increase the total onsite back-up power to 20 megawatts, sufficient to maintain steady-state operations during periods of grid instability.
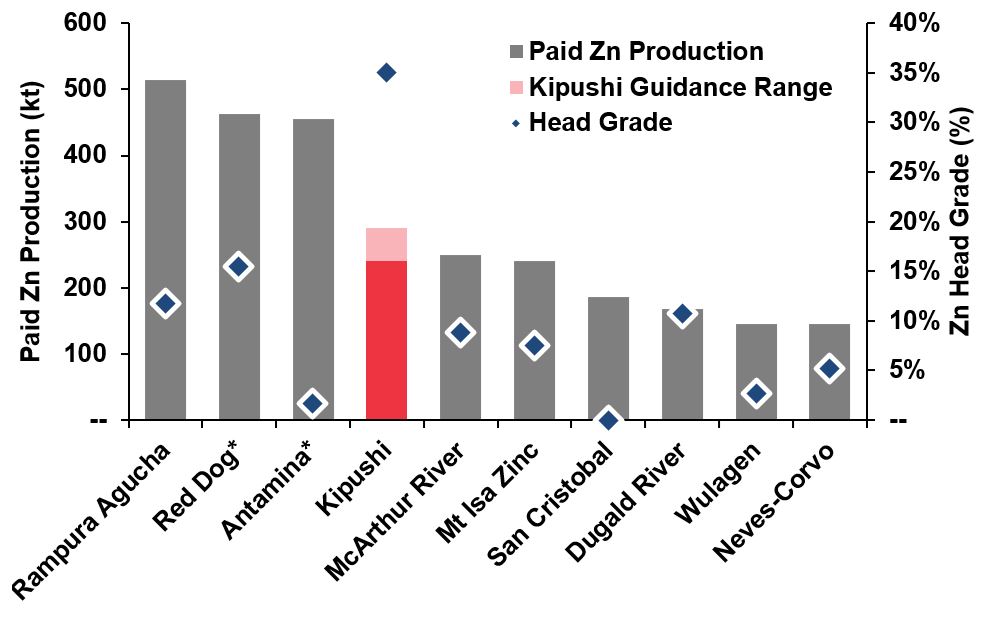
Figure 3. World's top 10 zinc mines in 2025, by contained zinc production per annum ('000 tonnes) with head grade (% zinc), with Kipushi's 2026 production guidance range.
To view an enhanced version of this graphic, please visit:
https://images.newsfilecorp.com/files/3396/284365_ivanhoe8.jpg
Source: S&P Capital IQ, 2025. Production for Kipushi is 2026 guidance range as disclosed on January 14, 2026
Notes: 2025 paid zinc production and head grade per Capital IQ estimates. Lanping Jinding excluded.
*2024 actual zinc head grade due to unavailability of 2025 estimates
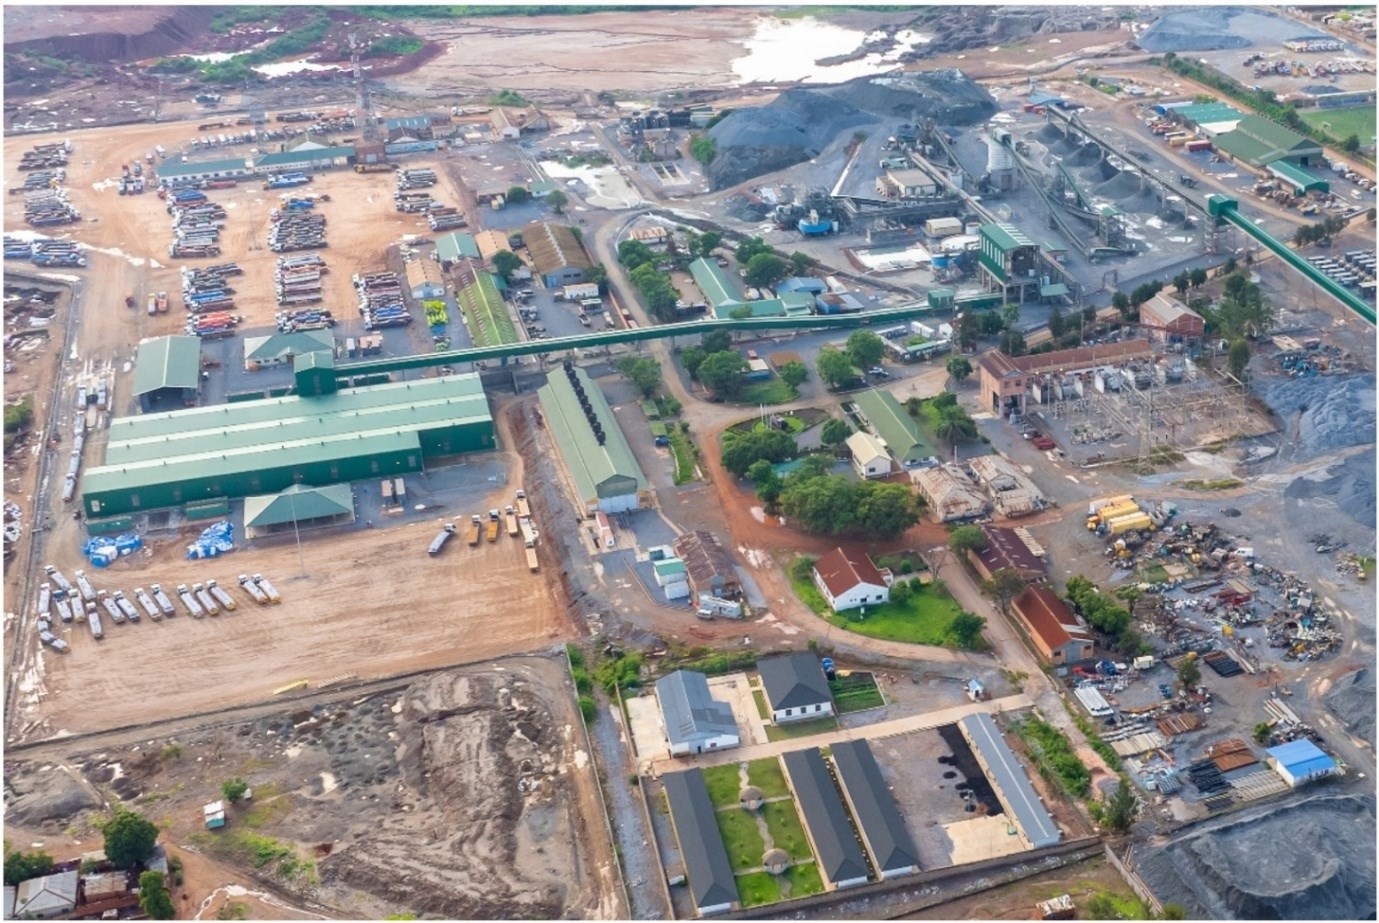
Aerial view of the Kipushi concentrator. The concentrator produced a record 203,168 tonnes of zinc in concentrate during 2025, achieving guidance.
To view an enhanced version of this graphic, please visit:
https://images.newsfilecorp.com/files/3396/284365_fc95c4cbb463283a_009full.jpg
2026 ZINC PRODUCTION, CASH COST AND CAPITAL EXPENDITURE GUIDANCE
| Kipushi 2026 Guidance | ||
| Contained zinc in concentrate (tonnes) | 240,000 to 290,000 | |
| Cash cost (C1) ($ per pound of payable zinc) | 0.85 to 0.95 | |
| Capital expenditure ($ million) | 60 |
Guidance figures are on a
Kipushi's guidance is based on several assumptions and estimates of known and unknown risks, uncertainties, and other factors that may cause the actual results to differ include reliability of DRC grid power supply and prevailing logistics rates, among other variables. Metal reported in concentrate is before treatment losses or payability deductions associated with smelter terms.
Kipushi Mine produced a total of 61,444 tonnes of zinc for the fourth quarter of 2025, and 203,168 tonnes of zinc for the year.
Cash cost (C1) is a non-GAAP measure used by management to evaluate operating performance and includes all direct mining, processing, stockpile rehandling charges, and general and administrative costs. Smelter charges and freight deductions on sales to the final port of destination, which are recognized as a component of sales revenues, are added to cash cost (C1) to arrive at an approximate cost of delivered finished metal.
For historical comparatives and a reconciliation to the most directly comparable measure under IFRS see the non-GAAP Financial Performance Measures section of this press release and the company's MD&A for the three and twelve months ended December 31, 2025.
3. Platreef Mine
South Africa
The Platreef Mine is located on the Northern Limb of the Bushveld Igneous Complex in Limpopo Province - approximately 280 kilometres northeast of Johannesburg and eight kilometres from the town of Mokopane in South Africa. The project is owned by Ivanplats (Pty) Ltd. (Ivanplats), which is
Platinum-group metals (PGM) mineralization in the Northern Limb is primarily hosted within a 30-kilometre mineralized sequence. Platreef is contiguous with, and along strike from, Valterra Platinum's Mogalakwena PGM operations. Platreef hosts an underground deposit of platinum-group metals, nickel, copper, and gold mineralization, called the Flatreef deposit. The Flatreef is a thick, relatively flat-lying and high-grade orebody, which is amenable to highly mechanized, highly productive, underground bulk mining methods.
Since 2007, Flatreef has become one of the largest undeveloped precious metals deposits globally, with 56 million ounces in platinum equivalent Indicated Mineral Resources and 74 million ounces in platinum equivalent Inferred Mineral Resources, at a 2.0 g/t platinum, palladium, rhodium, and gold (3PE + AU) cut-off. The Flatreef is also host to one of the world's largest undeveloped nickel sulphide mineral resources.
On November 18, 2025, the Platreef Mine was officially opened by the President of the Republic of South Africa, Cyril Ramaphosa.
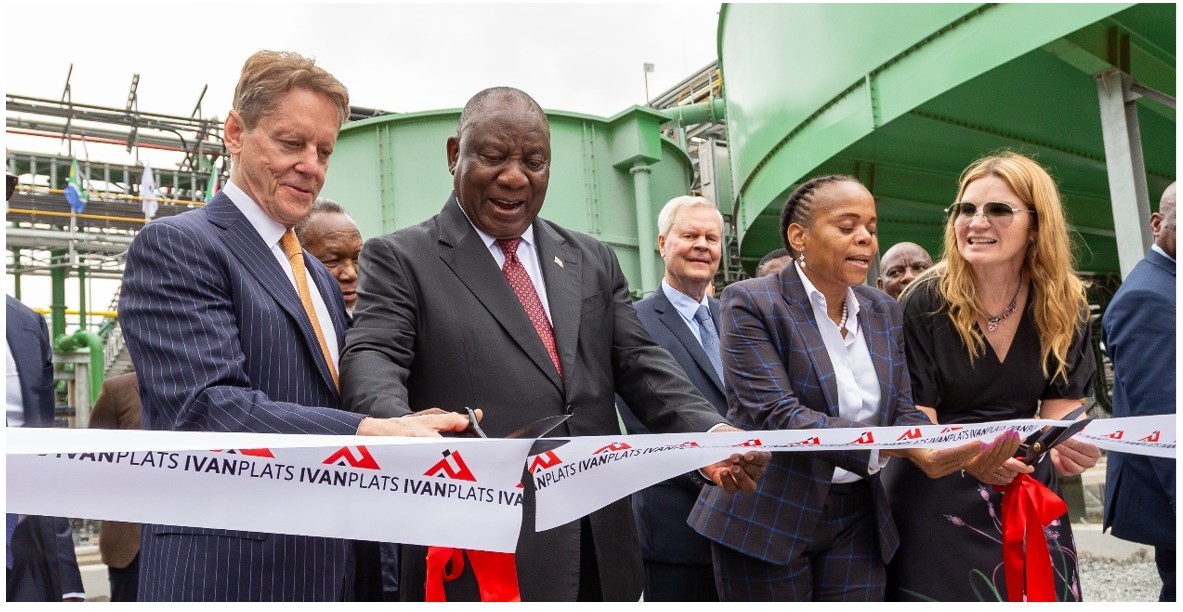
(L-R, foreground) Ivanhoe Mines' Founder and Executive Co-Chairman, Robert Friedland, and President of the Republic of South Africa, Cyril Ramaphosa, sharing a pair of scissors; Premier of Limpopo Province, Dr. Phophi Ramathuba, and Ivanhoe Mines' President and Chief Executive Officer, Marna Cloete, cutting a ribbon marking the formal opening of the Platreef Mine. (L-R background) Former President of South Africa, Kgalema Motlanthe, and Bill Hayden, former Ivanhoe Mines director. Mr. Hayden was the geologist who originally conceived the idea of mineral exploration in the Lebowa Homeland Administration, and he was instrumental in the initial discovery of the Flatreef orebody.
To view an enhanced version of this graphic, please visit:
https://images.newsfilecorp.com/files/3396/284365_fc95c4cbb463283a_010full.jpg
First concentrate produced from Platreef Mine's Phase 1 concentrator in November 2025; ramp-up to accelerate following completion of Shaft #3 next month.
The Platreef Mine's Phase 1 concentrator produced the first batch of platinum-palladium-nickel-rhodium-gold-copper concentrate on November 18, 2025, during the official opening ceremony. Since then, the concentrator continues to ramp up.
Lower-grade development ore is currently being campaigned through the Phase 1 concentrator during the initial ramp-up stages, until Shaft #3 is ready to hoist ore in early April 2026, after which feed will be increasingly replaced by production ore.
From early Q2 2026, the concentrator is expected to steadily ramp-up, consistently achieving
Since late Q4 2025, underground development has also advanced on the 750-metre level and the 850-metre level, where the Flatreef orebody was first intersected in May 2025. Blasting of the first long-hole stoping blocks (production mining) on the Platreef 850-metre level is expected imminently. Ore tonnes from the long-hole stopes will only be hoisted to surface in early Q2 2026 once Shaft #3 is ready to hoist.
The completion of Shaft #3 is on track and is expected to be ready to hoist ore in April 2026. Barrel equipping of the shaft and construction of the underground loading box were both recently completed. The remaining workstreams of installing the permanent headframe and completing the installation of the underground conveyors and loading infrastructure are on track to be completed within the next month.
Shaft #3 will increase the Platreef Mine's available hoisting capacity by approximately five times to 5.0 million tonnes per annum (Mtpa). The new shaft will enable greater flexibility of hoisting to surface both ore and waste from the mine. Therefore, waste generated from the widening of Shaft #2, as well as waste development required in preparation for the Phase 2 expansion, can be hoisted concurrently with ore for the Phase 1 concentrator. This would not have been possible with Shaft #1 alone.
In addition, the first sale of concentrate from the Phase 1 concentrator to Northam Platinum Ltd, of Johannesburg, South Africa, took place in December 2025.
Phase 2 project development already underway, targeting completion during Q4 2027, increasing production to over 450,000 ounces of platinum, palladium, rhodium and gold
The Ivanplats project team has commenced work on the Phase 2 expansion, targeted for completion in Q4 2027. DRA Global of Perth, Australia, was appointed in Q4 2025 as the engineering, procurement and construction management (EPCM) contractor for the Phase 2 underground infrastructure and the 3.3-million-tonne-per-annum Phase 2 concentrator. DRA Global was the EPCM contractor that delivered the Phase 1 concentrator on schedule in June 2024. Early works on the Phase 2 concentrator site, located adjacent to the Phase 1 concentrator, have recently commenced.
In addition, the expansion of Shaft #2 from an initial diameter of 3.1 metres to a diameter of 10 metres, will commence in April 2026. United Mining Services (UMS) Group of Johannesburg, South Africa, was appointed in Q4 2025 as the contractor to increase the diameter and line the shaft., a process called slype and lining. Raise boring of Shaft #2 to the initial diameter of 3.1-metres was completed in Q4 2024, the final diameter of the shaft will be 10 metres.
In December 2023, Ivanplats closed a senior debt facility with Societe Generale and Nedbank Limited to fund Phase 1 construction. A total of
Following completion of the updated Phase 2 feasibility study, as announced on February 18, 2025, Ivanhoe Mines has been focused on arranging an enlarged project finance package to cover the majority of the capital requirements for the Phase 2 expansion.
In late Q4 2025, credit approvals were received, and underwriting engagements signed with Societe Generale, Absa Bank Limited and Nedbank Limited for the
Financing for the future Phase 3 expansion is expected to be underpinned by cash flow generated from Platreef's Phase 1 and 2 operations.
The Platreef Mine is set to be one of the largest and lowest-cost producers of platinum, palladium, rhodium, and gold, with nickel and copper by-products.
On February 18, 2025, two independent studies were completed on the three-phase development of the Platreef Mine. This included an updated Feasibility Study on the Phase 2 expansion to 4.1 million tonnes per annum (Mtpa) of processing capacity, as well as a Preliminary Economic Assessment covering a new Phase 3 expansion to 10.7 Mtpa of processing capacity. The excellent results from both studies reinforce the multi-generational Platreef Mine's industry-leading margins.
The Platreef Mine is projected to be the lowest-cost primary platinum-group-metals producer globally. The Phase 2 life-of-mine total cash cost is estimated to be
Following the Phase 3 expansion, as shown in Figure 4, the Platreef Mine is expected to be one of the world's largest primary platinum group metal producers on a platinum-equivalent basis.
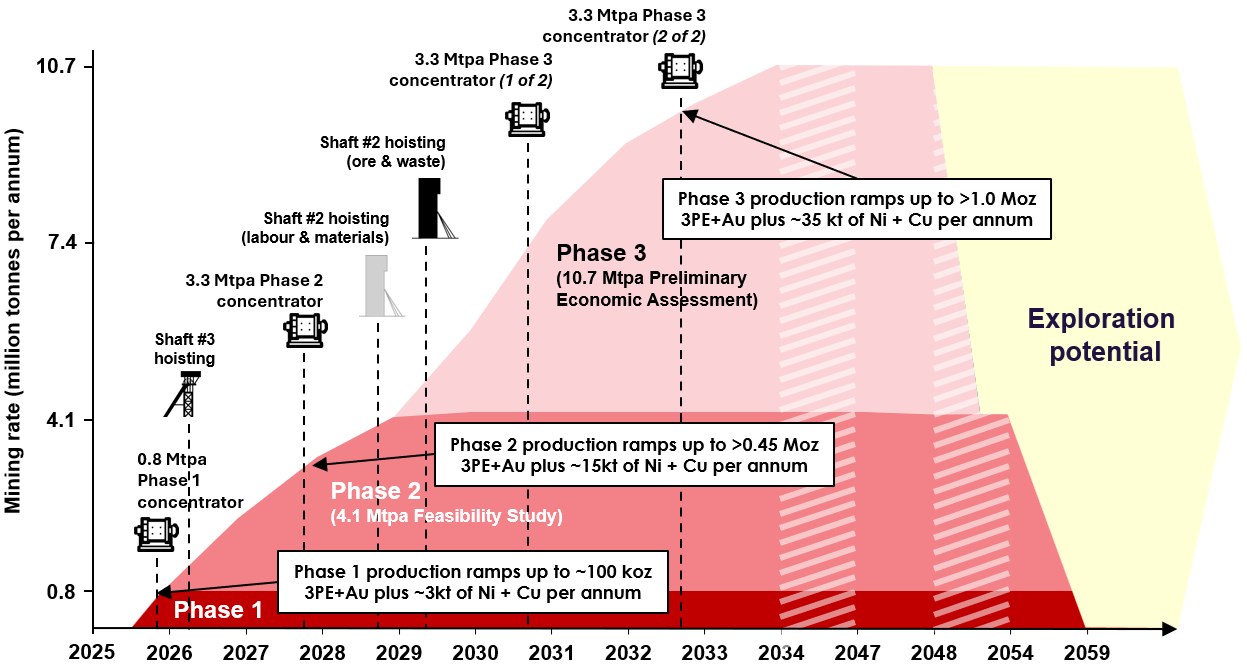
Figure 4. Phased development schematic of the Platreef Mine, showing the annualized mining rate over the life of mine.
To view an enhanced version of this graphic, please visit:
https://images.newsfilecorp.com/files/3396/284365_fc95c4cbb463283a_011full.jpg
First production from the Phase 1 concentrator was achieved in Q4 2025, with ramp-up underway to achieve an annualized production rate of approximately 100,000 ounces of 3PE+Au. Development has already commenced on the Phase 2 expansion, which is expected to be completed 2 years later in Q4 2027. Annualized production increases almost five-fold following the Phase 2 expansion to over 460,000 ounces of 3PE+Au, plus approximately 9,000 tonnes of nickel and 6,000 tonnes of copper. The Phase 3 expansion further doubles annualized production to over 1 million ounces of 3PE+Au, plus approximately 22,000 tonnes of nickel and 13,000 tonnes of copper.
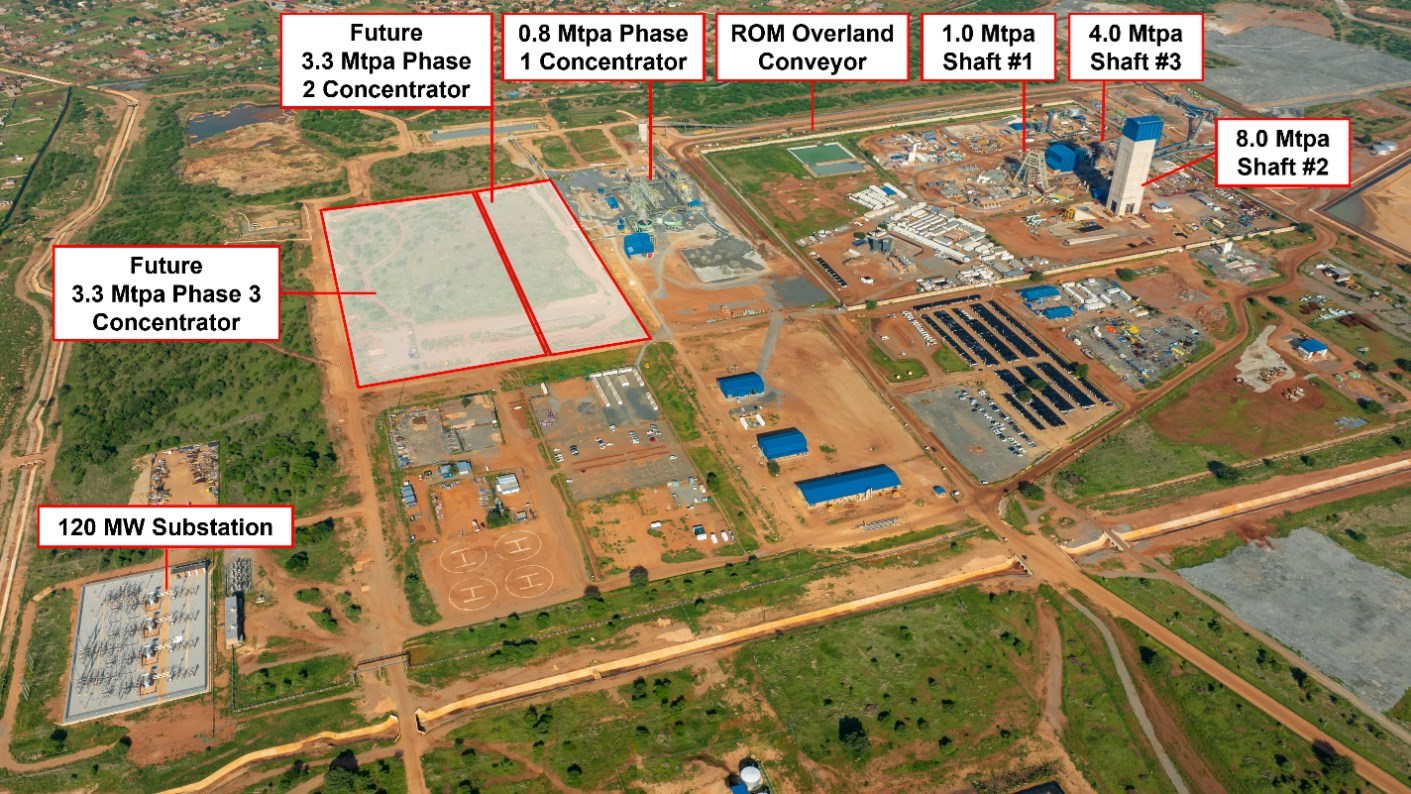
Aerial view of the Platreef Mine site, showing the current Phase 1 concentrator, shaft headframes and associated surface infrastructure, as well as an outline of the locations for the future Phase 2 and 3 concentrators.
To view an enhanced version of this graphic, please visit:
https://images.newsfilecorp.com/files/3396/284365_fc95c4cbb463283a_012full.jpg
4. Global Exploration Portfolio
Western Forelands Exploration Project, DRC
The Western Forelands Exploration Project consists of a package of licences spanning an area approximately six times larger than that of the adjacent Kamoa-Kakula Copper Complex. Ivanhoe's DRC exploration group is targeting sedimentary-hosted, Kamoa-Kakula-style copper mineralization across its Western Forelands exploration licences, as it continues to expand the discoveries made in the Makoko District, as well target new high-grade copper discoveries across the vast licence package.
The Makoko District drilling program is primarily focused on wide-spaced, step out drilling to continue to delineate the extent of mineralization. Notably, drilling to the east and to the south of the Makoko District continues to identify extensions of mineralization. For the third year in a row, preparations were made for drilling across the Makoko District to continue throughout the wet season. The wet season is expected to last until May.
Drilling activities during the fourth quarter were primarily concentrated on the Makoko District, which includes Makoko, Makoko West and Kitoko, as well as on the newly acquired Tshipaya licences, unless the onset of the wet season inhibited access. Additional reverse circulation (RC) drilling was completed at the Kamilli prospect.
A total of 14,016 metres of diamond drilling were completed in 25 diamond drill holes, as well as 6,277 metres of RC drilling from 214 holes, underscoring the continued momentum of the exploration program. A total of 52,870 metres of diamond drilling and 7,150 metres of reverse circulation drilling were completed in 2025.
The Makoko District drilling program was primarily focused on wide-spaced, step out drilling to continue to delineate the broader mineralized footprint. Recent drilling east of Makoko confirmed continuous mineralization extending over more than 2 kilometres along strike and eastwards towards Kakula West, reaffirming the district's strong growth potential.
Exploration drilling at Tshipaya continued to refine the geological model across the licence area. Key results included intersections of 200 metres of Roan conglomerate in the southern region, improving understanding of favourable host stratigraphy.
Results from the 2025 drilling program are being consolidated into an updated regional geological model, with follow-up drilling planned for the dry season in 2026.
Ground gravity geophysics surveys progressed until late November, when wet-season-access constraints came into effect. Geophysics survey coverage included Tshipaya and a second area east of Kakula. The gravity data has proven effective in identifying zones of increased weathering associated with younger brittle faulting and fracture zones-features often difficult to resolve in areas with limited magnetic contrast.
At the Kamilli target, RC drilling provided access to primary bedrock beneath the Kalahari sand cover, which can reach depths of up to 60 metres and typically obscures geochemical signatures. Samples collected through this program are being analyzed via multi-element geochemistry, the same methodology used for soil sampling, to identify geochemical anomalies concealed beneath the sand.
RC drilling ceased in November due to the onset of the wet season and is planned to resume in Q2 2026, once field conditions permit.
Ivanhoe Mines is targeting an updated mineral resource estimate for the Western Forelands by mid-2026.
North-Western Province, Zambia
Ivanhoe Mines'
The new licences are underpinned by a compelling geological thesis that the prolific Central African Copperbelt extends southwest into Zambia and Angola below Kalahari sand cover. Ivanhoe's exploration team is targeting multiple high-potential mineralization styles, including Basement Domes, Katangan-age sediment-hosted copper systems, and iron-oxide-copper-gold (IOCG) systems.
During Q4 2025, Ivanhoe completed stakeholder engagements for the completion of Environmental Project Briefs (EPBs) across the licence area, which were lodged with the Zambian Environmental Management Authority (ZEMA) by the end of December.
The company has acquired and started to analyze historical geophysical and geological data from the licence's previous owners, leading to several preliminary targets being identified. A new 10,600-line-kilometre Falcon airborne gravity gradiometer (AGG) and magnetics survey was initiated in late December 2025 and is expected to be completed in Q1 2026. Data captured from the surveys will be used to refine the targets of interest for drilling during the planned 7,000-metre drilling program, which is set to commence at the start of the dry season in Q2 2026, subject to approval of the EPBs by ZEMA. Tender adjudication for geoservices and drilling contractors for the 2026 work program was completed in Q4 2025, with awards expected in Q1 2026.
Moxico and Cuando Cubango Provinces, Angola
Ivanhoe Mines is leveraging its proven exploration expertise from the Western Forelands and Kamoa-Kakula to unlock a major new frontier in Angola. The company has secured approximately 22,000 km² of highly prospective exploration licences in the Moxico and Cuando Cubango provinces, one of the largest greenfield sediment-hosted copper exploration packages in the region.
Following the signing of a mining investment contract with Angola's National Agency for Mineral Resources on November 27, 2023, early-stage exploration included airborne magnetic and airborne gravity geophysical mapping of the full 22,000 km2 licence package in June 2024. Ivanhoe's team initiated fieldwork in August 2024 completing a 600 km² baseline soil geochemical sampling program.
Field work in 2025 was concentrated on the eastern licences, focusing on completion of ground-based geophysical work, including Audio-frequency Magnetotellurics (AMT), Magnetotellurics (MT), and passive seismic surveys. Numerous Tromino passive seismic lines were completed in Q3 and Q4 to determine the depth of the Kalahari sands and to optimize the depth of the targets. AMT and MT surveys were completed to map regional structures to enhance the interpretation of the subsurface geology and Katangan basin architecture below cover.
These efforts have already yielded promising results with a total of 13 geophysical targets identified for follow-up. Two diamond drill rigs were mobilized in Q3 2025 for a 6,400-metre stratigraphic diamond drilling program, with drilling commencing in Q4 2025. A single 630-metre drillhole was completed in December 2025. Drilling operations will recommence in Q2-2026 at the start of the dry season.
During Q3 and Q4, medical staff attached to Ivanhoe Mines' field team assisted the local administration in a vaccination drive reaching 41 villages in the Ninda district towards the Zambian border. A total of 2,542 doses of 8 different types of vaccines were administered, with 1,031 children under 5 years receiving Polio vaccinations, and 227 children received MMR vaccinations.
The Chu-Sarysu Basin Exploration Joint Venture, Central Kazakhstan
Ivanhoe Mines has established a strategic exploration joint venture with UK-based Pallas Resources to unlock the potential of the Chu-Sarysu Copper Basin in Kazakhstan. The basin is recognised as the world's third-largest sediment-hosted copper district. The partnership covers a vast and highly prospective 16,708 km² licence area, enriched by a comprehensive archive of Soviet-era exploration data.
Under the agreement announced on February 12, 2025, Ivanhoe has committed to
Regional and prospect scale geophysical and geochemical surveys were completed across the licence package in 2025, advancing the joint venture's understanding of the underexplored, high-potential copper district. Two rigs were mobilized for a 17,500-metre maiden diamond drilling campaign in Q3 2025, with 2,374 metres completed by the end of the year, including copper mineralisation visible in one of the two holes completed.
Mokopane Feeder Project, South Africa
Ivanhoe Mines is advancing exploration on the Northern Limb of South Africa's Bushveld Complex, adjacent to Ivanplats' flagship Platreef Mine. The company is targeting a significant gravity-high anomaly interpreted as a potential massive nickel-copper sulphide primary feeder zone for the region's rich mineralization, including the world-class Flatreef deposit.
Following the completion of comprehensive geological and geophysical data analysis in early 2024, Ivanhoe has identified multiple high-priority drill targets. A 6,000-metre diamond drilling program commenced in Q1 2025, with 3,300 metres completed across two holes to date.
In Q4 2025, a second deep drillhole and a downhole geophysical survey was completed to a depth of 1,451 metres. The 2025 drilling programme confirmed the continuation of Northern Limb Upper Zone - Main Zone stratigraphy downdip of Ivanplats' Platreef Mine. A geological and geophysical review is currently underway to refine the geology model and identify additional drilling targets. Drilling is expected to recommence in Q2 2026 with a new 4,000-metre program for 2026.
SELECTED ANNUAL FINANCIAL INFORMATION
The selected financial information is in accordance with IFRS as presented in the annual consolidated financial statements. All operating revenue from commercial production at Kamoa-Kakula is recognized within the Kamoa Holding joint venture. Ivanhoe did not declare or pay any dividend or distribution in any financial reporting period.
| For the year ended December 31, | |||||||||||
| 2025 | 2024 | 2023 | |||||||||
| $'000 | $'000 | $'000 | |||||||||
| Revenue | 441,615 | 40,818 | - | ||||||||
| Cost of sales | (424,657 | ) | (51,563 | ) | - | ||||||
| Share of profit from joint venture net of tax | 180,604 | 291,908 | 274,826 | ||||||||
| Finance income | 174,160 | 241,535 | 239,563 | ||||||||
| Exploration and project evaluation expenditure | (47,776 | ) | (48,148 | ) | (22,657 | ) | |||||
| Finance costs | (43,019 | ) | (49,135 | ) | (31,497 | ) | |||||
| Share-based payments | (18,383 | ) | (27,919 | ) | (29,269 | ) | |||||
| General and administrative expenditure | (17,885 | ) | (56,582 | ) | (43,833 | ) | |||||
| Deferred tax (expense) recovery | (17,610 | ) | 17,857 | 8,304 | |||||||
| Loss on fair valuation of embedded derivative liability | - | (164,169 | ) | (85,261 | ) | ||||||
| Profit (loss) attributable to: | |||||||||||
| Owners of the Company | 261,555 | 228,135 | 318,928 | ||||||||
| Non-controlling interest | (33,565 | ) | (34,841 | ) | (15,984 | ) | |||||
| Total comprehensive income (loss) attributable to: | |||||||||||
| Owners of the Company | 335,316 | 217,064 | 307,578 | ||||||||
| Non-controlling interest | (25,917 | ) | (36,027 | ) | (17,116 | ) | |||||
| Basic profit per share | 0.19 | 0.17 | 0.26 | ||||||||
| Diluted profit per share | 0.19 | 0.17 | 0.26 | ||||||||
| Total assets | 7,625,844 | 5,737,555 | 5,000,261 | ||||||||
| Non-current liabilities | 1,391,999 | 663,357 | 422,034 | ||||||||
DISCUSSION OF RESULTS OF OPERATIONS
Review of the year ended December 31, 2025 vs. December 31, 2024
The company recorded a profit for the year of
The total comprehensive income for the year ended December 31, 2025, included an exchange gain on translation of foreign operations of
Included in general and administrative expenditure for 2025 is foreign exchange gains of
Ivanhoe's exploration and project evaluation expenditure amounted to
Finance income amounted to
Review of the Kamoa-Kakula Copper Complex for the year ended December 31, 2025 vs. December 31, 2024
The Kamoa-Kakula Copper Complex sold 351,674 tonnes of payable copper in 2025, realizing revenue of
| Year ended | ||||||
| December 31, | ||||||
| 2025 | 2024 | |||||
| $'000 | $'000 | |||||
| Company's share of profit from joint venture | 180,604 | 291,908 | ||||
| Interest on loan to joint venture | 140,947 | 224,258 | ||||
| Company's income recognized from joint venture | 321,551 | 516,166 | ||||
The company's share of profit from the Kamoa Holding joint venture was
| Year ended | ||||||
| December 31, | ||||||
| 2025 | 2024 | |||||
| $'000 | $'000 | |||||
| Revenue from contract receivables | 3,129,241 | 3,158,942 | ||||
| Remeasurement of contract receivables | 151,854 | (52,331 | ) | |||
| Revenue | 3,281,095 | 3,106,611 | ||||
| Cost of sales | (2,188,951 | ) | (1,497,758 | ) | ||
| Gross profit | 1,092,144 | 1,608,853 | ||||
| General and administrative costs | (167,321 | ) | (164,299 | ) | ||
| Amortization of mineral property | (18,846 | ) | (15,205 | ) | ||
| Profit from operations | 905,977 | 1,429,349 | ||||
| Foreign exchange gain (loss) | 169,260 | (21,513 | ) | |||
| Finance income and other | 17,655 | 15,852 | ||||
| Finance costs | (279,381 | ) | (301,243 | ) | ||
| Impairment of property, plant and equipment | (55,995 | ) | - | |||
| Profit before taxes | 757,516 | 1,122,445 | ||||
| Current tax expense | (296,427 | ) | (348,732 | ) | ||
| Deferred tax (expense) recovery | (21,304 | ) | 3,198 | |||
| Profit after taxes | 439,785 | 776,911 | ||||
| Non-controlling interest of Kamoa Holding | (74,929 | ) | (187,198 | ) | ||
| Total comprehensive income for the year | 364,856 | 589,713 | ||||
| Company's share of profit from joint venture ( | 180,604 | 291,908 | ||||
The realized, provisional and forward copper prices used for the remeasurement (mark-to-market) of contract receivables of the Kamoa Holding joint venture for the year ended December 31, 2025, can be summarized as follows:
| FY 2025 | Q4 2025 | Q3 2025 | Q2 2025 | Q1 2025 | ||||||||||||||||
| $'000 | $'000 | $'000 | $'000 | $'000 | ||||||||||||||||
| Realized during the period - open at the start of the period | ||||||||||||||||||||
| Opening forward price ($/lb.)(1) | 4.01 | 4.72 | 4.50 | 4.44 | 4.01 | |||||||||||||||
| Realized price ($/lb.)(1) | 4.14 | 4.85 | 4.40 | 4.27 | 4.14 | |||||||||||||||
| Payable copper tonnes sold | 79,985 | 30,488 | 27,067 | 64,422 | 79,985 | |||||||||||||||
| Remeasurement of contract receivables ($'000) | 21,811 | 8,916 | (5,850 | ) | (23,066 | ) | 21,811 | |||||||||||||
| Realized during the period - new copper sold in the current period | ||||||||||||||||||||
| Provisional price ($/lb.)(1) | 4.37 | 4.87 | 4.41 | 4.23 | 4.11 | |||||||||||||||
| Realized price ($/lb.)(1) | 4.48 | 5.13 | 4.44 | 4.42 | 4.28 | |||||||||||||||
| Payable copper tonnes sold | 301,444 | 28,239 | 43,340 | 63,522 | 45,527 | |||||||||||||||
| Remeasurement of contract receivables ($'000) | 71,382 | 15,776 | 2,529 | 25,473 | 16,807 | |||||||||||||||
| Open at the end of the period - open at the start of the period | ||||||||||||||||||||
| Opening forward price ($/lb.)(1) | - | - | 4.48 | - | - | |||||||||||||||
| Closing forward price ($/lb.)(1) | - | - | 4.72 | - | - | |||||||||||||||
| Payable copper tonnes sold | - | - | 11,126 | - | - | |||||||||||||||
| Remeasurement of contract receivables ($'000) | - | - | 5,877 | - | - | |||||||||||||||
| Open at the end of the period - new copper sold in current period | ||||||||||||||||||||
| Provisional price ($/lb.)(1) | 5.11 | 5.11 | 4.51 | 4.45 | 4.35 | |||||||||||||||
| Closing forward price ($/lb.)(1) | 5.64 | 5.64 | 4.72 | 4.50 | 4.44 | |||||||||||||||
| Payable copper tonnes sold | 50,230 | 50,230 | 18,188 | 38,192 | 64,436 | |||||||||||||||
| Remeasurement of contract receivables ($'000) | 58,661 | 58,661 | 8,516 | 4,036 | 12,368 | |||||||||||||||
| Total remeasurement of contract receivables ($'000) | 151,854 | 83,353 | 11,072 | 6,443 | 50,986 | |||||||||||||||
(1) Calculated on a weighted average basis
The finance costs recognized in the Kamoa Holding joint venture can be broken down as follows:
| Year ended | ||||||
| December 31, | ||||||
| 2025 | 2024 | |||||
| $'000 | $'000 | |||||
| Interest on shareholder loans | 284,602 | 452,917 | ||||
| Interest on provisional and advance payment facilities | 143,776 | 112,182 | ||||
| Interest on syndicated loans | 45,640 | - | ||||
| Interest on bank loans and overdraft facilities | 45,104 | 22,852 | ||||
| Lease liability unwinding | 6,758 | 7,214 | ||||
| Interest on equipment financing facilities | 6,026 | 9,728 | ||||
| Rehabilitation unwinding | 6,023 | 5,951 | ||||
| Interest capitalized as borrowing costs | (258,548 | ) | (309,601 | ) | ||
| 279,381 | 301,243 | |||||
Review of the Kipushi Mine for the year ended December 31, 2025 vs. December 31, 2024
The company sold 171,275 tonnes of payable zinc produced by the Kipushi Mine in 2025 realizing revenue of
The realized, provisional and forward zinc prices used for the remeasurement (mark-to-market) of contract receivables of Kipushi for the year ended December 31, 2025, can be summarized as follows:
| FY 2025 | Q4 2025 | Q3 2025 | Q2 2025 | Q1 2025 | ||||||||||||||||
| $'000 | $'000 | $'000 | $'000 | $'000 | ||||||||||||||||
| Realized during the period - open at the start of the period | ||||||||||||||||||||
| Opening forward price ($/lb.)(1) | 1.34 | 1.34 | 1.26 | 1.29 | 1.34 | |||||||||||||||
| Realized price ($/lb.)(1) | 1.28 | 1.44 | 1.25 | 1.31 | 1.28 | |||||||||||||||
| Payable zinc tonnes sold | 11,596 | 29,464 | 25,986 | 9,690 | 11,596 | |||||||||||||||
| Remeasurement of contract receivables ($'000) | (1,515 | ) | 6,111 | (864 | ) | 425 | (1,496 | ) | ||||||||||||
| Realized during the period - new zinc sold in the current period | ||||||||||||||||||||
| Provisional price ($/lb.)(1) | 1.28 | 1.45 | 1.27 | 1.19 | 1.32 | |||||||||||||||
| Realized price ($/lb.)(1) | 1.31 | 1.43 | 1.30 | 1.20 | 1.30 | |||||||||||||||
| Payable zinc tonnes sold | 138,309 | 15,108 | 20,281 | 21,800 | 20,432 | |||||||||||||||
| Remeasurement of contract receivables ($'000) | 10,646 | (717 | ) | 1,466 | 484 | (878 | ) | |||||||||||||
| Open at the end of the period - new zinc sold in the current period | ||||||||||||||||||||
| Provisional price ($/lb.)(1) | 1.43 | 1.43 | 1.31 | 1.20 | 1.31 | |||||||||||||||
| Closing forward price ($/lb.)(1) | 1.41 | 1.41 | 1.34 | 1.26 | 1.29 | |||||||||||||||
| Payable zinc tonnes sold | 32,966 | 32,966 | 29,464 | 21,547 | 9,676 | |||||||||||||||
| Remeasurement of contract receivables ($'000) | (1,148 | ) | (1,148 | ) | 1,946 | 2,973 | (319 | ) | ||||||||||||
| Total remeasurement of contract receivables ($'000) | 7,983 | 4,246 | 2,548 | 3,882 | (2,693 | ) | ||||||||||||||
(1) Calculated on a weighted average basis
Financial position as at December 31, 2025, vs. December 31, 2024
The company's total assets increased by
Cash and cash equivalents and short-term deposits increased by
The company's investment in the Kamoa Holding joint venture increased by
| December 31, | December 31, | |||||
| 2025 | 2024 | |||||
| $'000 | $'000 | |||||
| Company's share of net assets in joint venture | 2,286,901 | 1,890,974 | ||||
| Loan advanced to joint venture | 1,283,689 | 1,142,742 | ||||
| Total investment in joint venture | 3,570,590 | 3,033,716 |
The company's share of the net assets in the Kamoa Holding joint venture can be broken down as follows:
| December 31, 2025 | December 31, 2024 | ||||||
| $'000 | $'000 | $'000 | $'000 | ||||
| Assets | |||||||
| Property, plant and equipment | 7,085,455 | 3,507,300 | 6,122,292 | 3,030,535 | |||
| Indirect taxes receivable | 1,141,769 | 565,176 | 651,915 | 322,698 | |||
| Current inventory | 759,207 | 375,807 | 564,685 | 279,519 | |||
| Mineral property | 744,371 | 368,464 | 763,217 | 377,792 | |||
| Long-term loan receivable | 428,363 | 212,040 | 374,485 | 185,370 | |||
| Other receivables | 364,097 | 180,228 | 371,077 | 183,683 | |||
| Trade receivables | 336,094 | 166,367 | 280,795 | 138,994 | |||
| Cash and cash equivalents | 310,590 | 153,742 | 100,641 | 49,817 | |||
| Run of mine stockpile | 104,790 | 51,871 | 318,688 | 157,751 | |||
| Income taxes receivable | 88,289 | 43,703 | - | - | |||
| Right-of-use asset | 39,834 | 19,718 | 51,764 | 25,623 | |||
| Deferred tax asset | 30,201 | 14,949 | 27,594 | 13,659 | |||
| Prepaid expenses | 18,484 | 9,150 | 17,377 | 8,602 | |||
| Non-current deposits | 3,127 | 1,548 | 1,872 | 927 | |||
| Liabilities | |||||||
| Shareholder loans | (2,593,586) | (1,283,825) | (2,308,984) | (1,142,947) | |||
| Term loan facilities | (1,069,004) | (529,157) | (668,508) | (330,911) | |||
| Advance payment facilities | (906,915) | (448,923) | (681,345) | (337,266) | |||
| Trade and other payables | (675,358) | (334,302) | (700,803) | (346,897) | |||
| Deferred tax liability | (369,851) | (183,076) | (323,546) | (160,155) | |||
| Overdraft facility | (276,430) | (136,833) | (232,475) | (115,075) | |||
| Rehabilitation provision | (132,004) | (65,342) | (123,668) | (61,216) | |||
| Dividends payable | (87,242) | (43,185) | - | - | |||
| Provisional payment facilities | (80,756) | (39,974) | (78,993) | (39,102) | |||
| Lease liability | (44,075) | (21,817) | (52,093) | (25,786) | |||
| Other provisions | (34,806) | (17,229) | (58,279) | (28,848) | |||
| Income taxes payable | - | - | 9,227 | 4,567 | |||
| Non-controlling interest | (564,641) | (279,497) | (606,788) | (300,360) | |||
| Net assets of the joint venture | 4,620,003 | 2,286,901 | 3,820,147 | 1,890,974 | |||
Before commencing commercial production in July 2021, the Kamoa Holding joint venture principally used loans from its shareholders to develop the Kamoa-Kakula Copper Complex through investing in development costs and other property, plant, and equipment.
Advance payment facilities represent financing arrangements linked to Kamoa-Kakula's offtake agreements with its customers. Each customer has provided advance payment facilities which are repaid by offsetting amounts payable in terms of provisional invoices in accordance with the terms of each agreement. Kamoa-Kakula received
Overdraft facilities represent drawn unsecured financing facilities from DRC financial institutions at an attractive cost of capital, utilized to augment cash generated from operations for Kamoa-Kakula's continued expansion and working capital. Total current overdraft facilities amount to
The term loan facilities of the Kamoa Holding joint venture can be summarized as follows:
| Description | Repayment terms | December 31, | December 31, |
| 2025 | 2024 | ||
| $'000 | $'000 | ||
| Syndicated term facility | Repayable in eight equal quarterly installments starting from March 31, 2026 | 398,868 | 403,568 |
| Standard Bank facility agreement | Full repayment on July 2026 with extension option. | 198,870 | 199,911 |
| Equipment financing facilities | Installments on each quarterly facility repayment date | 34,951 | 65,029 |
| Bank of Africa facility | Repayable in monthly installments | 15,623 | - |
| United Bank for Africa loan facility | Interest is paid bi-annually & the principal is repaid on maturity. | 50,472 | - |
| Offshore Term facility | Interest is paid quarterly & four (4) quarterly payments of the principal amount starting on 31 December 2026 and eight ( | 370,221 | - |
| Total term loan facilities | 1,069,004 | 668,508 |
The repayments of the advanced payment facilities of the Kamoa Holding joint venture can be summarized as follows:
| 0-3 months | 3-6 months | 6-12 months | 12-24 months | More than 24 months | |
| $'000 | $'000 | $'000 | $'000 | $'000 | |
| As at December 31, 2025 | 25,962 | 28,571 | 57,143 | 495,238 | 300,000 |
Kamoa Copper concluded working capital and overdraft facilities with Ecobank and United Bank for Africa for
The cash flows of the Kamoa Holding joint venture can be summarized as follows:
| Year ended | ||||||
| December 31, | ||||||
| 2025 | 2024 | |||||
| $ | '000 | $ | '000 | |||
| Net cash generated from operating activities before change in working capital items | 935,049 | 1,209,337 | ||||
| Change in working capital items | (505,417 | ) | (313,475 | ) | ||
| Net cash used in investing activities | (1,249,548 | ) | (1,941,722 | ) | ||
| Net cash generated from financing activities | 986,782 | 1,023,673 | ||||
| Effect of foreign exchange rates on cash | (872 | ) | (4,358 | ) | ||
| Net cash inflow (outflow) | 165,994 | (26,545 | ) | |||
| Cash and cash equivalents - beginning of the year | (131,834 | ) | (105,289 | ) | ||
| Cash and cash equivalents - end of the period | 34,160 | (131,834 | ) | |||
(1) Cash and cash equivalents in the above table are shown net of overdraft facilities.
The Kamoa Holding joint venture's net increase in property, plant and equipment from December 31, 2024, to December 31, 2025, amounted to
| Three months ended | Year ended | |||||||||||||
| December 31, | December 31, | |||||||||||||
| 2025 | 2024 | 2025 | 2024 | |||||||||||
| $'000 | $'000 | $'000 | $'000 | |||||||||||
| Kamoa Holding joint venture | ||||||||||||||
| Expansion capital | 236,248 | 225,400 | 866,688 | 1,622,923 | ||||||||||
| Sustaining capital | 96,473 | 96,327 | 376,328 | 315,872 | ||||||||||
| 332,721 | 321,727 | 1,243,016 | 1,938,795 | |||||||||||
| Depreciation capitalized | 16,131 | 20,131 | 60,917 | 60,105 | ||||||||||
| Total capital expenditure | 348,852 | 341,858 | 1,303,933 | 1,998,900 | ||||||||||
| Borrowing costs capitalized | 102,471 | 82,510 | 273,881 | 309,601 | ||||||||||
| Total additions to property, plant, and equipment for Kamoa Holding | 451,323 | 424,368 | 1,577,814 | 2,308,501 | ||||||||||
| Less depreciation, impairment, disposals, and foreign exchange translation | (135,552 | ) | (120,717 | ) | (614,651 | ) | (381,425 | ) | ||||||
| Net increase in property, plant, and equipment of Kamoa Holding | 315,771 | 303,651 | 963,163 | 1,927,076 | ||||||||||
Ivanhoe Mines' property, plant, and equipment increased by
The main components of the additions to property, plant and equipment - including capitalized development costs - at the Platreef Mine and the Kipushi Mine for the year and the three months ended December 31, 2025, and for the same periods in 2024, are set out in the following tables:
| Three months ended | Year ended | |||||||||||||||||
| December 31, | December 31, | |||||||||||||||||
| 2025 | 2024 | 2025 | 2024 | |||||||||||||||
| $'000 | $'000 | $'000 | $'000 | |||||||||||||||
| Platreef Mine | ||||||||||||||||||
| Phase 2 construction | 19,510 | 41,438 | 97,169 | 137,543 | ||||||||||||||
| Site costs | 16,035 | 1,650 | 54,280 | 5,381 | ||||||||||||||
| Salaries and benefits | 14,658 | 12,331 | 42,395 | 29,366 | ||||||||||||||
| Administrative and other expenditure | 6,568 | 5,855 | 18,299 | 14,163 | ||||||||||||||
| Phase 1 construction | 1,382 | 4,418 | 11,179 | 54,146 | ||||||||||||||
| Depreciation | 3,007 | 2,477 | 10,805 | 8,791 | ||||||||||||||
| Studies and contracting work | 3,491 | 540 | 8,726 | 3,211 | ||||||||||||||
| Social and environmental | 1,092 | 1,062 | 3,899 | 3,610 | ||||||||||||||
| Total development costs | 65,743 | 69,771 | 246,752 | 256,211 | ||||||||||||||
| Other additions to property, plant and equipment | 15,700 | 11,065 | 16,667 | 19,438 | ||||||||||||||
| Total additions to property, plant and equipment for Platreef | 81,443 | 80,836 | 263,419 | 275,649 | ||||||||||||||
| Three months ended | Year ended | |||||||||||||
| December 31, | December 31, | |||||||||||||
| 2025 | 2024 | 2025 | 2024 | |||||||||||
| $'000 | $'000 | $'000 | $'000 | |||||||||||
| Kipushi Mine | ||||||||||||||
| Sustaining capital | 12,627 | - | 50,633 | - | ||||||||||
| Initial and expansion capital | 10,368 | 7,611 | 35,108 | 192,618 | ||||||||||
| 22,995 | 7,611 | 85,741 | 192,618 | |||||||||||
| Depreciation capitalized | - | - | - | 4,530 | ||||||||||
| Total capital expenditure | 22,995 | 7,611 | 85,741 | 197,148 | ||||||||||
| Total additions to property, plant and equipment for Kipushi | 22,995 | 7,611 | 85,741 | 197,148 | ||||||||||
The company's total liabilities increased by
On January 23, 2025, the company issued debt securities with an aggregate principal of
Transaction costs of
Borrowings increased by
SELECTED QUARTERLY FINANCIAL INFORMATION
The following table summarizes selected financial information for the prior eight quarters. Ivanhoe had no operating revenue in any financial reporting period and did not declare or pay any dividend or distribution in any financial reporting period.
| Three months ended | ||||||||||||
| December 31, | September 30, | June 30, | March 31, | |||||||||
| 2025 | 2025 | 2025 | 2025 | |||||||||
| $'000 | $'000 | $'000 | $'000 | |||||||||
| Revenue | 138,435 | 129,403 | 96,757 | 77,020 | ||||||||
| Cost of sales | (120,518 | ) | (122,151 | ) | (100,217 | ) | (81,771 | ) | ||||
| Share of profit from joint venture | 45,647 | 11,305 | 15,704 | 107,948 | ||||||||
| Finance income | 45,099 | 43,855 | 43,583 | 41,623 | ||||||||
| Deferred tax (expense) recovery | (32,995 | ) | 3,169 | 7,842 | 4,374 | |||||||
| Finance costs | (9,314 | ) | (20,920 | ) | (4,947 | ) | (7,838 | ) | ||||
| General administrative expenditure | 4,518 | (2,068 | ) | (10,378 | ) | (9,957 | ) | |||||
| Exploration and project evaluation expenditure | (19,722 | ) | (10,324 | ) | (8,585 | ) | (9,145 | ) | ||||
| Share-based payments | (5,324 | ) | (6,194 | ) | (4,447 | ) | (2,418 | ) | ||||
| Profit (loss) attributable to: | ||||||||||||
| Owners of the Company | 54,687 | 33,057 | 44,051 | 129,760 | ||||||||
| Non-controlling interests | (14,774 | ) | (2,505 | ) | (8,726 | ) | (7,560 | ) | ||||
| Total comprehensive income (loss) attributable to: | ||||||||||||
| Owners of the Company | 83,544 | 55,839 | 60,900 | 135,033 | ||||||||
| Non-controlling interest | (11,687 | ) | (3 | ) | (7,066 | ) | (7,161 | ) | ||||
| Basic profit (loss) per share | 0.04 | 0.02 | 0.03 | 0.10 | ||||||||
| Diluted profit (loss) per share | 0.04 | 0.02 | 0.03 | 0.10 | ||||||||
| Three months ended | ||||||||||||
| December 31, | September 30, | June 30, | March 31, | |||||||||
| 2024 | 2024 | 2024 | 2024 | |||||||||
| $'000 | $'000 | $'000 | $'000 | |||||||||
| Revenue | 40,818 | - | - | - | ||||||||
| Cost of sales | (51,563 | ) | - | - | - | |||||||
| Share of profit from joint venture | 73,620 | 83,507 | 89,616 | 45,165 | ||||||||
| Finance income | 56,041 | 60,164 | 62,873 | 62,457 | ||||||||
| Deferred tax recovery | 12,663 | 575 | 1,398 | 3,221 | ||||||||
| General administrative expenditure | (19,633 | ) | (10,573 | ) | (12,345 | ) | (14,001 | ) | ||||
| Exploration and project evaluation expenditure | (15,845 | ) | (12,813 | ) | (10,589 | ) | (8,901 | ) | ||||
| Finance costs | (6,849 | ) | (,471 | ) | (32,871 | ) | (8,944 | ) | ||||
| Share-based payments | (2,977 | ) | (7,504 | ) | (8,505 | ) | (8,933 | ) | ||||
| Loss on fair valuation of embedded derivative liability | - | (4,171 | ) | (20,727 | ) | (139,271 | ) | |||||
| Profit (loss) attributable to: | ||||||||||||
| Owners of the Company | 99,344 | 117,942 | 76,401 | (65,552 | ) | |||||||
| Non-controlling interests | (11,338 | ) | (9,760 | ) | (9,885 | ) | (3,858 | ) | ||||
| Total comprehensive income (loss) attributable to: | ||||||||||||
| Owners of the Company | 60,964 | 141,525 | 88,223 | (73,648 | ) | |||||||
| Non-controlling interest | (15,158 | ) | (7,469 | ) | (8,672 | ) | (4,728 | ) | ||||
| Basic profit (loss) per share | 0.07 | 0.09 | 0.06 | (0.05 | ) | |||||||
| Diluted profit (loss) per share | 0.07 | 0.09 | 0.06 | (0.05 | ) | |||||||
Review of the three months ended December 31, 2025 vs. December 31, 2024
The company recorded a profit for Q4 2025 of
The total comprehensive income for the three months ended December 31, 2025, included an exchange gain on translation of foreign operations of
Included in general and administrative expenditure for the three months ended December 31, 2025 is foreign exchange gains of
The Kipushi Mine produced 61,444 tonnes of zinc in concentrate during Q4 2025 compared to 32,323 tonnes for the same period in 2024. The company sold 47,365 tonnes of payable zinc produced by the Kipushi Mine in Q4 2025 realizing revenue of
The Kamoa-Kakula Copper Complex sold 78,469 tonnes of payable copper in Q4 2025 realizing revenue of
| Three months ended | ||||||
| December 31, | ||||||
| 2025 | 2024 | |||||
| $'000 | $'000 | |||||
| Company's share of profit from joint venture | 45,647 | 73,620 | ||||
| Interest on loan to joint venture | 36,035 | 53,667 | ||||
| Company's income recognized from joint venture | 81,682 | 127,287 | ||||
The company's share of profit from the Kamoa Holding joint venture was
| Three months ended | ||||||
| December 31, | ||||||
| 2025 | 2024 | |||||
| $'000 | $'000 | |||||
| Revenue from contract receivables | 782,691 | 895,758 | ||||
| Remeasurement of contract receivables | 83,353 | (52,428 | ) | |||
| Revenue | 866,044 | 843,330 | ||||
| Cost of sales | (657,264 | ) | (482,070 | ) | ||
| Gross profit | 208,780 | 361,260 | ||||
| General and administrative costs | (37,748 | ) | (68,299 | ) | ||
| Amortization of mineral property | (4,467 | ) | (4,862 | ) | ||
| Profit from operations | 166,565 | 288,099 | ||||
| Finance costs | (56,371 | ) | (72,569 | ) | ||
| Foreign exchange gain | 115,888 | 3,707 | ||||
| Finance income and other | 1,008 | 5,006 | ||||
| Reversal of impairment | 12,207 | - | ||||
| Profit before taxes | 239,297 | 224,243 | ||||
| Current tax expense | (93,991 | ) | (21,561 | ) | ||
| Deferred tax expense | (34,670 | ) | (13,507 | ) | ||
| Profit after taxes | 110,636 | 189,175 | ||||
| Non-controlling interest of Kamoa Holding | (18,420 | ) | (40,448 | ) | ||
| Total comprehensive income for the year | 92,216 | 148,727 | ||||
| Company's share of profit from joint venture ( | 45,647 | 73,620 | ||||
Kamoa-Kakula's operating data is summarized under the review of operations section.
The finance costs recognized in the Kamoa Holding joint venture can be broken down as follows:
| Three months ended | ||||||
| December 31, | ||||||
| 2025 | 2024 | |||||
| $'000 | $'000 | |||||
| Interest on shareholder loans | 72,763 | 105,295 | ||||
| Interest on provisional and advance payment facilities | 33,080 | 32,289 | ||||
| Interest on bank loans and overdraft facilities | 21,719 | 7,669 | ||||
| Interest on syndicated loans | 11,514 | - | ||||
| Lease liability unwinding | 1,653 | 1,841 | ||||
| Rehabilitation unwinding | 1,600 | 5,951 | ||||
| Interest on equipment financing facilities | 1,180 | 2,035 | ||||
| Interest capitalized as borrowing costs | (87,138 | ) | (82,511 | ) | ||
| 56,371 | 72,569 | |||||
Ivanhoe's exploration and project evaluation expenditure amounted to
Finance income for Q4 2025 amounted to
LIQUIDITY AND CAPITAL RESOURCES
The company had
The company's capital expenditure guidance can be summarized as follows:
| Capital Expenditure | 2025 Guidance | 2025 Actuals | 2026 Guidance | 2027 Guidance | |||
| ($' million) | ($' million) | ($' million) | ($' million) | ||||
| Kamoa-Kakula | |||||||
| Expansion capital(1) | 950 - 1,050 | 867 | 600 - 850 | 300 - 450 | |||
| Sustaining capital | 370 - 450 | 376 | 500 - 550 | 450 - 500 | |||
| 1,320 - 1,500 | 1,243 | 1,100 - 1,400 | 750 - 950 | ||||
| Platreef | |||||||
| Phase 1 initial capital | 70 | 46 | - | - | |||
| Phase 2 capital | 180 - 210 | 206 | 350 - 380 | 380 - 420 | |||
| 250 - 280 | 252 | 350 - 380 | 380 - 420 | ||||
| Kipushi | |||||||
| Initial and expansion capital | 30 | 35 | - | - | |||
| Sustaining capital | 50 | 51 | 60 | 35 | |||
| 80 | 86 | 60 | 35 | ||||
Figures in the above table are presented on a
(1) Expansion capital at Kamoa-Kakula for 2026/2027 can be attributed
The 2026 capital expenditure guidance for Kamoa-Kakula has been updated from
The Platreef Mine's capital expenditure guidance range for 2026 is kept unchanged, with the Phase 2 expansion proceeding as contemplated in the feasibility study completed in February 2025, which outlines an increase in the total processing capacity to approximately 4.1 Mtpa with a new 3.3-Mtpa Phase 2 concentrator module from Q4 2027.
Ivanhoe's exploration budget for 2025 has been set to approximately
PRO-RATA FINANCIAL RATIOS
The following pro-rata financial ratios have been calculated by aggregating the contributions of the company with the contributions from the Kamoa-Kakula joint venture, pro-rata to the Company's effective shareholding in the Kamoa-Kakula joint venture.
| (in millions of $, except ratios) | December 31, | December 31, | ||||
| 2025 | 2024 | |||||
| Pro-rata total debt | 2,099.5 | 1,016.3 | ||||
| Pro-rata cash | 909.7 | 163.5 | ||||
| Pro-rata net debt | 1,189.8 | 852.8 | ||||
| Pro-rata net debt to Adjusted EBITDA (1) | 2.06x | 1.36x |
(1) Pro-rata net debt to Adjusted EBITDA ratio is a non-GAAP financial measure. Pro-rata net debt to Adjusted EBITDA ratio is pro-rata net debt divided by Adjusted EBITDA for the twelve months ended at the reporting period, expressed as the number of times Adjusted EBITDA needs to be earned to repay the pro-rata net debt.
The company's pro-rata total debt is summarized as follows:
| December 31, | December 31, | |||||
| 2025 | 2024 | |||||
| $'millions | $'millions | |||||
| Consolidated indebtedness of the company: | ||||||
| Senior notes | 759.2 | - | ||||
| Senior debt facility | 96.4 | 63.4 | ||||
| Advance payment facilities | 121.0 | 120.0 | ||||
| Other borrowings | 199.0 | 175.0 | ||||
| 1,175.6 | 358.4 | |||||
| Pro-rata indebtedness of Kamoa Holding joint venture | ||||||
| Term loan facilities | 423.3 | 264.7 | ||||
| Advance payment facilities | 359.1 | 269.8 | ||||
| Provisional payment facilities | 32.0 | 31.3 | ||||
| Overdraft facilities | 109.5 | 92.1 | ||||
| 923.9 | 657.9 | |||||
| Pro-rata total debt | 2,099.5 | 1,016.3 |
The pro-rata cash and cash equivalents of the company are summarized as follows:
| December 31, | December 31, | |||||
| 2025 | 2024 | |||||
| $'millions | $'millions | |||||
| Consolidated cash and cash equivalents of the company | 784.5 | 117.3 | ||||
| Pro-rata cash and cash equivalents of Kamoa Holding joint venture | 125.2 | 46.2 | ||||
| Pro-rata cash and cash equivalents | 909.7 | 163.5 |
The pro-rata net debt of the company is summarized as follows:
| December 31, | December 31, | |||||
| 2025 | 2024 | |||||
| $'millions | $'millions | |||||
| Pro-rata total debt | 2,099.5 | 1,016.3 | ||||
| Pro-rata cash and cash equivalents | 909.7 | 163.5 | ||||
| Pro-rata net debt | 1,189.8 | 852.8 |
The Adjusted EBITDA of the company for the twelve months ended December 31, 2025 is summarized as follows:
| FY 2025 | Q4 2025 | Q3 2025 | Q2 2025 | Q1 2025 | ||||||||||||||||
| $'millions | $'millions | $'millions | $'millions | $'millions | ||||||||||||||||
| Profit after taxes | 228.0 | 39.9 | 30.6 | 35.3 | 122.2 | |||||||||||||||
| Finance income | (174.2 | ) | (45.1 | ) | (43.9 | ) | (43.6 | ) | (41.6 | ) | ||||||||||
| Current and deferred tax | 22.1 | 35.8 | (2.5 | ) | (7.2 | ) | (4.0 | ) | ||||||||||||
| Finance costs | 42.9 | 9.3 | 20.9 | 4.9 | 7.8 | |||||||||||||||
| Unrealized foreign exchange (gain) loss | (28.7 | ) | (23.4 | ) | (6.7 | ) | 0.7 | 0.7 | ||||||||||||
| Depreciation | 63.1 | 25.2 | 14.7 | 11.3 | 11.9 | |||||||||||||||
| Amortization of mineral property | 16.6 | 5.0 | 4.1 | 5.2 | 2.3 | |||||||||||||||
| EBITDA | 169.8 | 46.7 | 17.2 | 6.6 | 99.3 | |||||||||||||||
| Share of profit from joint venture net of tax | (180.5 | ) | (45.6 | ) | (11.3 | ) | (15.7 | ) | (107.9 | ) | ||||||||||
| Company's share of EBITDA from Kamoa-Kakula joint venture (1) | 568.5 | 129.5 | 76.3 | 127.8 | 234.9 | |||||||||||||||
| Non-cash share-based payments | 16.9 | 4.3 | 4.3 | 4.6 | 3.7 | |||||||||||||||
| Loss on fair valuation of derivative liability | 3.1 | 3.1 | - | - | - | |||||||||||||||
| Adjusted EBITDA | 577.8 | 138.0 | 86.5 | 123.3 | 230.0 | |||||||||||||||
(1) The company's attributable share of EBITDA from the Kamoa-Kakula joint venture is calculated using the Company's effective shareholding in Kamoa Copper SA (
SUMMARY OF DEBT FACILITIES
On January 23, 2025, the company issued debt securities with an aggregate principal of
On or after January 23, 2027, the company has the right to redeem all or part of the Senior Notes at the following redemption prices, expressed as a percentage of the principal amount, plus any unpaid accrued interest.
| Redemption price | |
| Period of 12 months from January 23, 2027 | |
| Period of 12 months from January 23, 2028 | |
| Period of 12 months from January 23, 2029 |
On August 12, 2025, Kipushi entered into an offtaker facility agreement with Mercuria Energy Trading SA (Mercuria). Mercuria made
On December 10, 2024, Kipushi entered into a
On October 25, 2024, Ivanhoe Marketing and RMB entered into a
During the second quarter of 2024, Kipushi entered into a
On December 22, 2023, Ivanplats entered into a common terms and senior secured facility agreement between, amongst others, Société Générale and Nedbank Limited (acting through its Nedbank Corporate and Investment Banking Division) (Nedbank) as lenders; Ivanplats as borrower; Ivanplats Holding S.À.R.L, ITC and Ivanhoe Mines SA (Pty) Ltd. as guarantors; Ivanhoe Mines as sponsor; and Nedbank Limited as global facility agent (as amended and amended and restated from time to time, the Platreef Senior Debt Financing Agreement). Under the Platreef Senior Debt Financing Agreement, the lenders thereunder make available to Ivanplats a senior secured facility in an aggregate principal amount of up to
On August 4, 2023, the company entered into an
The company has a mortgage bond outstanding on its offices in London, United Kingdom, of £3.2 million (
In 2013, the company became a party to a loan payable to ITC Platinum Development Limited, which had a carrying value and contractual value of
The company has an implied commitment in terms of spending on work programs submitted to regulatory bodies to maintain the good standing of exploration and exploitation permits at its mineral properties. The following table sets forth the company's long-term obligations:
| Contractual obligations as at December 31, 2025 | Payments Due By Period | ||||||||||||||||||
| Total | Less than 1 year | 1-3 years | 4-5 years | After 5 years | |||||||||||||||
| $'000 | $'000 | $'000 | $'000 | $'000 | |||||||||||||||
| Debt | 1,488,084 | 246,906 | 252,854 | 940,459 | 47,865 | ||||||||||||||
| Lease commitments | 867 | 461 | 406 | - | - | ||||||||||||||
| Total contractual obligations | 1,488,951 | 247,367 | 253,260 | 940,459 | 47,865 | ||||||||||||||
Debt in the above table represents the senior notes, the senior debt facility, the advance payment facilities, the RMB loan facilities, mortgage bond owing to Citibank, the loan payable to ITC Platinum Development Limited, the loan from FirstBank, the aircraft loan as described above.
NON-GAAP FINANCIAL PERFORMANCE MEASURES
Cash cost (C1) per pound is a non-GAAP financial measure. These are disclosed to enable investors to better understand the performance of Kamoa-Kakula and Kipushi in comparison to other copper and zinc producers respectively who present results on a similar basis.
Cash cost (C1) is prepared on a basis consistent with the industry standard definitions by Wood Mackenzie cost guidelines but is not measures recognized under IFRS Accounting Standards. In calculating the C1 cash cost for Kamoa-Kakula, the costs are measured on the same basis as the company's share of profit from the Kamoa Holding joint venture that is contained in the financial statements. C1 cash cost is used by management to evaluate operating performance and includes all direct mining, processing, and general and administrative costs. Smelter charges and freight deductions on sales to the final port of destination, which are recognized as a component of sales revenues, are added to C1 cash cost to arrive at an approximate cost of finished metal. C1 cash cost and C1 cash cost per pound exclude royalties, production taxes, and non-routine charges as they are not direct production costs.
Reconciliation of Kamoa-Kakula's cost of sales to C1 cash cost, including on a per pound basis:
| Three months ended | Year ended | |||||||
| December 31, | December 31, | |||||||
| 2025 | 2024 | 2025 | 2024 | |||||
| $'000 | $'000 | $'000 | $'000 | |||||
| Cost of sales | 657,264 | 482,070 | 2,188,951 | 1,497,758 | ||||
| Logistics, treatment and refining charges | 87,573 | 126,550 | 350,482 | 471,045 | ||||
| General and administrative expenditure | 47,722 | 86,886 | 178,963 | 182,886 | ||||
| Royalties and production taxes | (67,825) | (76,783) | (247,071) | (264,768) | ||||
| Depreciation | (172,142) | (117,574) | (531,138) | (328,234) | ||||
| Power rebate | (5,412) | (3,769) | (16,049) | (16,932) | ||||
| Non-cash adjustments to inventory | (63,035) | 37,582 | 24,075 | 58,795 | ||||
| Extraordinary taxes | (10,486) | (21,100) | (22,809) | (43,017) | ||||
| General and administrative expenditures of other group entities | (9,457) | (10,601) | (21,147) | (13,494) | ||||
| Costs classified as abnormal due to seismic activity | (5,053) | - | (104,650) | - | ||||
| C1 cash costs | 459,149 | 503,261 | 1,799,607 | 1,544,039 | ||||
| Cost of sales per pound of payable copper sold ($ per lb.) | 3.80 | 1.94 | 2.82 | 1.71 | ||||
| C1 cash costs per pound of payable copper produced ($ per lb.) | 2.99 | 1.75 | 2.16 | 1.65 | ||||
| Payable copper produced in concentrate (tonnes) | 69,408 | 130,275 | 377,693 | 425,746 | ||||
Figures in the above table are for the Kamoa-Kakula joint venture on a
Reconciliation of Kipushi's cost of sales to C1 cash cost, including on a per-pound basis:
| Three months ended | Year ended | |||||||||||
| December 31, | December 31, | |||||||||||
| 2025 | 2024 | 2025 | 2024 | |||||||||
| $'000 | $'000 | $'000 | $'000 | |||||||||
| Cost of sales | 120,157 | 51,563 | 424,296 | 51,563 | ||||||||
| Logistics and treatment charges | 16,003 | 9,926 | 52,400 | 9,926 | ||||||||
| General and administrative expenditure | 673 | 384 | 1,481 | 384 | ||||||||
| Royalties and production taxes | (13,980 | ) | (2,104 | ) | (46,964 | ) | (2,104 | ) | ||||
| Depreciation and amortization | (29,502 | ) | (15,769 | ) | (77,067 | ) | (15,769 | ) | ||||
| General and administrative expenditures of other group entities | (2,087 | ) | (1,806 | ) | (5,341 | ) | (1,806 | ) | ||||
| C1 cash costs | 91,264 | 42,194 | 348,805 | 42,194 | ||||||||
| Cost of sales per pound of payable zinc sold ($ per lb.) | 1.13 | 1.38 | 1.12 | 1.38 | ||||||||
| C1 cash costs per pound of payable zinc sold ($ per lb.) | 0.86 | 1.13 | 0.92 | 1.13 | ||||||||
| Payable zinc sold in concentrate (tonnes) | 48,075 | 16,999 | 171,275 | 16,999 | ||||||||
EBITDA, Adjusted EBITDA and EBITDA margin, normalized profit after tax and normalized profit per share
EBITDA and Adjusted EBITDA are non-GAAP financial measures. Ivanhoe believes that Kamoa-Kakula's EBITDA and Kipushi's EBITDA are valuable indicators of each mine's respective ability to generate liquidity by producing operating cash flow to fund their working capital needs, service debt obligations, fund capital expenditures, and distribute cash to its shareholders. EBITDA and Adjusted EBITDA are also frequently used by investors and analysts for valuation purposes. Kamoa-Kakula's EBITDA, Kipushi's EBITDA, and the EBITDA and Adjusted EBITDA for the company are intended to provide additional information to investors and analysts and do not have any standardized definition under IFRS Accounting Standards and should not be considered in isolation or as a substitute for measures of performance prepared per IFRS Accounting Standards. EBITDA and Adjusted EBITDA exclude the impact of cash cost of financing activities and taxes, and the effects of changes in operating working capital balances and impairments, and therefore are not necessarily indicative of operating profit or cash flow from operations as determined under IFRS Accounting Standards. Other companies may calculate EBITDA and Adjusted EBITDA differently.
The EBITDA margin is an indicator of Kamoa-Kakula's and Kipushi's respective overall health and denotes their respective profitability, which is calculated by dividing EBITDA by revenue. The EBITDA margin is intended to provide additional information to investors and analysts, does not have any standardized definition under IFRS Accounting Standards, and should not be considered in isolation or as a substitute, for measures of performance prepared per IFRS Accounting Standards.
Reconciliation of profit after tax to Kamoa-Kakula's EBITDA:
| Three months ended | Year ended | |||||||||||
| December 31, | December 31, | |||||||||||
| 2025 | 2024 | 2025 | 2024 | |||||||||
| $'000 | $'000 | $'000 | $'000 | |||||||||
| Profit after taxes | 110,636 | 189,175 | 439,785 | 776,911 | ||||||||
| Depreciation | 176,609 | 122,436 | 549,984 | 343,439 | ||||||||
| Finance costs | 56,371 | 72,569 | 279,381 | 301,243 | ||||||||
| Other taxes | 10,486 | 21,100 | 22,809 | 43,017 | ||||||||
| Current and deferred tax expense | 128,661 | 35,068 | 317,731 | 345,534 | ||||||||
| Finance income | (5,845 | ) | (5,805) | (23,222 | ) | (16,580 | ) | |||||
| Unrealized foreign exchange (gain) loss | (133,590 | ) | (2,741) | (196,227 | ) | 20,123 | ||||||
| (Reversal of impairment) impairment | (12,207 | ) | - | 55,995 | - | |||||||
| EBITDA | 331,121 | 431,802 | 1,446,236 | 1,813,687 | ||||||||
(1) The impairment recognized for the year ended December 31, 2025 comprises of
Figures in the above table are for the Kamoa-Kakula joint venture on a
Reconciliation of loss after tax to Kipushi's EBITDA:
| Three months ended | Year ended | |||||||||||
| December 31, | December 31, | |||||||||||
| 2025 | 2024 | 2025 | 2024 | |||||||||
| $'000 | $'000 | $'000 | $'000 | |||||||||
| Segmented profit (loss) after taxes | 7,505 | (760) | 3,871 | (1,901 | ) | |||||||
| Depreciation and amortization | 29,503 | - | 77,068 | - | ||||||||
| Finance costs | 7,264 | - | 30,196 | - | ||||||||
| Current and deferred tax expense | 17,739 | - | 3,587 | 424 | ||||||||
| Finance income | (539 | ) | (553) | (2,340 | ) | (1,758 | ) | |||||
| Unrealized foreign exchange (gain) loss | (17,261 | ) | 333 | (21,694 | ) | 1,747 | ||||||
| EBITDA | 44,211 | (980) | 90,688 | (1,488 | ) | |||||||
Reconciliation of profit after tax to Ivanhoe's EBITDA and adjusted EBITDA:
| Three months ended | Year ended | |||||||||||
| December 31, | December 31, | |||||||||||
| 2025 | 2024 | 2025 | 2024 | |||||||||
| $'000 | $'000 | $'000 | $'000 | |||||||||
| Profit after taxes | 39,913 | 88,006 | 227,990 | 193,294 | ||||||||
| Finance income | (45,099 | ) | (56,041) | (174,160 | ) | (241,535 | ) | |||||
| Current and deferred tax recovery | 35,802 | (12,443) | 22,131 | (14,176 | ) | |||||||
| Unrealized foreign exchange loss (gain) | (23,495 | ) | 2,840 | (28,834 | ) | 9,893 | ||||||
| Finance costs | 9,314 | 6,849 | 43,019 | 49,135 | ||||||||
| Depreciation | 25,239 | 11,452 | 63,160 | 13,908 | ||||||||
| Amortization of mineral property | 4,956 | 5,367 | 16,591 | 5,367 | ||||||||
| EBITDA | 46,630 | 46,030 | 169,897 | 15,886 | ||||||||
| Share of profit from joint venture net of tax | (45,647 | ) | (73,620) | (180,604 | ) | (291,908 | ) | |||||
| Company's share of EBITDA from Kamoa-Kakula joint venture(1) | 129,536 | 158,871 | 568,623 | 711,868 | ||||||||
| Loss on fair valuation of embedded derivative liability | - | - | - | 164,169 | ||||||||
| Loss on fair valuation of derivative liability | 3,125 | - | 3,125 | - | ||||||||
| Non-cash share-based payments | 4,307 | 4,306 | 16,860 | 24,869 | ||||||||
| Adjusted EBITDA | 137,951 | 135,587 | 577,901 | 624,884 | ||||||||
| Q4 2025 | Q3 2025 | Q2 2025 | Q1 2025 | ||||||||||||
| $'000 | $'000 | $'000 | $'000 | ||||||||||||
| Profit (loss) after taxes | 39,913 | 30,552 | 35,325 | 122,200 | |||||||||||
| Finance income | (45,099 | ) | (43,855 | ) | (43,583 | ) | (41,623 | ) | |||||||
| Current and deferred tax (recovery) expense | 35,802 | (2,489 | ) | (7,229 | ) | (3,953 | ) | ||||||||
| Finance costs | 9,314 | 20,920 | 4,947 | 7,838 | |||||||||||
| Unrealized foreign exchange loss (gain) | (23,495 | ) | (6,664 | ) | 661 | 664 | |||||||||
| Depreciation | 25,239 | 14,711 | 11,282 | 11,928 | |||||||||||
| Amortization of mineral property | 4,956 | 4,096 | 5,233 | 2,306 | |||||||||||
| EBITDA | 46,630 | 17,271 | 6,636 | 99,360 | |||||||||||
| Share of profit from joint venture net of tax | (45,647 | ) | (11,305 | ) | (15,704 | ) | (107,948 | ) | |||||||
| Company's share of EBITDA from Kamoa-Kakula joint venture(1) | 129,536 | 76,337 | 127,839 | 234,911 | |||||||||||
| Loss on fair valuation of derivative liability | 3,125 | - | - | - | |||||||||||
| Non-cash share-based payments | 4,307 | 4,333 | 4,553 | 3,667 | |||||||||||
| Adjusted EBITDA | 137,951 | 86,636 | 123,324 | 229,990 | |||||||||||
(1) The company's attributable share of adjusted EBITDA from the Kamoa-Kakula joint venture is calculated using the Company's effective shareholding in Kamoa Copper SA (
| Three months ended | Year ended | |||||||||||
| December 31, | December 31, | |||||||||||
| 2025 | 2024 | 2025 | 2024 | |||||||||
| $'000 | $'000 | $'000 | $'000 | |||||||||
| Profit after taxes | 39,913 | 88,006 | 227,990 | 193,294 | ||||||||
| Finance costs on early redemption of convertible notes | - | - | - | 28,076 | ||||||||
| Loss on fair valuation of embedded derivative liability | - | - | - | 164,169 | ||||||||
| Normalized profit after taxes | 39,913 | 88,006 | 227,990 | 385,539 | ||||||||
| Three months ended | Year ended | |||||||||||||
| December 31, | December 31, | |||||||||||||
| 2025 | 2024 | 2025 | 2024 | |||||||||||
| $'000 | $'000 | $'000 | $'000 | |||||||||||
| Profit attributable to the owners of the Company | 54,687 | 99,344 | 261,555 | 228,135 | ||||||||||
| Finance costs on early redemption of convertible notes | - | - | - | 28,076 | ||||||||||
| Loss on fair valuation of embedded derivative liability | - | - | - | 164,169 | ||||||||||
| Normalized profit attributable to owners of the Company | 54,687 | 99,344 | 261,555 | 420,380 | ||||||||||
| Weighted average number of basic shares outstanding | 1,421,508,269 | 1,351,181,822 | 1,370,620,168 | 1,313,389,735 | ||||||||||
| Basic profit per share | 0.04 | 0.07 | 0.19 | 0.17 | ||||||||||
| Normalized profit per share | 0.04 | 0.07 | 0.19 | 0.32 | ||||||||||
DISCLOSURE OF TECHNICAL INFORMATION
Disclosures of a scientific or technical nature at the Kamoa-Kakula Copper Complex, the Platreef Mine and the Kipushi Mine, in this press release have been reviewed and approved by Steve Amos, who is considered, by virtue of his education, experience, and professional association, a Qualified Person under the terms of NI 43-101. Mr. Amos is not considered independent under NI 43-101 as he is Ivanhoe Mines' Executive Vice President, Projects. Mr. Amos has verified the technical data disclosed in this press release.
Disclosures of a scientific or technical nature regarding the Western Forelands Exploration Project in this press release have been reviewed and approved by Tim Williams, who is considered, by virtue of his education, experience, and professional association, a Qualified Person under the terms of NI 43-101. Mr. Williams is not considered independent under NI 43-101 as he is the Vice President, Geosciences, at Ivanhoe Mines. Mr. Williams has verified the technical data regarding the Western Forelands Exploration Project disclosed in this press release.
Ivanhoe has prepared an independent, NI 43-101-compliant technical report for the Kamoa-Kakula Copper Complex, the Platreef Mine, and the Kipushi Mine, each of which is available on the company's website and under the company's SEDAR+ profile at www.sedarplus.ca
- Kamoa-Kakula Integrated Development Plan 2023 Technical Report, filed on March 16, 2023, prepared by OreWin Pty Ltd., China Nerin Engineering Co. Ltd., DRA Global, Epoch Resources, Golder Associates Africa, Metso Outotec Oyj, Paterson and Cooke, SRK Consulting Ltd., and The MSA Group.
- The Kipushi 2022 Feasibility Study, filed on March 4, 2022, prepared by OreWin Pty Ltd., MSA Group (Pty) Ltd., SRK Consulting (South Africa) (Pty) Ltd, and METC Engineering.
- The Platreef Integrated Development Plan 2025, filed on March 31, 2025, prepared by OreWin Pty Ltd., Mine Technical Services, SRK Consulting Inc., DRA Projects (Pty) Ltd, and Golder Associates Africa.
These technical reports include relevant information regarding the effective dates and the assumptions, parameters, and methods of the mineral resource estimates on the Platreef Mine, the Kipushi Mine, and the Kamoa-Kakula Copper Complex cited in this press release, as well as information regarding data verification, exploration procedures, and other matters relevant to the scientific and technical disclosure contained in this press release in respect of the Platreef Mine, Kipushi Mine, and Kamoa-Kakula Copper Complex.
Information contact
Follow Robert Friedland (@robert_ivanhoe) and Ivanhoe Mines (@IvanhoeMines_) on Twitter.
Investors
Tommy Horton +44 7866 913 207
Media
Tanya Todd +1 604 331 9834
Website: www.ivanhoemines.com
Forward-looking statements
Certain statements in this news release constitute "forward-looking statements" or "forward-looking information" within the meaning of applicable securities laws. Such statements and information involve known and unknown risks, uncertainties, and other factors that may cause the actual results, performance, or achievements of the company, its projects, or industry results, to be materially different from any future results, performance, or achievements expressed or implied by such forward-looking statements or information. Such statements can be identified using words such as "may", "would", "could", "will", "intend", "expect", "believe", "plan", "anticipate", "estimate", "scheduled", "forecast", "predict" and other similar terminology, or state that certain actions, events, or results "may", "could", "would", "might" or "will" be taken, occur or be achieved. These statements reflect the company's current expectations regarding future events, performance, and results and speak only as of the date of this release.
Such statements include, without limitation: (i) statements that 2026 copper sales from Kamoa-Kakula are expected to be approximately 30,000 tonnes higher than copper production as the on-site inventory of unsold copper concentrate is destocked now that the smelter is operational, predominantly during the first half of the year; (ii) statements regarding Kamoa-Kakula's cash cost (C1) guidance for 2026 and 2027; (iii) statements regarding Kipushi's 2026 cash cost (C1) guidance for 2026; (iv) statements that an updated life-of-mine plan for Kamoa-Kakula is on track for the end of March 2026, and that the plan will update reserve and resource estimates, based on updated mining methods and technical parameters implemented since the seismic event and subsequent recovery plan, and targets increasing mining rates to 17 million tonnes per year, to fully utilize Phase 1, 2 and 3 concentrator capacity, prior to a potential Phase 4 expansion; (v) statements that Project
Also, all of the results of the 4.1 Mtpa FS, the 10.7 Mtpa PEA, the Kamoa-Kakula 2023 IDP, the Platreef 2022 feasibility study, and the Kipushi 2022 feasibility study constitute forward-looking statements or information and include future estimates of internal rates of return, net present value, future production, estimates of cash cost, proposed mining plans and methods, mine life estimates, cash flow forecasts, metal recoveries, estimates of capital and operating costs and the size and timing of phased development of the projects.
Furthermore, concerning this specific forward-looking information concerning the operation and development of the Kamoa-Kakula Copper Complex, Platreef Project and Kipushi Mine, and the exploration of the Western Forelands Exploration Project, the Mokopane Feeder Exploration Project and the Chu-Sarya Basin Exploration JV, the company has based its assumptions and analysis on certain factors that are inherently uncertain. Uncertainties include: (i) the adequacy of infrastructure; (ii) geological characteristics; (iii) metallurgical characteristics of the mineralization; (iv) the ability to develop adequate processing capacity; (v) the price of copper, nickel, zinc, platinum, palladium, rhodium and gold; (vi) the availability of equipment and facilities necessary to complete development and exploration; (vii) the cost of consumables and mining and processing equipment; (viii) unforeseen technological and engineering problems; (ix) accidents or acts of sabotage or terrorism; (x) currency fluctuations; (xi) changes in regulations; (xii) the compliance by joint venture partners with terms of agreements; (xiii) the availability and productivity of skilled labour; (xiv) the regulation of the mining industry by various governmental agencies; (xv) the ability to raise sufficient capital to develop such projects; (xvi) changes in project scope or design; (xvii) recoveries, mining rates and grade; (xviii) political factors; (xviii) water inflow into the mine and its potential effect on mining operations; and (xix) the consistency and availability of electric power.
Forward-looking statements and information involve significant risks and uncertainties, should not be read as guarantees of future performance or results, and will not necessarily be accurate indicators of whether such results will be achieved. Many factors could cause actual results to differ materially from the results discussed in the forward-looking statements or information, including, however not limited to, the factors discussed above and under the "Risk Factors" heading in the company's MD&A for the fiscal year ended December 31, 2025, in the company's current annual information form, and elsewhere in this release, as well as unexpected changes in laws, rules or regulations, or their enforcement by applicable authorities; the failure of parties to contracts with the company to perform as agreed; social or labour unrest; changes in commodity prices; and the failure of exploration programs or studies to deliver anticipated results or results that would justify and support continued exploration, studies, development or operations.
Although the forward-looking statements contained in this release are based upon what management of the company believes are reasonable assumptions, the company cannot assure investors that actual results will be consistent with these forward-looking statements. These forward-looking statements are made as of the date of this release and are expressly qualified in their entirety by this cautionary statement. Subject to applicable securities laws, the company does not assume any obligation to update or revise the forward-looking statements contained herein to reflect events or circumstances occurring after the date of this release.
The company's actual results could differ materially from those anticipated in these forward-looking statements as a result of the factors outlined in the "Risk Factors" section in the company's MD&A for the fiscal year ended December 31, 2025, in the company's current annual information and elsewhere in this release.
![]()
To view the source version of this press release, please visit https://www.newsfilecorp.com/release/284365