
Koryx Copper Announces Pre-Feasibility Results for the Haib Copper Project, Southern Namibia
Sentiment and the balance of points
Rhea-AI Sentiment reads the wording of the document, how positive or negative its language is on a 1 to 5 scale. The balance of points shown with the takes weighs what the document actually discloses, so the two can disagree, for example when a trial that missed its main goal is described in upbeat language.
Rhea-AI Summary
Koryx Copper (KRYXF) announced a pre-feasibility study for its wholly owned Haib project in Namibia showing US$2.5 billion after-tax net present value. The valuation uses an 8% discount rate and assumes copper at US$5.00/lb, gold at US$3,500/oz and molybdenum at US$22/lb. The study estimates a 25% post-tax internal rate of return and 3.9-year post-tax payback.
The 24-year operation would require US$2.06 billion upfront capital and US$639 million sustaining capital. Average payable copper production is estimated at 130,000 tonnes annually in the first 10 years and 105,000 tonnes over the mine life. All-in sustaining costs are estimated at US$2.07/lb and US$2.52/lb, respectively. Koryx targets mining and environmental permits by mid-2027, early works by end-2027 and construction in the first quarter of 2028. A definitive feasibility study is expected to begin in early 2027 and take one year.
How this balance works
Rhea-AI gives every point it takes from this document a weight. Minor counts 1, Moderate 3 and Major 9, so one Major point outweighs several Minor ones. The bar adds up the weights on each side, and when neither side holds more than 65% of the total the balance reads Mixed.
It reads the document as published, with the same rules for every company, and it does not look at what the market expected or at how the stock traded, so a point can be objectively good on a day the stock falls.
Rhea-AI Sentiment measures something else, the tone of the wording.
Hollow bars mark forward-looking points. How the balance works
Positive
- Major point. Forward-looking: it has not happened yet and may not happen.Haib's pre-feasibility study estimates US$2.5 billion after-tax net present value at an 8% discount rate.
- Moderate pointProbable reserves contain 3 million tonnes of copper.
- Moderate pointMeasured, indicated and inferred resources contain 4.35 million tonnes of copper.
- Moderate point. Forward-looking: it has not happened yet and may not happen.Payable copper output averages 130,000 tonnes annually in the first 10 years; 105,000 tonnes over mine life.
- Moderate point. Forward-looking: it has not happened yet and may not happen.The proposed operation processes 48 million tonnes annually over a 24-year operating life.
- Moderate point. Forward-looking: it has not happened yet and may not happen.Koryx plans early works by end-2027 and construction commencement in the first quarter of 2028.
- Moderate point. Forward-looking: it has not happened yet and may not happen.Koryx expects a definitive feasibility study starting early 2027 to take one year.
5 minor points
- Minor point. Forward-looking: it has not happened yet and may not happen.Project returns are estimated at 25% post-tax, with a 3.9-year post-tax payback period.
- Minor point. Forward-looking: it has not happened yet and may not happen.Life-of-mine post-tax cash flow is estimated at US$7,425 million under the base case.
- Minor point. Forward-looking: it has not happened yet and may not happen.Payable gold output averages 15,000 ounces annually in the first 10 years; 12,000 ounces over mine life.
- Minor point. Forward-looking: it has not happened yet and may not happen.Payable molybdenum output averages 1.224 million pounds annually in the first 10 years; 1.134 million over mine life.
- Minor point. Forward-looking: it has not happened yet and may not happen.Planned solar and battery infrastructure supplies approximately 45% of life-of-mine energy.
Negative
- Major point. Forward-looking: it has not happened yet and may not happen.Upfront capital is estimated at US$2.06 billion, including US$133 million contingency and US$152 million capitalised pre-strip.
- Moderate point. Forward-looking: it has not happened yet and may not happen.Sustaining capital requires an estimated US$639 million over the mine life.
- Moderate point. Forward-looking: it has not happened yet and may not happen.Project economics remain at the pre-feasibility stage; Koryx plans further study and financing work.
- Moderate point. Forward-looking: it has not happened yet and may not happen.Mining and environmental approvals remain pending, with completion targeted by mid-2027.
- Moderate point. Forward-looking: it has not happened yet and may not happen.Orange River water supply requires 20 million cubic metres annually; permitting is underway under a signed NamWater memorandum.
5 minor points
- Minor point. Forward-looking: it has not happened yet and may not happen.Cash costs, net of by-products, average US$1.72/lb in the first 10 years and US$2.19/lb over mine life.
- Minor point. Forward-looking: it has not happened yet and may not happen.All-in sustaining costs average US$2.07/lb in the first 10 years and US$2.52/lb over mine life.
- Minor pointBase-case economics assume flat prices of US$5.00/lb copper, US$3,500/oz gold and US$22/lb molybdenum.
- Minor point. Forward-looking: it has not happened yet and may not happen.Closure costs of US$183 million are provisioned over mine life and assumed offset by salvage value.
- Minor pointGovernment charges include a 3% gross-revenue royalty and a 1% gross-revenue export levy.
AI-generated analysis. How Rhea-AI works. Not financial advice.


135,000 MT ANNUAL CU PRODUCTION (1ST 10 YEARS)
17,000 OZ ANNUAL AU PRODUCTION (1ST 10 YEARS)
1.22 MILLION LB ANNUAL PAYABLE MO (1ST 10 YEARS)
M&I&I RESOURCES OF 4.35 MILLION MT CONTAINED CU
PROBABLE RESERVES OF 3 MILLION MT OF CONTAINED CU
PFS Highlights
Post-tax NPV
8% of US$2.5bn (pre-tax US$4.2bn ) and post-tax IRR of25% (pre-tax31% ), at base-case price of US$5.00 /lb Cu, US$3,500 /oz Au, and US$22 /lb Mo145ktpa of gross annual CuEq production (average first 10 years) and 117ktpa (life-of-mine, ("LOM")), and 2.61 Mt total LOM copper in concentrate production
130ktpa of average annual payable copper production (average first 10 years) and 105ktpa (LOM)
US
$2.06bn upfront capital cost, incl. US$133m of project contingency and US$152m of capitalised pre-strip, with sustaining capital of US$639m over the LOM.Average annual payable Au production of 15,000 oz (first 10 years) and 12,000 oz per annum (LOM)
Average annual payable Mo production of 1.22 million lb (first 10 years) and 1.13 million lb (LOM)
C1 cash cost of US
$1.72 /lb (net of byproducts, first 10 years) and US$2.19 /lb (LOM)All-in sustaining cost (AISC) of US
$2.07 /lb (first 10 years) and US$2.52 /lb (LOM)Capital intensity of
$14,985 /mt of annual payable CuEq production (Years 1 - 10) and$18,584 /mt of annual payable CuEq production (LOM)Conventional open pit with staged pushbacks and trolley-assisted haulage, mined by contractor, with a life-of-mine strip ratio of 0.98:1
A conventional copper sulphide processing route using three-stage crushing (including HPGR), ball milling with coarse gangue rejection of
25% of ROM mill feed, followed by a common hybrid Jameson and Tank Cell flotation circuit configurationLOM production schedule of 48Mtpa crushing throughput for approximately 1.1bn tonnes over 24 years, prioritising higher-grade feed (approximately
0.32% Cu) in the early yearsLOM copper recovery of
87.3% (89.5% 1st 10 years) to a bulk concentrate grading21.8% Cu, with molybdenum and gold recovered as by-productsTailings Storage Facility selected from nine alternatives, with capacity of approx. 1.15 billion tonnes, located close to the processing plant to minimise pumping costs
220kV overhead powerline connection to NamPower's Harib substation combined with approximately 417MWp of on-site solar PV and 361MWh of battery storage, supplying approximately
45% of life-of-mine energyWater supply of 20Mm3 per annum from the Orange River incl. off-channel storage dam to manage seasonality. Permitting underway and signed NamWater MOU in place
All key permits (Mining License & Environmental Clearance Certificate) are targeted to be completed by mid 2027, paving the way for commencement of early works construction by end of 2027.
Definitive Feasibility Study to support project financing and a construction decision to begin in early 2027 and expected to take one year to complete
Live, online webinar conference call to discuss PFS results:
Date: Wednesday, November 18th, 2026
Time: 10:00am EST, 17:00 Namibia time
Webcast Registration Link: https://bit.ly/4zJJw3z
Koryx Site Visit & Investor Day to be held on site on 4/5 February 2027. Contact Management for Details.
Luxembourg, Luxembourg--(Newsfile Corp. - November 17, 2026) - Koryx Copper S.A. (TSXV: KRY) (NSX: KYX) (OTCQX: KRYXF) ("Koryx" or the "Company") is pleased to announce the results of the Pre-Feasibility Study ("PFS") for the wholly-owned Haib Copper Project ("Haib" or the "Project") in southern Namibia.
Haib is a massive, disseminated porphyry copper ("Cu") deposit with associated molybdenum ("Mo") and gold ("Au") and is planned as a large-scale open pit mining and conventional sulphide milling and flotation, producing separate Cu and Mo concentrates.
Heye Daun, Koryx President & CEO commented: "We are very pleased with the excellent results of this PFS, which have far exceeded our initial expectations. With a total mineral resource of 4.35mt of contained copper (plus significant by-product credits) and an average annual gross CuEq production rate of 145ktpa (first 10 years), this PFS undoubtedly benchmarks Haib as a truly world-class copper development project in a premium jurisdiction, Namibia.
I am very proud of our dedicated and highly professional Koryx team, with assistance from various excellent Namibian and Southern African professional service providers, especially DRA Global Limited, Knight Piésold and Qubeka Mining Consultants, who together delivered the Haib Cu/Mo/Au project as a tier 1 copper development project of global stature.
Major project improvements comprise (i) the completion of a bigger and significantly higher-grade mineral resource and maiden ore reserve (ii) process simplification via the abandonment of the heap leach facility and associated production, (iii) the use of coarse particle flotation and Jameson Cell technology in flotation and (iv) extensive flow sheet optimization which has materially improved the Haib project across all metrics compared with the Preliminary Economic Assessment ("PEA") completed in September 2025.
The next twelve (12) months will be focused on (i) the completion of the Definitive Feasibility Study ("DFS"), (ii) raising finance, (iii) finishing permitting in preparation for early works commencement late in 2027 and construction commencement in 1Q 2028."
Property Description and Ownership
Haib is a porphyry copper exploration project located in the Karas Region of southern Namibia approximately six kilometres north of the border with South Africa and between 12km and 15km east of the tarred B1 highway that connects Namibia with South Africa. Koryx has a
Results of PFS Financial Evaluation
Mining is expected to run for 15 years after a pre-strip period and feed the processing plant, which has been sized in the PFS base case for a capacity of 48 million tonnes per annum ("Mtpa") of run of mine ("ROM") material for 24 years including 9 years to process reclaimed low-grade stockpiles from Year 16 to Year 24.
A PFS financial model was developed from the updated studies with the following techno-economic results.
| Table 1: PFS Financial Valuation Results | |||||
| US | US | ||||
| Units | Pre-Tax | Post-Tax | Pre-Tax | Post-Tax | |
| NPV | US$m | 4,205 | 2,538 | 6,335 | 3,875 |
| IRR | % | ||||
| Payback Period | Years | 3.9 | 3.9 | 3.3 | 3.5 |
| LOM Cashflow | US$m | 11,711 | 7,425 | 16,435 | 10,378 |
| Upfront Capex 1 | US$m | 2,059 | |||
| Sustaining Capex 2 | US$m | 639 | |||
| Years 1 - 10 | LOM | ||||
| Ave Annual Cu Production | 135 | 109 | |||
| C1 Cash Costs 3 | US$/lb | 1.72 | 2.19 | ||
| AISC Costs 4 | US$/lb | 2.07 | 2.52 | ||
| Capital Intensity payable CuEq | US$/tpa | 14,985 | 18,584 | ||
| Table 2: Key Assumptions | |||||
| Item | Units | Years 1 - 10 | Life-of-Mine | ||
| Life of Mine | Years | 24 | |||
| Copper Price (base case) | US$/t | 11,023 | |||
| Copper Recovery (Milling & flotation) | % | ||||
| Government Royalty (tax-deductible) | % | ||||
| Export Levy | % |
| Description | Units | PFS Base Case | ||
| RoM Throughput | Mtpa | 48 | ||
| Milling Circuit | Type | HPGR-Ball Mill | ||
| Primary Grind | Micron | 150 | ||
| 48Mtpa CPF | Duty | CGR | ||
| CGR Nominal Mass Reject | % RoM | 25 | ||
| Flotation Throughput | Mtpa | 36 | ||
| Flotation Circuit | Type | Jameson Cells / Tank Cells | ||
| Tailings | % Solids |
| Table 3: LOM Production Parameters | |||
| Item | Unit | Years 1 - 10 | Life-of-Mine |
| Ore Tonnes Mined | Mt | 779 | 1,119 |
| Waste Tonnes Mined | Mt | 853 | 1,093 |
| Strip Ratio | x | 1.10 | 0.98 |
| ROM Ore Mining Head Grade | % Cu | ||
| Flotation Processing Feed Grade | % Cu | ||
| Ore Mo Grade Mined | % Mo | ||
| Ore Au Grade Mined | g/t Au | 0.019 | 0.021 |
| Contained Cu Metal | kt | 1,999 | 2,835 |
| Concentrate grade | % Cu | ||
| Cu in concentrate | kt | 1,349 | 2,607 |
| Annual Cu Production | kt | 135 | 109 |
| Annual Mo Production | Mlb | 2.449 | 2.269 |
| Annual Au Production | koz | 17 | 13 |
| Annual Cu Production (Payable) | ktpa | 130 | 105 |
| Annual Mo Production (Payable) | Mlbpa | 1.224 | 1.134 |
| Annual Au Production (Payable) | kozpa | 15 | 12 |
| Annual CuEq Production (Payable) | ktpa | 137 | 111 |
Capital and Operating Cost Estimates
The capital cost estimate for the project was compiled by DRA, with inputs from Koryx and supporting specialist consultants Knight Piésold and Qubeka.
The estimate for the main crushing, milling and flotation plant for higher grade ("HG") mineralization was developed by DRA for a plant designed to process 48 Mtpa of ROM, with about 12 Mtpa of >150µm barren coarse particle flotation tailings being rejected ahead of conventional flotation of 36 Mtpa at a target grind of about
| Table 4: Capital Cost Estimates | |||
| Capital Costs | Units | Years 1 - 10 | Life-of-Mine |
| Process Plant incl. Construction Camp and Ops | US$m | 1,319 | |
| Concentrate Load Out | US$m | 11 | |
| Bulk Power Reticulation | US$m | 61 | |
| MSA and Trolley assist | US$m | 85 | |
| Owner's cost | US$m | 55 | |
| Tailings Storage Facility | US$m | 21 | |
| Surface Water Management | US$m | 0 | |
| Bulk Water Supply - Works | US$m | 80 | |
| Bulk Water Supply - Dam | US$m | 26 | |
| Construction Camp and Services | US$m | 8 | |
| Mine Housing | US$m | 27 | |
| Roads & Site Access | US$m | 2 | |
| Bulk Power Supply | US$m | 56 | |
| Site Infrastructure Indirect costs | US$m | 24 | |
| Subtotal Excluding Contingency | US$m | 1,774 | |
| Project Contingency | US$m | 133 | |
| Capitalised pre-strip | US$m | 152 | |
| Total Project Capital (incl. contingency) | US$m | 2,059 | |
| Sustaining Capital (LOM) 2 | US$m | 384 | 639 |
Knight Piésold developed the capital cost estimates for the Tailings Storage Facility ("TSF"), access roads, water and bulk power supply, stormwater management, housing and site accommodation. DRA and Qubeka prepared estimates for infrastructure directly associated respectively with the process plants and contract mining area.
Each consultant submitted estimates of engineering, project and construction management ("EPCM") services costs associated with their scope of work. This was supplemented by a detailed estimate by Koryx of Owner's costs during project implementation.
The cost estimate for pre-strip of waste rock before commencing production mining operations was an outcome of Qubeka's detailed mining schedules.
Significant portions of the TSF construction and other infrastructure costs will only be incurred during the life of the operation, hence these were recorded as sustaining capital in the table below, estimated by DRA and Knight Piésold. The TSF operational cost is included in the sustaining capital cost.
| Table 5: Unit Operating Costs | ||||
| Unit Costs per Tonne Mined/Processed | Units | Years 1 - 10 | Life-of-Mine | |
| Mining Cost (per tonne mined) | US$/t | 2.02 | 2.15 | |
| Variable Processing Cost (per t processed) | US$/t | 5.38 | 5.38 | |
| Fixed Processing Cost (G&A) | US$m | 24.23 | 24.23 | |
| Unit Costs per tonne Payable Cu Produced | Units | Years 1 - 10 | Life-of-Mine | |
| C1 Cash Costs 3, 7 | US$/t | 3,792 | 4,834 | |
| All-in Sustaining Costs 4, 7 | US$/t | 4,553 | 5,554 | |
| Unit Costs per lb Payable Cu Produced | Units | Years 1 - 10 | Life-of-Mine | |
| C1 Cash Costs 3, 7 | US$/lb | 1.72 | 2.19 | |
| All-in Sustaining Costs 4,7 | US$/lb | 2.07 | 2.52 | |
| Notes for Tables 1 to 5: | ||||
| ||||
| Table 6: Project Operating Costs (US$/t processed) | ||||||
| Concentrator Operating Cost | % Fixed | US$/t RoM | US$m/annum | |||
| Labour | 0.29 | 13.77 | ||||
| Power - Site Wide Fixed | 0.88 | 42.29 | ||||
| Power - Concentrator Variable | 1.80 | 86.45 | ||||
| Liners & Grinding Media | 1.13 | 54.03 | ||||
| Reagents | 0.55 | 26.51 | ||||
| Water | 0.00 | 0.00 | ||||
| Maintenance | 0.54 | 25.75 | ||||
| Laboratory Analysis | 0.04 | 1.77 | ||||
| Materials Handling | 0.16 | 7.45 | ||||
| Licensing & General | 0.004 | 0.20 | ||||
| Concentrator Operating Cost | 5.38 | 258.22 | ||||
| Concentrator Direct Operating Cost - Fixed | 1.33 | 63.98 | ||||
| Concentrator Direct Operating Cost - Variable | 4.05 | 194.23 | ||||
| Infrastructure & TSF Operating Cost | 11.29 | |||||
| Power - Site Wide Infrastructure (Excluding mining) | 0.19 | 9.29 | ||||
| Bulk Water - Maintenance Provision | 0.04 | 2.00 | ||||
| TSF OPEX | 0.00 | |||||
| Total Processing Infrastructure & TSF Operating Cost | 5.61 | 269.51 | ||||
| Total Processing Infrastructure & TSF Op. Cost - Fixed | 1.35 | 64.58 | ||||
| Total Processing Infrastructure & TSF Op. Cost - Variable | 4.27 | 204.93 | ||||
Table 7: LOM C1 Cash Cost and AISC Build-Up
| Component | US$/lb payable Cu |
| Mining | 0.86 |
| Processing | 1.08 |
| On-site G&A and General Site | 0.10 |
| Treatment, Refining, Freight and Marketing | 0.43 |
| By-Product Credits (Mo, Au) | (0.28) |
| C1 Cash Cost¹, 3 | 2.19 |
| Royalty and Export Levy | 0.21 |
| Sustaining Capital | 0.12 |
| AISC2, 3 | 2.52 |
Note:
- C1 = Mining, processing plus on-site G&A and selling costs less by-product credits
- AISC = C1 costs plus royalties & levies and sustaining capex (excluding closure costs & reclamation value)
- Non-IFRS financial ratio. See "Non-IFRS Financial Measures".
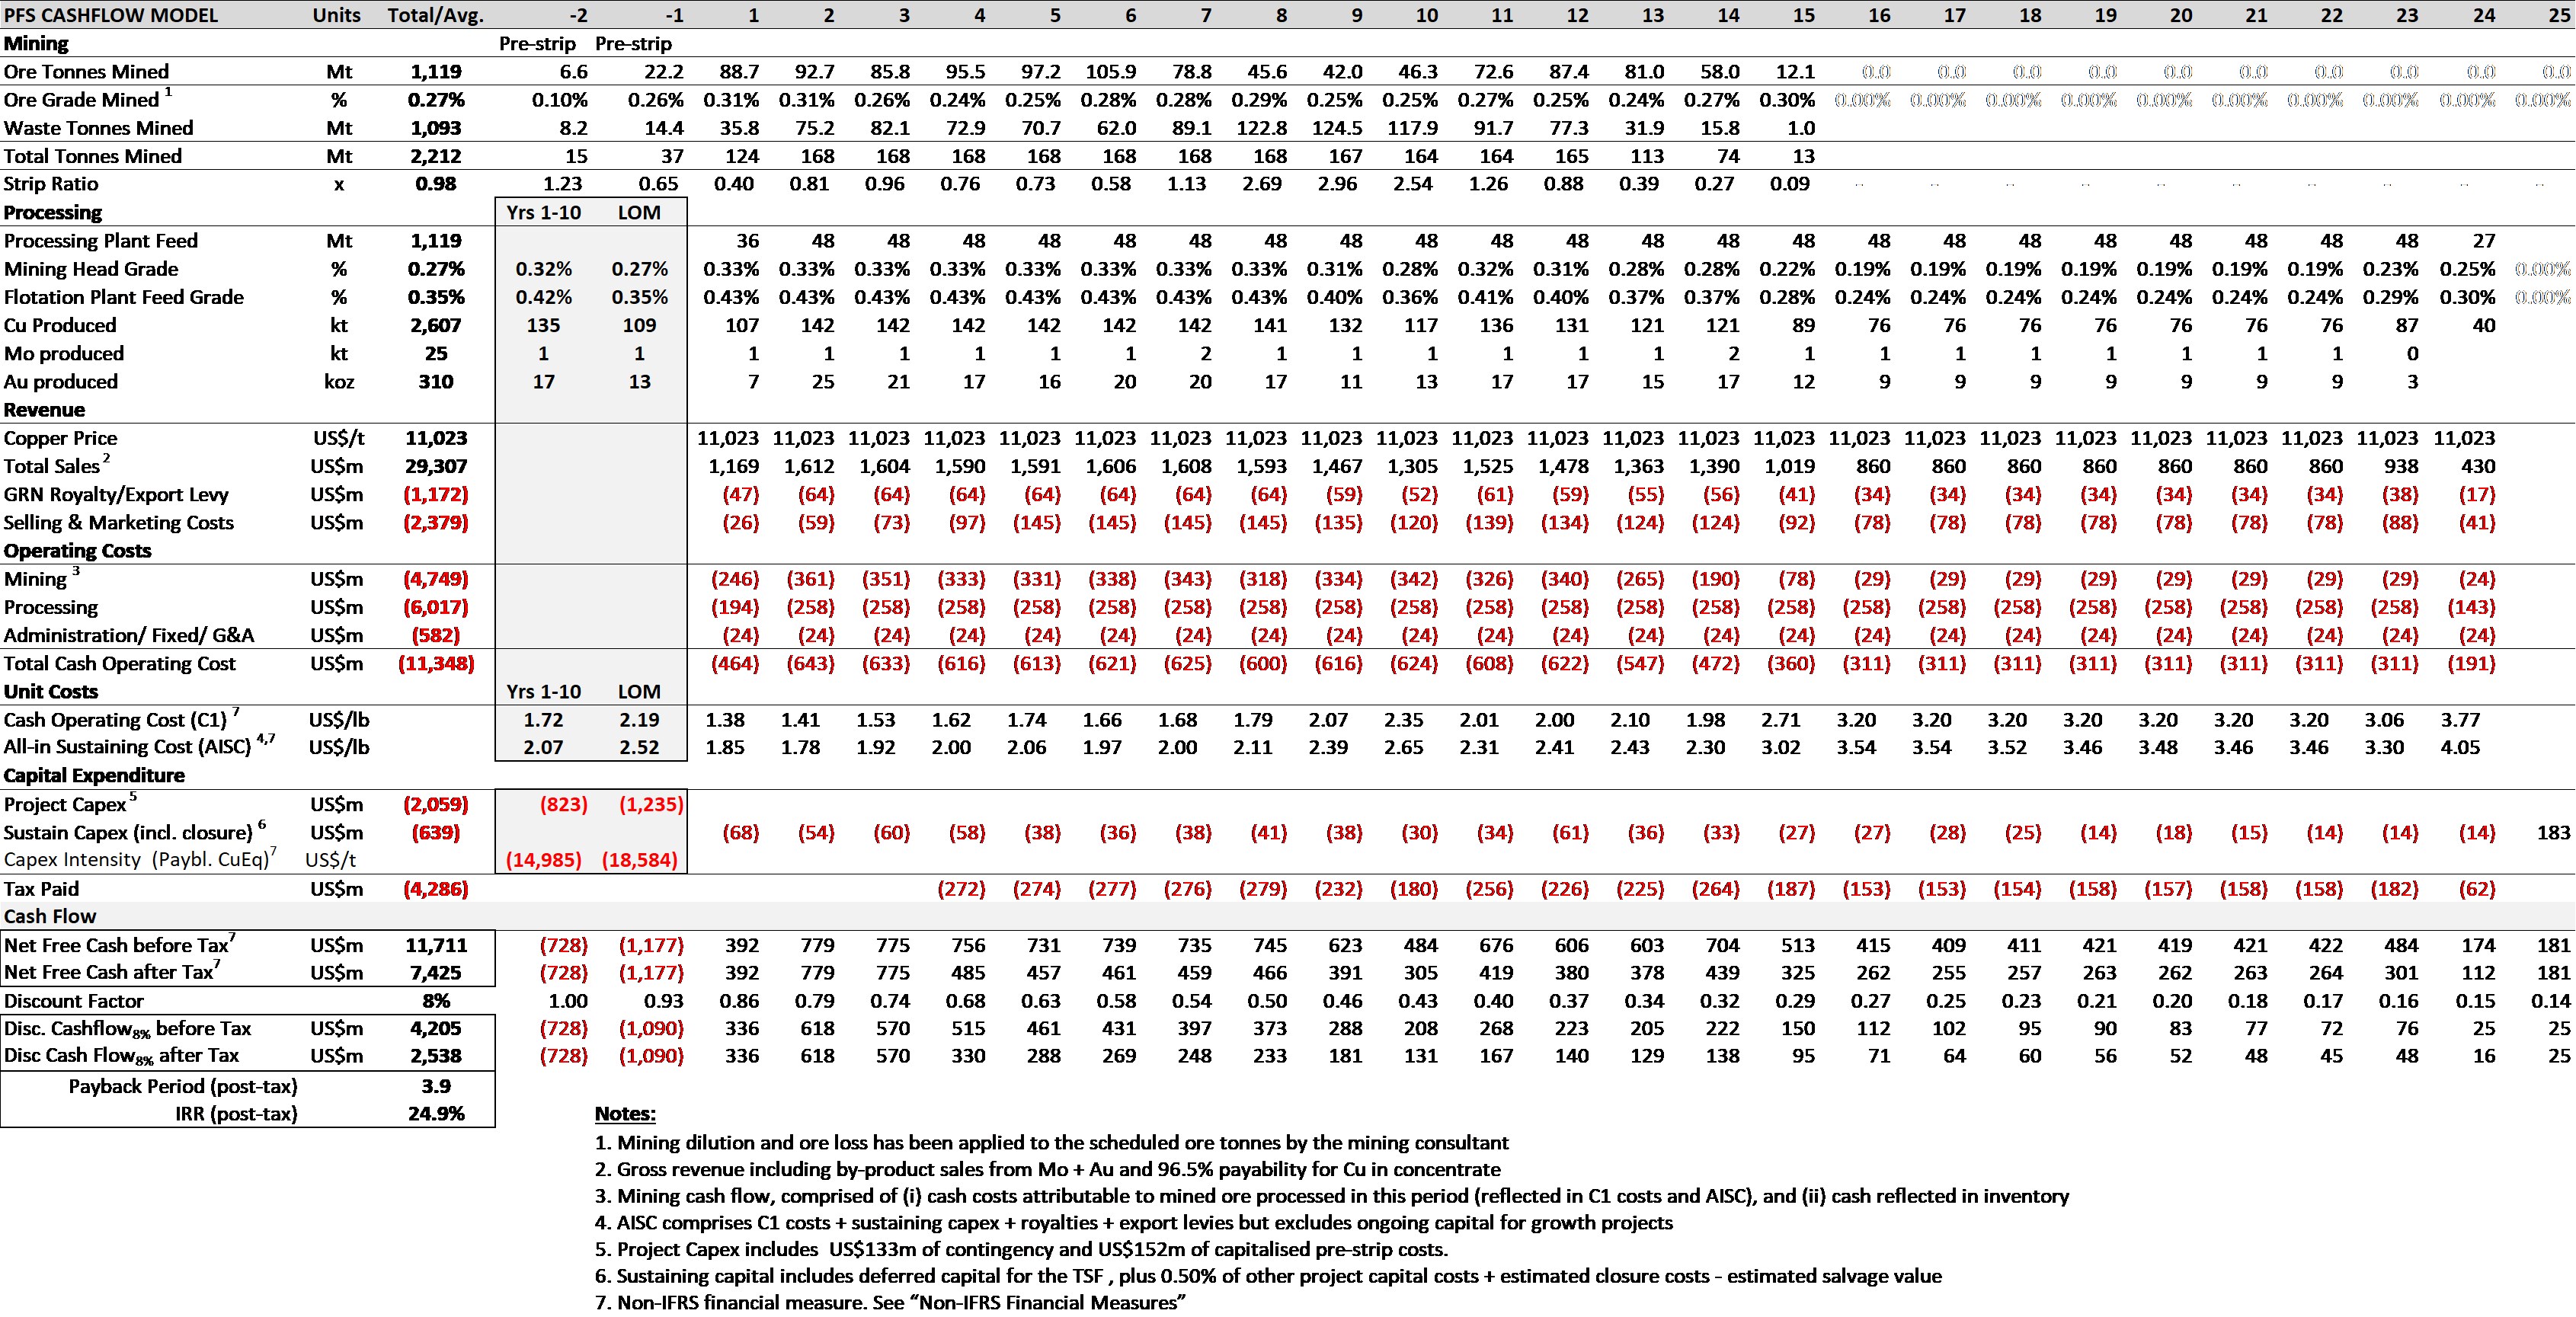
Table 8: Annual Cashflow Schedule
To view an enhanced version of this graphic, please visit:
https://images.newsfilecorp.com/files/10948/324393_c7272af404d189cd_002full.jpg
Key Economic Assumptions
The cash flow model is unlevered and on a
Table 9: Key Economic Assumptions
| Assumption | Value |
| Copper Price | US |
| Molybdenum Price | US |
| Gold Price | US |
| Silver | No silver revenue (not payable) |
| Payability | Cu |
| Treatment and Refining Charges | Year 1: -US |
| Trader's Margin | |
| Concentrate Freight (road, port, sea and last mile) | US |
| Government Royalty | |
| Export Levy | |
| Corporate Income Tax | |
| Capital Allowances | Capex redeemed against taxable income over 3 years; US |
| Exchange Rate | N$/ZAR18.00:US |
| Discount Rate | |
| Construction Period | 2 years ( |
| Processing | 48Mtpa ROM, with |
| Oxide Stockpile (final two years) |
Geology and Mineralization
Haib is a Paleoproterozoic approximately 1,880 Ma, porphyry copper-molybdenum-gold deposit hosted by volcanic rocks of the Orange River Group and granites and granodiorites of the Vioolsdrif Intrusive Suite, within the Richtersveld Subprovince of the Namaqua-Natal Province. Mineralization occurs in all host units, mainly in igneous-hydrothermal breccias, with narrow higher-grade zones in quartz-rich veins and shear zones and extends over approximately 2km of strike. Widespread potassic alteration and deeper sodic-calcic alteration indicate a deeply emplaced, multi-stage porphyry Cu-Mo system.
Chalcopyrite and pyrite are the principal sulphides, with minor molybdenite and occasional bornite, digenite, chalcocite and covellite. The best mineralization occurs as chalcopyrite aggregates and clots in igneous and hydrothermal breccias, while molybdenum occurs mainly in quartz-molybdenite veins. There is no well-developed supergene zone; near-surface oxide copper rarely extends below 30m.
Mineral Resource Estimate
MSA Group (Pty) Ltd ("MSA") has updated the previous Mineral Resource estimate for the Project, which had an effective date of 16 March 2026. Exploration continued through 2026 and new drilling has infilled the Mineral Resource and improved the geological understanding. The updated Mineral Resource Statement, effective 28 October 2026, is based on an updated model and a revised optimised pit shell.
The estimate uses diamond drillhole data from 1963 to 2026 and one 126 m channel-sampled adit. After extensive validation, data from Rio Tinto Zinc (120 drillholes, 1972-1975), Great Fitzroy Mines (12 drillholes, 1995-1999) and Teck (32 drillholes, 2010) were accepted. Twenty-nine drillholes from the King Resources and Falconbridge campaigns (1963-1969) were excluded from grade estimation because MSA could not validate them.
The database includes Koryx holes drilled from 2021 to September 2026: 231 NQ diamond drillholes ("DD") for 77,796 m and 19 reverse circulation ("RC") drillholes for 7,942 m. Exploration data available on 07 October 2026 were used to update the model.
Pre-Teck and pre-Koryx holes were mostly vertical on a grid of about 150 m. Teck and Koryx drilled angled holes, sometimes from the same location, to better intersect the dipping mineralization. Spacing averages about 75 m in the higher-confidence (Indicated) area, but the grid is irregular owing to targeted infill drilling and challenging topography (Figure 1).
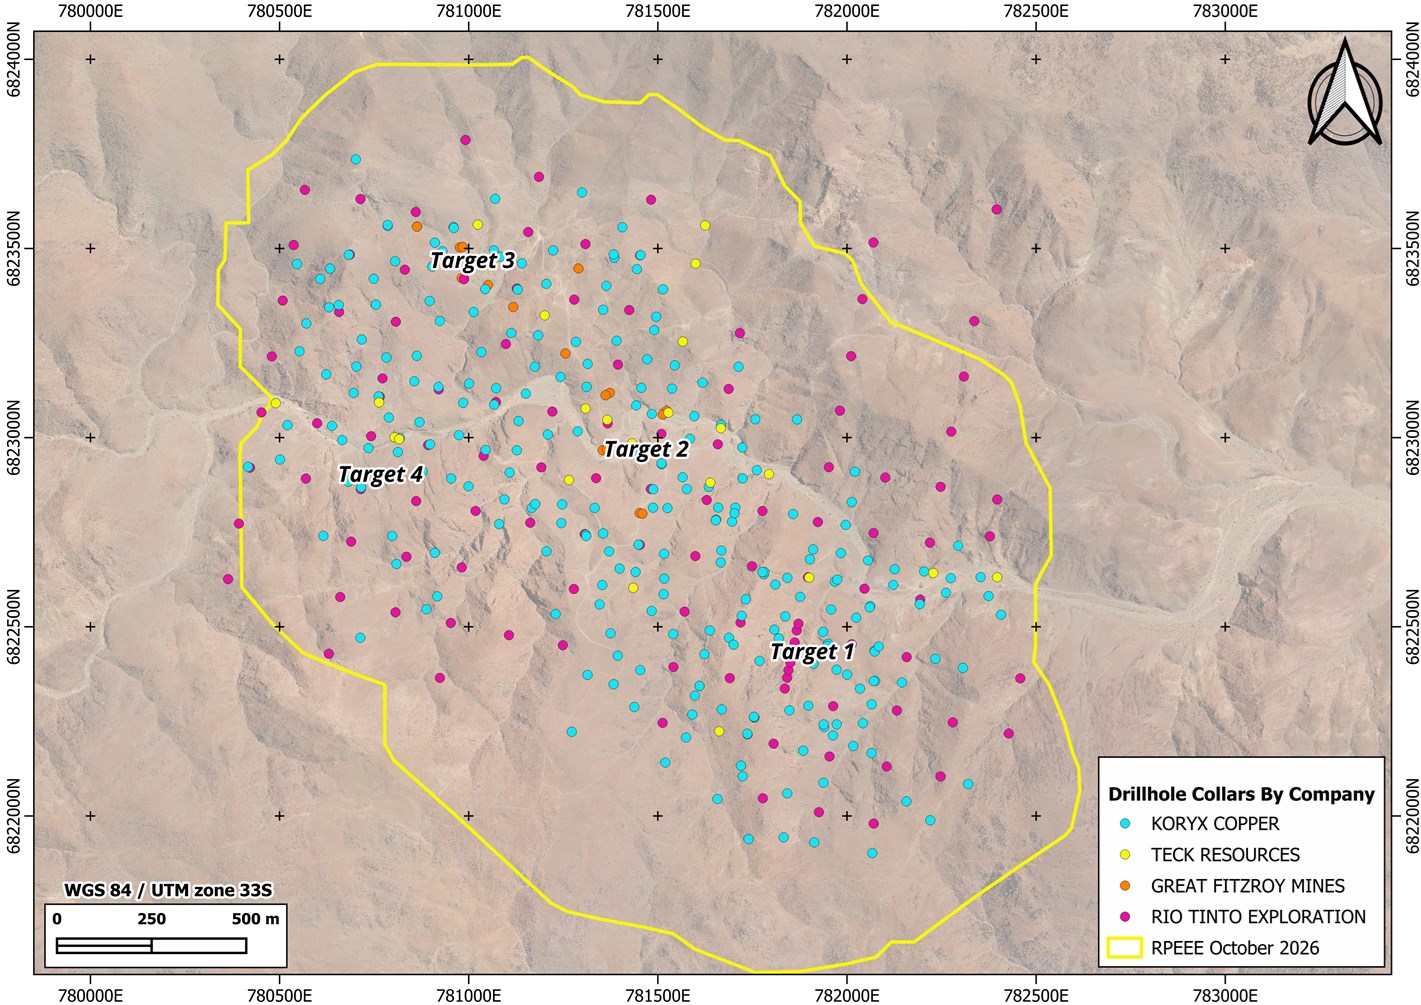
Figure 1: Plan view illustrating distribution of drilling by historical operators
To view an enhanced version of this graphic, please visit:
https://images.newsfilecorp.com/files/10948/324393_c7272af404d189cd_003full.jpg
A three-dimensional geological model of the copper mineralization was built from all drillhole sample data. Leapfrog Geo was used to create nested grade shells at copper thresholds of >
The model incorporates interpreted structural trends and geological domains. Copper grade was estimated from the accepted historical and Koryx data by ordinary kriging of five metre composites in Leapfrog Edge. An average in-situ dry bulk density of 2.78 t/m3 was assigned to all blocks. Classification considered data confidence, drillhole spacing and continuity.
Haib Mineral Resource Statement
The Mineral Resource was estimated using the Canadian Institute of Mining, Metallurgy and Petroleum ("CIM") Best Practice Guidelines and is reported in accordance with the 2014 CIM Definition Standards, which have been incorporated by reference into National Instrument 43-101 - Standards of Disclosure for Mineral Projects.
The Mineral Resource was reported from within an optimised pit shell. The Project envisages an open-pit mining operation with flotation of sulphide mineralization, including initial coarse particle flotation. Oxide material will be stockpiled and processed at end of life-of-mine by milling and flotation.
The optimised pit shell was informed by mineralization within the modelled
A summary of the Mineral Resource estimate is presented in Table 10 below.
Table 10: Mineral Resource Estimate for Haib as of 28 October 2026 at a
| Category | Type | Tonnes (Mt) | Cu Grade (%) | Mo Grade (ppm) | Au Grade (g/t) | CuEq Grade (%) | Cu Content (Mlb) | Mo Content (Mlb) | Cu Content (kt) | Mo Content (kt) | Au Content (koz) |
| Indicated | Total High Grade (> | 577 | 0.36 | 72 | 0.02 | 0.39 | 4,563 | 92 | 2,070 | 42 | 427 |
| Total Low Grade (0.15 | 793 | 0.19 | 49 | 0.02 | 0.21 | 3,312 | 86 | 1,502 | 39 | 465 | |
| Total | 1,371 | 0.26 | 59 | 0.02 | 0.28 | 7,875 | 178 | 3,572 | 81 | 892 | |
| Inferred | Total High Grade (> | 107 | 0.34 | 48 | 0.02 | 0.36 | 811 | 11 | 368 | 5 | 63 |
| Total Low Grade (0.15 | 222 | 0.19 | 37 | 0.02 | 0.20 | 912 | 18 | 414 | 8 | 115 | |
| Total | 329 | 0.24 | 41 | 0.02 | 0.26 | 1,723 | 30 | 781 | 13 | 178 |
Notes:
- All tabulated data have been rounded and as a result minor computational errors may occur.
- Mineral Resources, which are not Mineral Reserves, have no demonstrated economic viability as may be obtained once a pre-feasibility or feasibility studies have been completed and all modifying factors have been taken into account. There is no guarantee that all or any part of the Mineral Resource will be converted into a Mineral Reserve. The estimate of Mineral Resources may be materially affected by geology, environment, permitting, legal title, taxation, socio-political, marketing, or other relevant issues.
- Mt = Million tonnes, kt = thousand tonnes, Mlb = Million pounds.
- The Mineral Resource Statement for Haib as of 28 October 2026 is reported within a conceptual pit shell using the following assumed parameters:
Copper Price 10,469 USD/t. Molybdenum price 48,488 USD/t. Gold Price 4,000 USD/oz.
Royalty and Export Levy:4% , Copper payability:96.0% , Molybdenum payability76.4% , Gold payability81.0% .
Overall slope angle: 48° for Fresh, 45° for Oxide and Transitional.
Flotation recovery:88.2% Cu,40.6% Mo,54.0% Au.
Average Mining Cost 2.27 USD/tonne
Processing Cost 6.77 USD/tonne material processed by flotation,
SG&A Overheads 0.38 USD/tonne material to primary crusher. - The copper equivalent calculation uses the following formula for price contribution of each metal in one tonne relative to copper.
(Cu grade * Cu Price * Cu Recovery * Cu payability + Au grade * Au Price * Au Recovery * Au payability + Mo grade * Mo Price * Mo Recovery * Mo payability) / (Cu grade * Cu Price * Cu Recovery * Cu payability) * Cu grade,
Cu Price = USD 10,469/t, Mo Price = USD 48,488/t, Au Price = USD 4000/oz,
Cu Recovery =88.2% Mo Recovery =40.6% Au Recovery =54% ,
Cu Payability =96.0% , Mo Payability =76.4% Au Payability =81% ,
Recoveries are assumed from preliminary metallurgical test work for bulk concentrate production with initial coarse particle flotation. Oxide material is planned to be stockpiled and processed at the end of life-of-mine through milling and flotation at an assumed55% recovery.
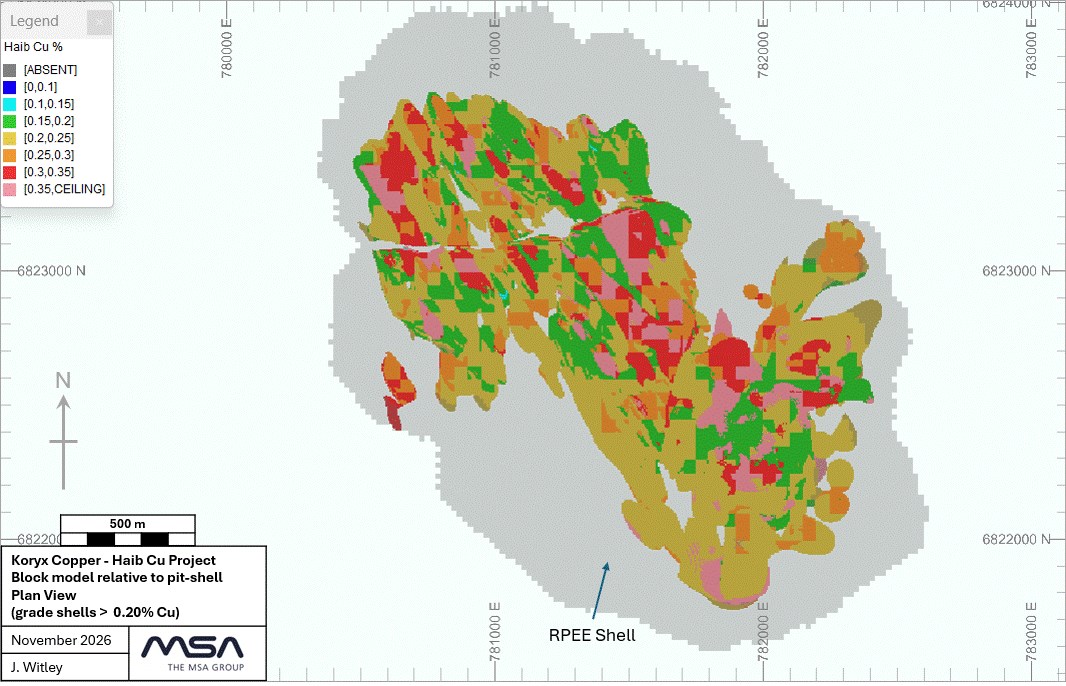
Figure 2: Haib resource pit shell and block model - plan view
To view an enhanced version of this graphic, please visit:
https://images.newsfilecorp.com/files/10948/324393_c7272af404d189cd_004full.jpg
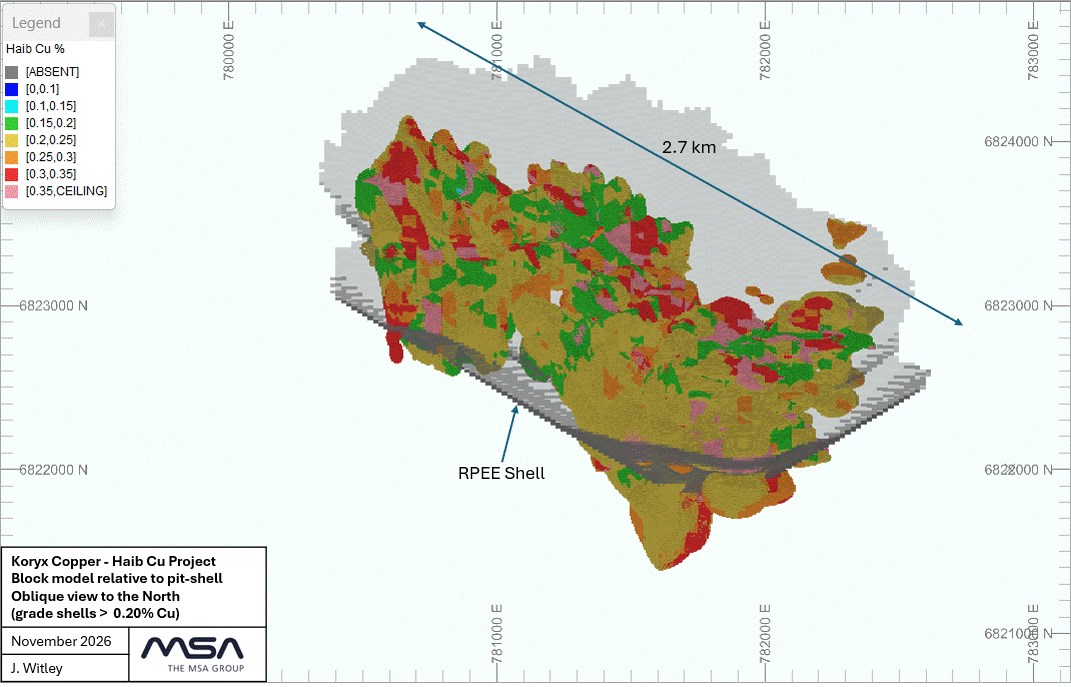
Figure 3: Haib resource pit shell and block model -oblique view to the north
To view an enhanced version of this graphic, please visit:
https://images.newsfilecorp.com/files/10948/324393_c7272af404d189cd_005full.jpg
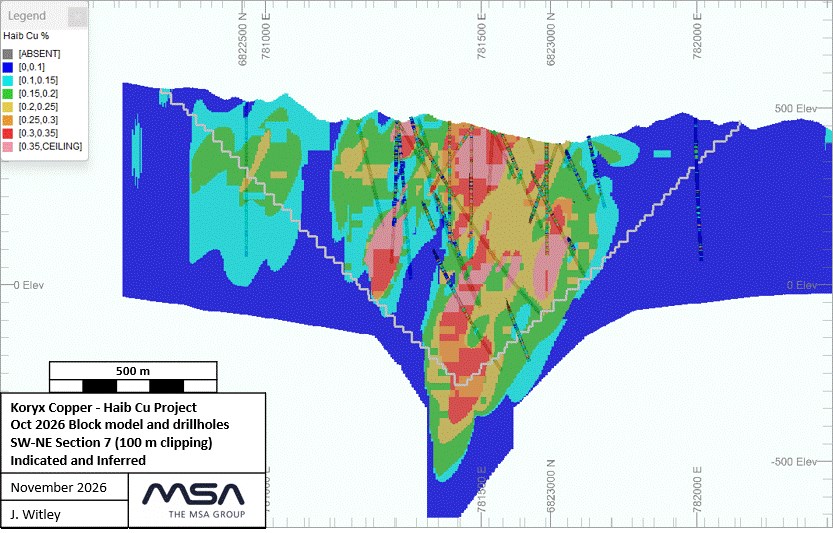
Figure 4: Haib resource block model section, drillholes and pit shell NW Zone, view to the northwest
To view an enhanced version of this graphic, please visit:
https://images.newsfilecorp.com/files/10948/324393_c7272af404d189cd_006full.jpg
Pit Optimization and Mine Design
The PFS mining component is based on MSA's updated Mineral Resource estimate, effective 28 October 2026. The PFS supports disclosure under NI 43-101, using the CIM Definition Standards, under the responsibility of appropriately experienced qualified persons (as defined in NI 43-101).
The PFS evaluates development options for the Project's technical and economic viability and establishes the preferred open pit configuration and processing route. It includes financial analysis and an assessment of the modifying factors needed for the qualified persons to determine whether Mineral Resources can be converted to Mineral Reserves at the reporting date. A PFS carries a lower level of confidence than a Feasibility Study and is the minimum study level required to declare Mineral Reserves.
The operation comprises drilling, blasting, loading and hauling, with bulk mining supplemented by selective excavation of mineralised material to manage ore loss and dilution. An experienced contractor will undertake the full mining scope, with only mine technical services performed by the owner's team. The contractor will be responsible for drilling, blasting, loading and hauling of ore and waste, stockpile rehandling, haul road and waste dump maintenance, and associated support, and will supply the equipment, materials, facilities, supervision and labour required.
Drilling and blasting will be on 15 m benches, with waste excavated over the full bench height and mineralised material mined selectively in two 7.5 m flitches to limit ore loss and dilution. Electric rope shovels with 56 m³ buckets will handle both bulk waste and selective ore, loading 360 t diesel-electric rigid haul trucks with trolley assist on designated routes. Support equipment will include production drills, graders, dozers, front-end loaders, rock breakers and utility excavators, with ore hauled to the primary crusher or run-of-mine ("ROM") and low-grade stockpiles, and waste to waste rock dumps.
Pit designs use staged pushbacks to prioritise higher-grade plant feed early and defer waste stripping where practicable, subject to access, slope stability and production requirements. The production schedule integrates pit development, fleet capacity, stockpiles and plant feed over the life of the operation.
Sulphide material meeting the elevated processing cut-off grade of
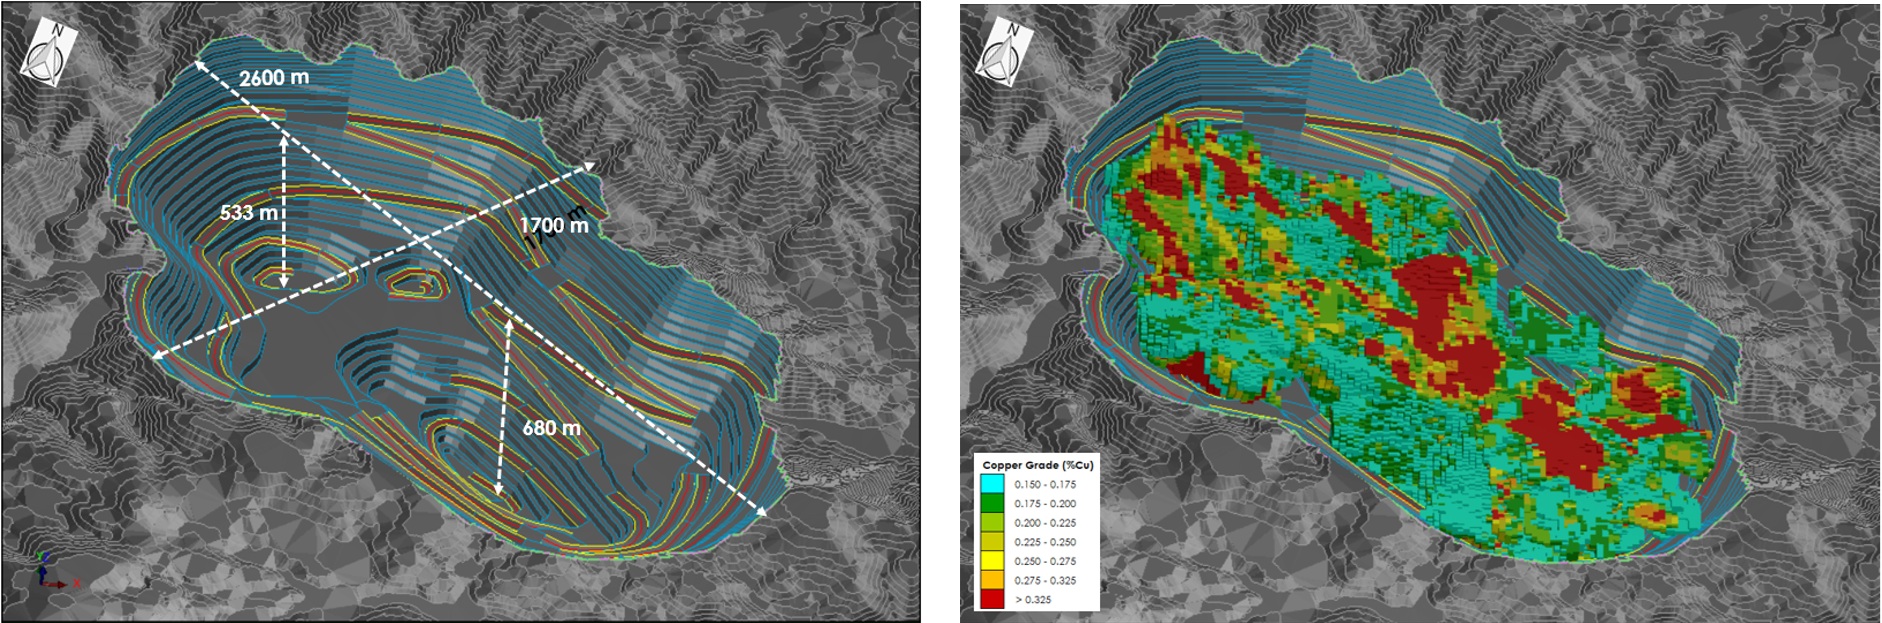
Figure 5: Ultimate pit design and layout
To view an enhanced version of this graphic, please visit:
https://images.newsfilecorp.com/files/10948/324393_koryx-figure5.jpg
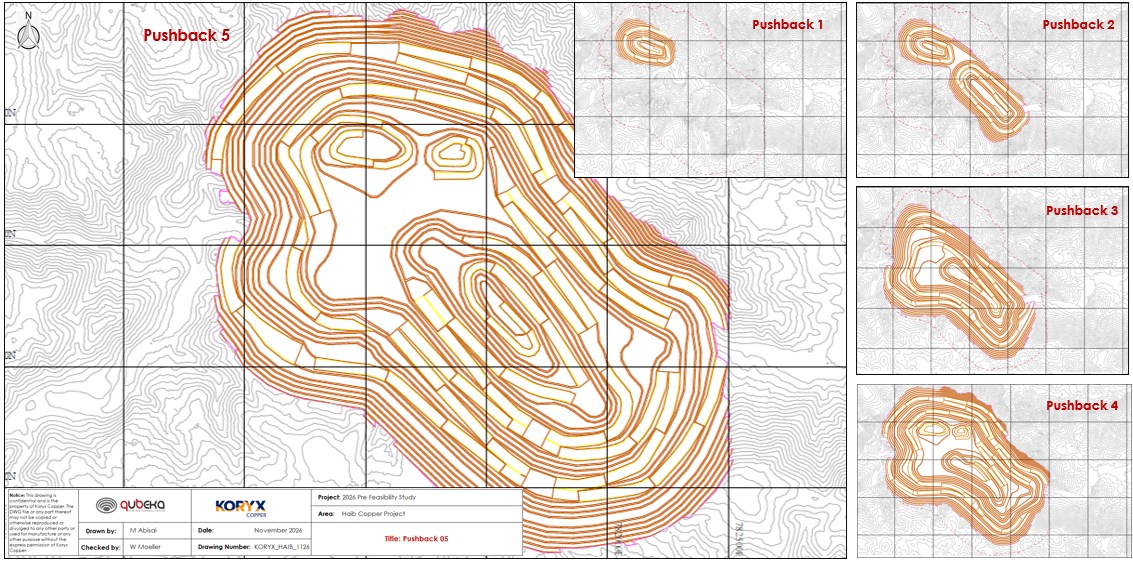
Figure 6: Final & interim pushback designs
To view an enhanced version of this graphic, please visit:
https://images.newsfilecorp.com/files/10948/324393_c7272af404d189cd_009full.jpg
Whittle pit optimisation was undertaken using a base copper price of US
The optimised pit shell was informed by mineralization contained within the modelled
A series of nested economic pit shells was generated during the optimisation process using the applicable technical and economic assumptions. The selected optimisation shells were subsequently used as the basis for the development of practical ultimate pit designs.
The pit design converted the selected optimised pit shell into a practical open-pit design incorporating haul ramps, benches and berms, in compliance with geotechnical and mine design criteria. Practical adjustments for minimum mining widths, ramp access, bench configurations and geotechnical constraints mean the final design may deviate locally from the optimised shell.
Ramp layouts and pit exits were selected considering their effect on waste stripping, haul distances, productivity and operating costs, and the planned material flow to the primary crusher, run-of-mine facilities and waste rock storage. The resulting pit and pushback designs, shown in Figure 5 and Figure 6, set the practical mining limits used for production scheduling, equipment requirements and the Mineral Reserve estimate.
LOM Production Schedule
The Haib Copper Project LOM production schedule, as depicted in Figure 7, comprises of a pre-stripping period followed by approximately 24 years of processing. Mining progresses through five staged pushbacks, with about 51.5 Mt removed during pre-stripping.
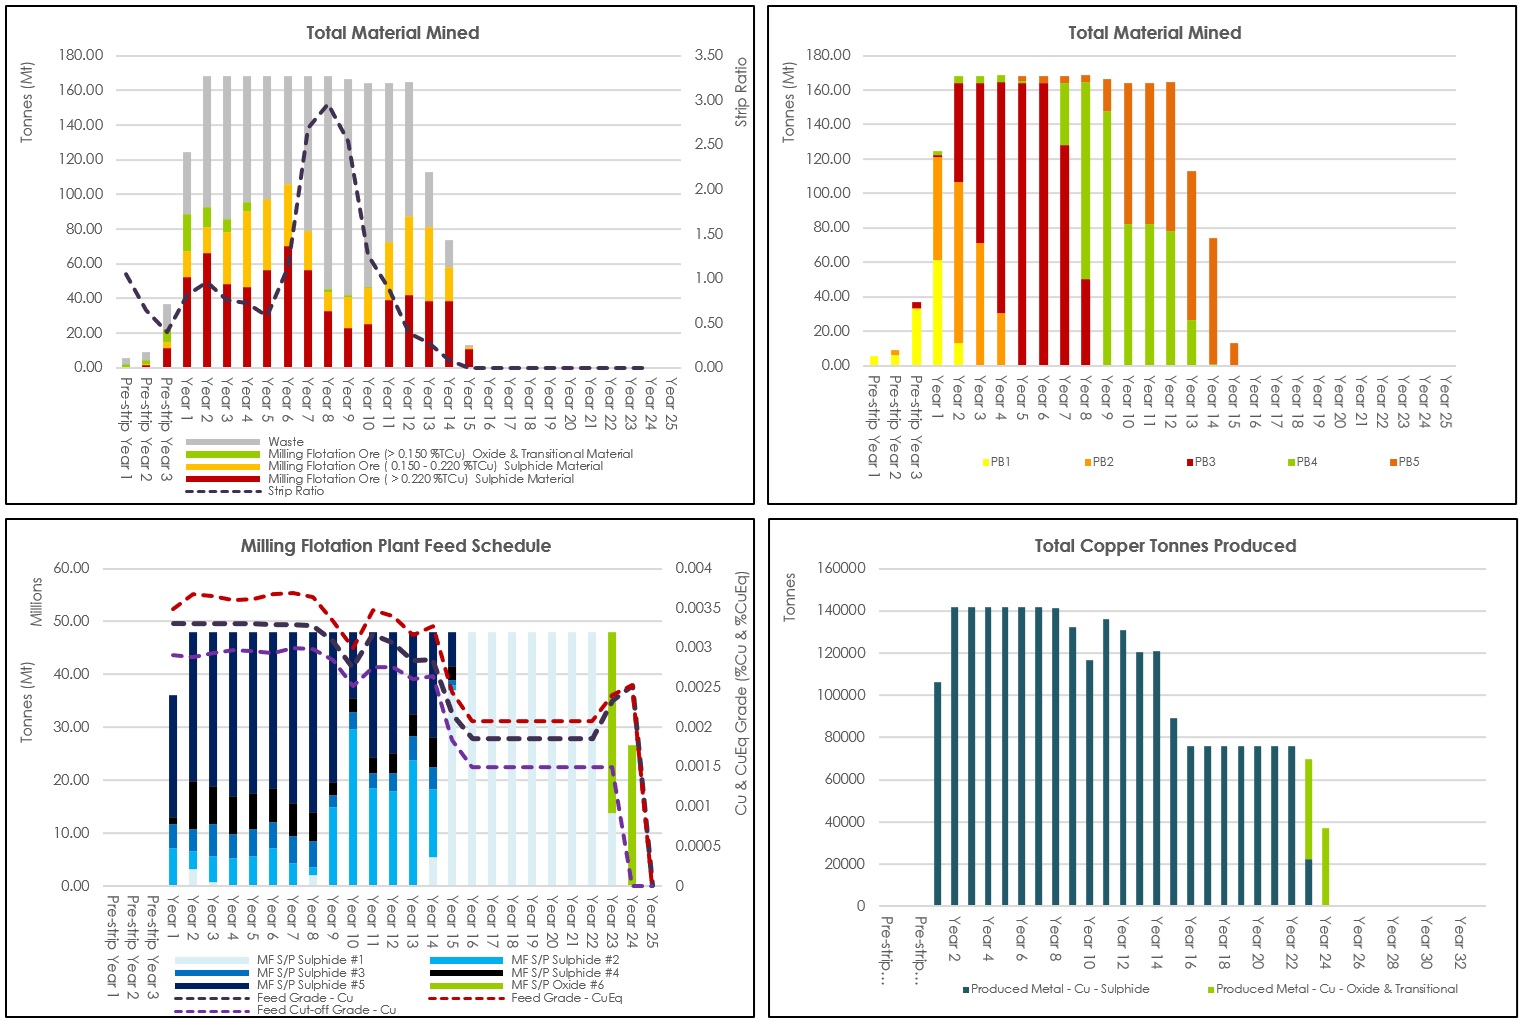
Figure 7: Key mining production schedule graphs
To view an enhanced version of this graphic, please visit:
https://images.newsfilecorp.com/files/10948/324393_kxfig7.jpg
Total scheduled material movement is about 2,212 Mt (1,119 Mt of ore and 1,093 Mt of waste), at an overall strip ratio of 0.98:1.
Annual movement peaks at about 168 Mt before declining as the final pushbacks complete, with open pit mining ending in operating Year 15.
The concentrator is scheduled to process about 48 Mtpa after ramp-up. A variable cut-off grade strategy prioritises higher-grade sulphide material early, maintaining copper feed grades of about
Total scheduled copper production is approximately 2.61 Mt from sulphide and oxide/transitional material. Annual copper production reaches approximately 142 kt early and declines to about 76 ktpa during later sulphide stockpile treatment. Scheduled byproducts total about 24.7 kt of molybdenum and 310 koz of gold; no molybdenum or gold recovery is assumed for transitional and oxide feed.
The LOM production schedule uses a variable cut-off grade strategy based on Ken Lane's economic principles. Rather than a single fixed cut-off, the scheduling cut-off grade varies through time to maximise project value. Material above the elevated scheduling cut-off is processed immediately, while lower-grade material above the marginal economic cut-off may be:
- Stockpiled for processing at a later stage;
- Deferred to a subsequent scheduling period; or
- Processed only when higher-grade material is unavailable.
Mineral Reserves
The Mineral Reserve estimate for the Haib Copper Project is reported in accordance with NI 43-101 and the Canadian Institute of Mining, Metallurgy and Petroleum (CIM) definitions and guidelines. It incorporates the PFS-level modifying factors: mining, metallurgical, economic, infrastructure, legal, environmental, social and governmental.
The estimate is based on open-pit optimisation, practical mine designs and a LOM production schedule. Only Indicated Mineral Resources were eligible for conversion to Mineral Reserves after applying modifying factors. Inferred Mineral Resources were given no economic value in pit optimisation, excluded from the estimate and treated as waste in the LOM schedule.
Nested economic pit shells were generated using the PFS technical and economic assumptions. Selected shells guided ultimate pit designs incorporating geotechnical criteria, haul roads, ramps, berms, minimum mining widths and other operational requirements. The Mineral Reserve comprises material within these designs that meets the economic and processing criteria. The LOM schedule and financial evaluation demonstrate the economic viability of extracting and processing this material under the PFS assumptions.
As of 6 November 2026, the Haib Copper Project has Probable Mineral Reserves of approximately 1,119 Mt at
The estimate was prepared under the supervision of a qualified person experienced in open-pit mine planning, Mineral Reserve estimation and the Haib Copper Project. The Mineral Reserves, effective 6 November 2026, are summarised in Table 11.
Table 11: Mineral Reserve Estimate as of 6 November 2026 at a
| Category | Type | Tonnes | Cu Grade | Mo Grade | Au Grade | CuEq Grade | Cu Cont. | Mo Cont. | Cu Cont. | Mo Cont. |
| (Mt) | (%) | (ppm) | (g/t) | (%) | (Mlb) | (Mlb) | (kt) | (kt) | ||
| Total Mineral Reserve | Total High Grade (> | 561 | 67 | 0.02 | 4177 | 83.1 | 1895 | 38 | ||
| Total Low Grade (0.15 | 557 | 48 | 0.02 | 2426 | 59.2 | 1101 | 27 | |||
| Total Mineral Reserve | 1 119 | 58 | 0.02 | 6 603 | 142.3 | 2 995 | 65 |
Notes
- Mineral Reserves have been estimated in accordance with the CIM Definition Standards for Mineral Resources and Mineral Reserves adopted by CIM Council on 10 May 2014, as incorporated by reference into NI 43-101.
- The effective date of the Mineral Reserve estimate is 6 November 2026.
- The Mineral Reserve estimate was prepared by Mr Werner K Moeller, of Qubeka Mining Consultants CC, who is a qualified person as defined by NI 43-101, with the following foreign associations and membership designations:
- Fellow of the Australian Institute of Mining and Metallurgy - FAusIMM nr. 329888
- Member of the South African Institute of Mining and Metallurgy - MSAIMM nr. 704793; and
- Member of the Canadian Institute of Mining, Metallurgy and Petroleum - MCIM nr. 708163
- Mineral Reserves are reported on a
100% attributable ownership basis. - The estimate is supported by the Haib Copper Project Pre-Feasibility Study, dated November 2026, and is based on the Mineral Resource model with an effective date of 28 October 2026
- All Mineral Reserves are classified as Probable. No Proven Mineral Reserves have been declared.
- Mineral Resources are reported inclusive of Mineral Reserves and must not be added to Mineral Reserves.
- Mineral Reserves are contained within engineered open pit designs developed from economic pit optimisation and incorporate practical mining widths, access ramps, geotechnical design criteria and an achievable production schedule.
- The estimate assumes conventional open pit mining using 360-t payload rigid dump trucks with trolley assist and a suitable sized electric drilling and loading equipment type using conventional open-pit mining methods, with 15.0 m benches and 7.5 m mining flitches on mineralised benches.
- Mineral Reserves include mining dilution and allow for mining losses.
- Mineral Reserves are reported at the processing plant feed reference point. Reported grades and contained metal reflect dilution and mining losses at that point.
- Mineral Reserves were estimated using consensus metal prices and principal operating cost assumptions of:
- USD 10,469/t for copper, USD 48,488/t for molybdenum and USD 4,000/oz for gold, and an exchange rate of NAD 17.00 to USD 1.00.
- Royalty and Export Levy:
4% , Copper payability:96.0% , Molybdenum payability76.4% , Gold payability81.0% . - Overall slope angle: 47° for Fresh, 45° for Oxide and Transitional.
- Flotation recovery:
88.2% Cu,40.6% Mo,54.0% Au. - Average Mining Cost: 2.27 USD/tonne
- Processing Cost: 6.77 USD/tonne ore processed by flotation
- SG&A Overheads 0.38 USD/tonne ore to primary crusher.
- The copper equivalent calculation uses the following formula for the price contribution of each metal in one tonne relative to copper.
- (Cu grade * Cu Price * Cu Recovery * Cu payability + Au grade * Au Price * Au Recovery * Au payability + Mo grade * Mo Price * Mo Recovery * Mo payability) / (Cu grade * Cu Price * Cu Recovery * Cu payability) * Cu grade
- Recoveries are assumed from preliminary metallurgical test work for bulk concentrate production with initial coarse particle flotation. Oxide material is planned to be stockpiled and processed at the end of life-of-mine through milling and flotation at an assumed
60% recovery, to be confirmed with additional test work.
- Mineral Reserves are reported above an elevated cut-off grade of 0.15 %Cu, determined using the applicable operating costs, metallurgical recoveries, payabilities, selling charges and royalties.
- Only Measured and Indicated Mineral Resources were considered for conversion to Mineral Reserves. Inferred Mineral Resources were excluded from the Mineral Reserve estimate and assigned no economic value in the reserve mine plan.
- Tonnes are reported in metric tonnes. Figures have been rounded to reflect the accuracy of the estimate; totals may not sum due to rounding.
- Mlb = Million pounds, Mt = Million tonnes, kt = thousand tonnes, Mlb = Million pounds, ppm = parts per million, koz = thousand troy ounces
Metallurgical Test Work
Mineralogical evaluation of the Haib deposit during the PFS determined that three types of copper mineral associations were present in the mineral resource. Chalcopyrite and pyrite were observed in veinlets, aggregates and disseminated form, associated with several different host rock mineral types. Generally, little or no variance was observed in respect of flotation recovery from samples containing these physical characteristics, but there was some variance in hardness and response to crushing and milling.
The samples tested for the PFS exhibited the following range of chemical analyses:
- Copper grade from
0.11% -0.67% associated with approximately 25 - 400ppm molybdenum, 1.8 -4.6% Fe and 0.3 -1.4% S. - Gold grades were typically low measuring 0.02 - 0.07g/t Au.
- Silver grades in the range 0.47 - 1.2g/t Ag.
Comprehensive metallurgical tests have been undertaken since the mid 1990s. During the PFS, Koryx commissioned the following additional tests in support of the selected PFS process flowsheet:
- Confirmation of comminution parameters, mineral liberation and reagent suite settings for optimal copper flotation across the whole range of sulphide samples. The comminution testing included evaluation of high-pressure grinding roll ("HPGR") in a tertiary crusher application.
- Rougher flotation, regrind, cleaner and recleaner flotation tests to produce potentially marketable primary copper sulphide and secondary copper-molybdenum sulphide concentrates.
- Testing of Coarse Particle Flotation ("CPF") in the milling circuit to reject coarsely milled barren waste ahead of conventional flotation as well as CPF testing to evaluate a tailings scavenger application.
- Jameson cell flotation tests to evaluate the potential of combining conventional and Jameson Cell flotation to reduce power consumption and optimize concentrate copper grade.
- In addition to the PFS testing, three bulk sulphide samples of varying copper grades, have been collected from accessible portions of the resource, to be used in 2027 for pilot plant tests.
Generally, the comminution and flotation results produced during the current test program were consistent with or exceeded the results of the historical programs completed by Mintek in 1996 and by Koryx and Maelgwyn during 2025, specifically:
- Comminution test results would typically be considered indicative of "hard" or "moderately hard" mineralization with average CWi ranging from 13.3 - 20.9 kWh/t, BBWi values ranging from 17.5 - 23.3 kWh/t and Axb values of 21 - 41.
- Packed Bed Testing ("PBT") tests confirmed amenability to HPGR and provided preliminary HPGR breakage parameters.
- Other than minor molybdenum, no other base metal sulphides were observed that could result in contamination either of copper concentrate products of the metallurgical process, or of tailings.
- Laboratory scale milling and flotation tests on core samples determined that a copper rougher flotation recovery ranging from
88% to96% could be achieved following a primary grind to80% passing 150 µm to ensure liberation of chalcopyrite and pyrite from each other and from gangue minerals before flotation. On average about91% rougher recovery was achieved for low grade ("LG") samples containing <0.25% Cu and93% for higher grade ("HG") samples containing >0.25% Cu. - Comparative flotation tests using Orange River water confirmed the recovery performance with improved concentrate upgrade potential as compared to tests using Johannesburg tap water
- Bench-scale open circuit cleaner flotation tests inclusive of rougher concentrate regrind to
80% passing 15 - 25 µm followed by two to three stages of dilution cleaning achieved final concentrate grades ranging from 18 -33% Cu. - Optimized open circuit flotation testing on 20 variability samples containing 0.10 -
0.42% Cu at a primary grind of80% passing 150 µm with regrinding of the rougher concentrate showed the potential to achieve a copper recovery ranging from 81 -93% and89.5% on average at an average final concentrate copper grade of21.8% . - Five locked cycle tests were conducted under optimal flotation test conditions at a primary grind of
80% passing 150 µm with regrinding of the rougher concentrate followed by dilution cleaning. The locked cycle tests were conducted on variability samples containing 0.24 -0.41% Cu with performance projections indicating a copper recovery ranging from 85 -93% and90.9% on average at an average final concentrate copper grade of24.7% . Molybdenum recovery averaged45% with an average Mo grade of0.5% in the final copper concentrate. The final concentrate Au grade ranged from 0.6 to 1.5 g/t and silver grades ranged from 22 to 44 g/t. - Tests to separate Mo from the copper in the bulk Cu/Mo concentrate by a dedicated Mo flotation step were moderately successful.
87.9% of the Mo and about6.1% of Cu in the bulk Cu/Mo concentrate could be recovered to a secondary concentrate containing up to16% Cu and 3-4% Mo. - CPF tests were completed on LG and HG feed samples and included assessments of the application of CPF in a CGR application in the milling circuit at a primary grind of
80% passing 150 µm. The CGR test work showed the potential to reject 25 -30% of the test mill feed mass to a coarse tailings stream (+150 µm and -425 µm) with a copper grade of0.02% to0.04% Cu, representing a recovery loss of 3-5% of the copper in the test feed. CGR offers the potential to pre-concentrate copper in the feed stream to the main flotation circuit and will reduce power consumption per unit of feed material. - The CGR test pre-concentrate containing 0.4 to
0.6% Cu was milled to80% < 150 micron and combined with fines from the milling and screening preparation step ahead of the CGR test. The combined fines and CGR pre-concentrate contained0.24% copper as compared to a measured copper grade of 0.13 -0.15% in the original test feed. A locked cycle test on the combined pre-concentrate stream yielded a fine flotation tailings stream with a Cu grade of0.03% reflecting a flotation circuit copper recovery of85.2% to a final concentrate containing22.7% copper. - Additional CPF tests were also completed on a HG feed sample to evaluate the application of CPF in a tailings scavenger duty at a coarser primary grind of
80% passing 350 µm. These tests showed potential for increased copper losses in tailings with final tailings grade of 0.06 to0.07% Cu. Overall the mass balance data indicated an additional recovery loss of about 3.5 -4.0% relative to the CGR option indicating that future tailings scavenger testing should potentially consider a finer grind of 180 - 200 µm to target improved recovery. - Geochemical assessment of waste rock, LG ore and tailings samples determined that all materials contained gangue acid consumers likely to completely offset possible acid drainage.
- Settling tests of coarse and fine tailings samples were used in tests to develop thickener design parameters.
Process Plant Design and Trade-off Studies
Based on the metallurgical test results as well as the conclusions of trade-off studies completed during the PFS, a single process route is now intended for all sulphide material containing at least
Process trade-off studies were prepared before Koryx finalised process configuration and plant capacity for the PFS. These included the following studies:
- Comminution test results and alternative crushing and milling circuit simulations concluded that for Haib, the optimal configuration was primary gyratory crushing, secondary cone crushing, tertiary crushing using HPGRs and a single stage of ball milling.
- Heap leaching of oxides and secondary sulphides was removed from the PFS circuit. Secondary sulphides will be processed by flotation from start of operations, oxides will be stockpiled and may be recovered by flotation before closing the operation, using a dedicated reagent suite still to be finalised.
- Cash flows were prepared for different annual processing rates and plant configurations. The optimum PFS combination was a 48 Mtpa milling and flotation ("MF") concentrator processing sulphides containing >
0.175% Cu. The MF plant will produce copper and molybdenum in concentrate for 24 years. - The favoured plant location was to keep the ore crushing and screening plant on the west side of the pit and convey the crushed ore to the "wet" milling and flotation plant close to the tailings storage facility.
- CPF on a 150 µm to 425 µm fraction from the milling circuit was tested successfully. This coarse gangue rejection (CGR) option targeting
25% rejection of total fresh feed mass to coarse tailings was found to be more beneficial than scavenger CPF and CGR has been incorporated in the PFS base case flowsheet. - The primary milling circuit was specified to achieve a target grind of
80% passing 150 µm. Rougher concentrate will be milled to80% passing 15 -25 µm before cleaner flotation. - A combination of conventional and Jameson flotation cells produced the best combination of low power consumption, smaller plant footprint, and high copper recovery and grade of final product.
- A Mo flotation circuit to recover Mo from the bulk Cu-Mo concentrate and produce separate primary Cu and secondary Cu-Mo concentrates was modelled
- Concentrate cost studies were completed of transportation to Walvis Bay and Lüderitz for shipping to international customers.
Process Flow Sheet
The MF plant process design includes the following steps:
- 48 Mtpa of ROM material is processed through three parallel and identical 16 Mtpa crushing circuits comprising primary gyratory and secondary cone crushing with a tertiary HPGR as well as appropriate screens and intermediate conveyors and stockpiles.
- HPGR product will be transferred to two parallel 24 Mtpa ball milling trains. Multiple units per module are likely to be required due to the maximum commercial equipment size that is available.
- The comminution circuits will target a nominal primary grind of
80% passing 150 µm. - A 150 to 425 µm fraction of mill classification cyclone underflow will be screened out and processed by coarse particle flotation (CPF). The equivalent of
25% of ROM mill feed will be rejected and discarded to coarse tailings in this CGR configuration. CPF/CGR pre-concentrate will be recycled and reground in the primary mill ahead of conventional rougher flotation. - The milled flotation feed reflecting
75% of the ROM mill feed will be transferred to two 18 Mtpa flotation circuits which incorporate Jameson cells for rougher flotation and mechanical tank cells for scavenger flotation. The rougher concentrate is subsequently reground and subjected to cleaner and re-cleaner flotation in Jameson cells, followed by cleaner scavenger flotation in mechanical tank cells, to recover copper, molybdenum and gold into a bulk copper concentrate. - Bulk Cu-Mo concentrate will be dewatered and washed followed by secondary cleaner and re-cleaner flotation stages in conventional mechanical tank cells with entirely new Mo flotation reagents. A secondary Cu-Mo concentrate containing >
3% Mo and 11 to15% Cu will be produced, with the Mo flotation tailings becoming the primary Cu concentrate containing 21 to22% Cu. Both the primary and secondary concentrates are expected to contain about 0.4 to 1.2 g/t Au. - The coarse CGR tailings will be combined with thickened fine flotation tailings and pumped to the TSF at a slurry solids concentration of
58% to60% w/w. - Separate thickening, filtration and product handling facilities for primary and secondary concentrate will use pressure filters to reduce moisture content to
10% or less.
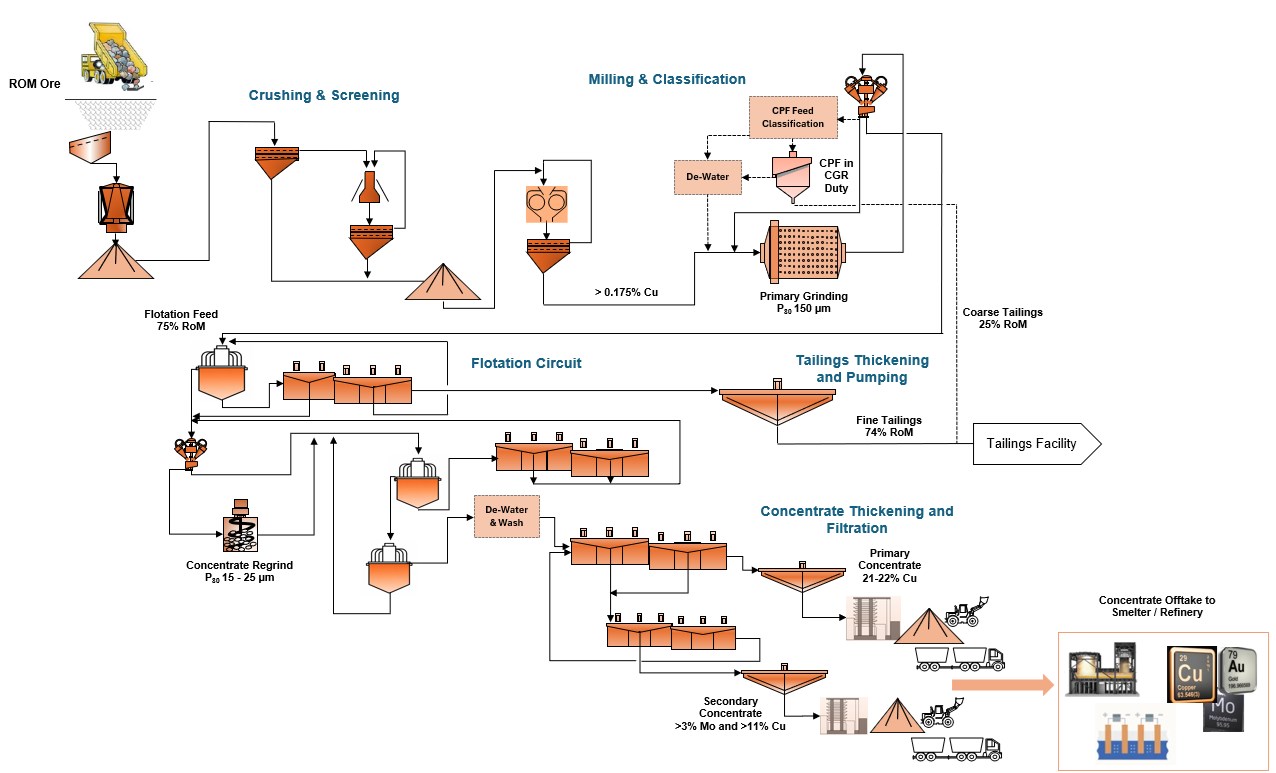
Figure 8: Simplified PFS base case 48 Mtpa MF flowsheet:
To view an enhanced version of this graphic, please visit:
https://images.newsfilecorp.com/files/10948/324393_c7272af404d189cd_014full.jpg
Tailings Storage Facility
A trade-off study was conducted at the start of the PFS to assess nine (9) alternative locations for the TSF generally placed within valleys in the Project area. The options were conceptually sized and compared through a Multi-Criteria Alternative Analysis ("MCAA") with principal socio-environmental, technical and financial weighted criteria such as, but not limited to, social and environmental impacts, storage capacity, storage efficiency, height, geotechnical suitability, constructability and staged development, operability, dam safety risks, as well as provisional capital and sustaining capital cost estimates.
The MCAA showed TSF4 to be the preferred TSF solution offering the only position which can contain all the tailings through the life of mine, the most efficient storage, particularly in terms of pre-operation starter earthworks requirement, the least environmentally sensitive location, robust design against potential dam breach, and the closest location to the north of the process plant which minimises pumping costs.
Further optimisation of the TSF4 location was undertaken for a storage capacity of approximately 1.15 billion tonnes of tailings. A cross-valley starter embankment for the first year's operation will be constructed using local borrow from the TSF basin and enlarged in the early life of mine through downstream rockfill raises to cater for approximately eight (8) years of operations. Thereafter centre line raises will be carried out to the full size of the facility. This includes an eastern containment wall to keep tailings away from the larger Haib River catchment area and associated stormwater runoff. Downstream and centerline construction were preferred to develop a robust design and to reduce the likelihood of dam failure.
During the next project phase, Koryx plans to optimise the embankment material zoning and use of construction materials recovered from the coarse fraction of the tailings, water recovery, and generally advance the design detail particularly around tailings deposition.
Mine Power Supply
The system is designed to meet the peak process plant and site infrastructure demand estimated at 261MVA and annual usage of approximately 1,650 GWh. The PFS power supply design combines a 220 kV connection to NamPower's Harib Substation with an on-site embedded solar PV and battery energy storage system ("BESS") plant.
Dual overhead transmission lines will supply the plant from Harib Substation via a dedicated NamPower switching and metering station at the mine boundary, onwards to two main internal 220/33 kV mine substations. The bulk transmission infrastructure is designed to provide N-1 redundant supply to ensure continuous operations.
The selected renewable hybrid configuration comprises approximately 417 MWp of solar PV and 361 MWh of initial battery storage, with ongoing augmentation that matches the mine's updated demand and plant lifespan. The plant is designed to supply approximately
The adopted independent power producer structure places plant funding and lifecycle operation with the provider, with the mine purchasing delivered energy under a long-term power purchase arrangement. Grid supply remains essential, with off-grid back-up remaining a future possibility subject to further development and licensing.
The Namibian electricity regulatory framework, managed by the Electricity Control Board (ECB), currently allows for energy demand of up to
Koryx has entered into a Memorandum of Agreement with NamPower and they are in the advanced stages of the final design of the grid connection infrastructure, the outcome of which will be a grid connection offer letter which will form the basis of the Power Supply Agreement.
The project is expected to provide significant upgrades to the existing NamPower infrastructure as well as providing new infrastructure to strengthen the national grid, all of which will be handed over to NamPower for operation, upon completion.
Mine Water Supply
The water supply assessment identified the Orange River as the preferred source for the Project's water demand of approximately 20 million cubic metres per year.
The proposed water supply scheme is sized to abstract water from the Orange River only during periods of surplus flow, after allowing for downstream user demands, environmental requirements and system losses, and store it in an off-channel dam to maintain supply during droughts and low-flow periods. Hydrological and water balance studies informed the abstraction requirements, storage provision and supply assurance.
Two options for the bulk water system were sized and costed, one along the RTZ Gorge, and one along the Haib River route as is shown in Figure 9 below. Both systems are technically feasible, but with the relocation of the mineral processing plant to the west of the open pit, the RTZ Gorge option is expected to offer significant savings over the originally intended Haib River route.
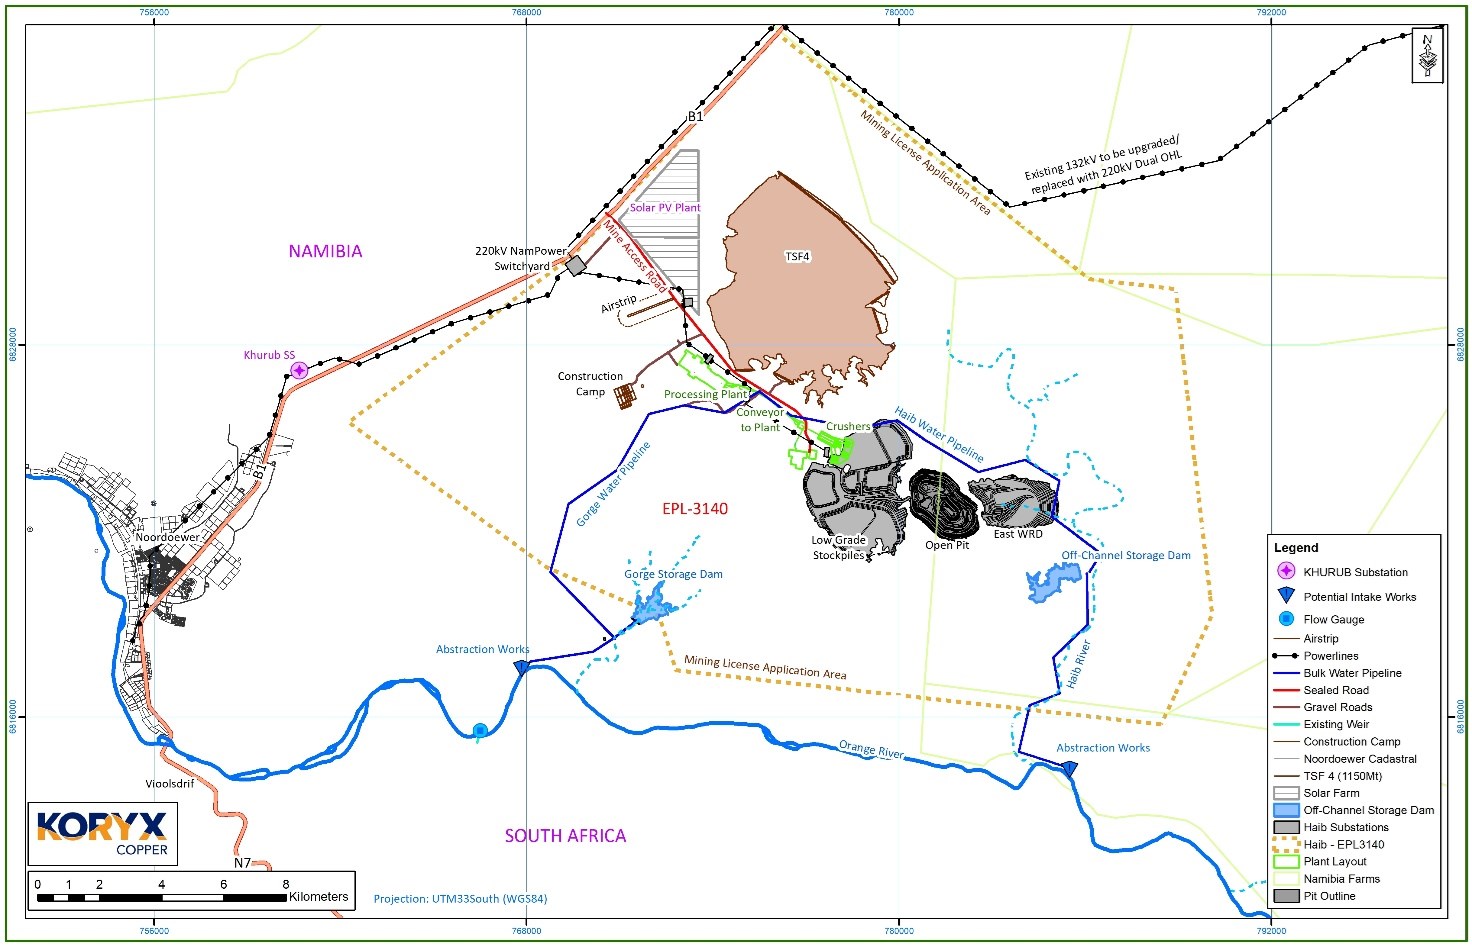
Figure 9: Plan view of PFS Haib mine site layout
To view an enhanced version of this graphic, please visit:
https://images.newsfilecorp.com/files/10948/324393_c7272af404d189cd_015full.jpg
The RTZ Gorge option allows for shorter pipelines, the elimination of two booster pump stations and a site suitable for a roller-compacted concrete dam that can be raised incrementally during the first four years of operations. Koryx plans to develop this design further in the next phase, which will require prioritisation of geotechnical and land access investigations to confirm more accurate route and foundation requirements for the water balancing dam and intake infrastructure.
Engagement with NamWater is ongoing, with a signed Memorandum of Understanding in place and an Infrastructure Development Agreement under review supporting the planned transfer of the intake-to-storage supply infrastructure to NamWater for ownership and operation under an agreed volumetric tariff, while the mine would retain responsibility for the storage dam and onward transfer infrastructure.
Mine Access Road
The Project is accessed from Windhoek or Noordoewer via the B1 National Highway and farm roads developed during exploration. The main access route has been relocated closer to the B1 intersection, giving a 10.5 km alignment to the plant and mining services area.
The alignment follows natural topography, to balance cut and fill requirements. The B1 access point will have a surfaced intersection upgrade with acceleration and deceleration lanes for heavy vehicle safety.
The main access road and B1 intersection will have a bituminous seal, chosen for life-cycle cost, dust control and durability. The road will be built as gravel for early construction and start-up, then sealed in the first year of operations, which also avoids dust contamination of the nearby solar PV plant. Internal roads will have a gravel wearing course with dust suppressants.
Mine Housing
The PFS proposes permanent mine housing in a planned Noordoewer township north of the existing developments, supporting the Project's workforce and local economic activity. The township covers approximately 36.6 hectares with 370 erven (surveyed lots) for residential, business, mixed-use, institutional and recreational uses, and a planned capacity of approximately 2,000 residents.
Mine housing would comprise homes for management and flats for shift-workers, with bulk and internal services (sewer, water, electricity and roads). Koryx plans to provide 543 housing units and all infrastructure for the township; remaining residential erven would be available to contractors to house their own personnel.
Conventional and prefabricated construction have both been assessed. Final requirements, unit mix and construction approach remain subject to design development, service capacity confirmation and approvals.
Social & Environmental
A comprehensive environmental and social assessment and management process is advancing, including ongoing regulatory compliance, submission to the relevant Namibian authority of two Environmental and Social Impact Assessments ("ESIAs") with Environmental and Social Management Plans ("ESMPs"), development of two more, and ongoing monitoring.
The ESIA studies to date exceed Namibian legislative requirements and are guided by International Finance Corporation ("IFC") standards, with the aim of IFC compliance before activities commence.
Public consultation with interested and affected parties shaped the scope of specialist studies: biodiversity, aquatics, socio-economics, community health, hydrogeology, geochemistry, air, noise, viewsheds, water resource management, surface water hydrology, archaeology, blast and vibrations, traffic and mine closure. Routine surface water, groundwater and air monitoring has been ongoing since mid-2025.
Public and focus group meetings were held in Windhoek, Keetmanshoop, Karasburg and Noordoewer in August 2025 and April 2026. Stakeholder perception is generally positive, with interest in job creation and community development, and key concerns being water availability and population influx. The relevant authorities have been engaged throughout through formal regulatory engagement and ongoing feedback.
The predicted impacts are typical for a project of this magnitude, and mitigation and enhancement measures are proposed in the Project ESMPs. The ESMPs are a condition of clearance authorisation, linking mitigation and monitoring requirements and setting out roles, responsibilities, reporting and additional management plans, guided by international best practice.
Permitting
The Haib Project site currently operates in accordance with its current and approved Environmental Clearance Certificate ("ECC") issued in terms of the Environmental Management Act No. 7 of 2007 for exploration activities on EPL 3140.
The ongoing activities are supported by various obtained secondary permits, consents and licenses of which are independently audited biannually with results submitted to relevant authorities and used to inform continuous improvement of operations.
The permitting of Haib mining and related activities has advanced significantly with two of the four anticipated applications for ECC being submitted. The applications for ECC and their current status are as follows:
- Haib Mine - (APP-6117 submitted August 2026)
- Water Abstraction and Supply - (APP-6906 submitted September 2026)
- Grunau Railway Siding - (Under Development-Expected Submission Mid 2027)
- Bulk Power Infrastructure - (Under Development-Expected Submission Mid 2027)
- As the Project moves into DFS, applications may need amendment if activities or layout change materially; any amendments will follow the official regulatory process.
Additional applications submitted include:
- Mining License (ML) for the Haib Mine (PEA application submitted to the Ministry of Industries, Mines and Energy 1 September 2025)
- Water Abstraction License: 20 Mm3 per annum for 33 years operational water from the Orange River (Application submitted to Ministry of Agriculture, Fisheries, Water and Land Reform on 23 July 2026)
Various additional secondary permits, licenses and certificates typical of the large-scale mining projects will be applied for after the issuance of the major permits. These include: Borehole license, electricity generation license, consumer installation certificate, explosives magazine license, blasting permit, NHC consent, land clearance permit, sand mining permit, riparian clearance permit, sealed sources license etc. (Pending decision on ECCs).
Responsible Mining and Social Investment
Koryx is committed to embedding responsible mining, guided by its purpose to "turn geological potential into lasting shared value." Its strategy integrates environmental stewardship, community partnership, workforce safety, ethical governance, transparency and local value creation, anchored by a safety-first culture with ongoing training and skills development.
Through the Haib Foundation, Koryx delivers targeted corporate social investment ("CSI"). To date, the Foundation has reached many community members of all ages in Noordoewer and surrounding areas through early childhood development, school support, youth skills training and a multipurpose community education hub.
To manage the socio-economic dynamics of a large-scale project, Koryx is studying population influx, water security and local content prioritisation. By aligning early investment with long-term regional development, Koryx aims to build lasting opportunities and a strong social licence to operate in southern Namibia.
Risks and Opportunities
Risks:
- Further trade-off studies and pilot plant test work are required in order to complete additional dynamic plant simulations and trade-offs in the DFS.
- CPF in a CGR application offers the opportunity for reduced power consumption and operating cost savings, however its inclusion in the comminution circuit introduces operational complexity.
- Tailings assay and test accountability variance create some Cu and Mo recovery uncertainty which is most pronounced for lower feed grades.
- The Au recovery model is preliminary due to low feed grades.
- The oxide/ transitional Cu recovery in the final two years of production has been assumed, with confirmatory tests due to be completed by the end of 2026.
- The return water from the TSF is a key part of the water balance, and evaporation and entrainment losses are expected to be significant as the TSF grows, putting water recovery at risk.
- Town planning, land use agreements are dependent on approvals from regional authorities and are long-lead items with no fixed timelines.
Opportunities:
- Further pilot testing and optimization of the CGR conditions, rougher concentrate regrind, and flotation cleaner circuit performance may offer opportunity for further recovery improvements and/or reagent cost reduction.
- Further assessments of the water dam location, design configuration and storage volume optimization may yield capital cost gains for the initial construction and subsequent dam wall raises.
- Cost and efficiency gains may be achieved from considering construction package proposals from regional or international EPC and/or construction contractors and fabricators instead of relying on less competitive Namibian contractors only.
- Further layout optimisation to be conducted, specifically as it relates to moving the secondary crushing stockpile to the plateau, consolidating stockpiles, and optimising terraces by further adapting to the terrain.
DFS Planning
With the PFS complete, Koryx plans to start a Definitive Feasibility Study ("DFS") on Haib, targeted for completion in 2027. The DFS is intended to advance the PFS to a level of definition that supports project financing and a construction decision. The priorities will be to:
- Increase the Mineral Reserve base declared in the PFS, chiefly by converting Inferred material within the pit to Indicated.
- Confirm the process flowsheet through further metallurgical test work.
- Prepare DFS standard engineering designs of the plant and supporting infrastructure, including power, water and tailings.
- Firm up the capital and operating cost estimates.
- Alongside the DFS, Koryx plans a strategic options and project financing review in 2027.
Permitting is well advanced. Koryx applied for a Mining Licence in September 2025. The ESIA and ESMP, which form the application for the ECC (a condition of the Mining Licence), were submitted to the Ministry of Environment, Forestry and Tourism in August 2026. Koryx expects the permitting process, including the permits for water and power infrastructure, to be completed by around the middle of 2027, with the major permits in hand.
To lead this work, Koryx is expanding its Owner's Team. The team is expected to direct the DFS consultants and set up the project controls, cost and schedule framework that will take Haib from study into execution.
Koryx also plans to begin operational readiness planning during the DFS, so that the operation is ready to run safely and efficiently from first production. This is expected to cover the operating model and organisation design, workforce planning with a focus on recruiting and training Namibian employees, and maintenance and asset-management strategy. It is also expected to cover procurement and logistics for concentrate export, and the business systems and procedures needed for commissioning and ramp-up.
Following the DFS, Koryx plans front-end engineering and early works construction and procurement programmes ahead of a construction decision.
Presentation & Investor Webinar
Koryx management will host a live webinar conference call to discuss the results of the PFS.
Live, online webinar conference call to discuss PFS results:
Date: Wednesday, November 18th, 2026
Time: 10:00am EST, 17:00 Namibia time
Webcast Registration Link: https://bit.ly/4zJJw3z
Koryx Site Visit & Investor Day to be held on site on 4/5 February 2027. Contact Management for Details.
A replay of the webcast will be available on Koryx' website at www.koryxcopper.com following the event.
Data Verification
The qualified persons responsible for the PFS technical report have verified the data for which they are accountable, including the sampling, analytical, and test data underlying the information disclosed in this news release. Geological, mine engineering and metallurgical reviews included, among other things, reviewing drill data and core logs, review of geotechnical and hydrological studies, environmental and community factors, the development of the life of mine plan, capital and operating costs, transportation, taxation and royalties, and review of existing metallurgical test work. In the opinion of the Qualified Persons, the data, assumptions, and parameters used in the sections of the PFS that they are responsible for preparing are sufficiently reliable for those purposes. The technical report in respect of the PFS, when filed, will contain more detailed information concerning individual qualified persons responsibilities, associated quality assurance and quality control, and other data verification matters, and the key assumptions, parameters and methods used by the Company.
Quality Assurance / Quality Control
All drill core is HQ sized at collar and reduced to NQ size in fresh rock. Core is logged, photographed and cut in half with a diamond saw. One half is bagged for analysis, and the other half is quartered, with one quarter archived and stored on site for verification and reference purposes and the other reserved for metallurgical test work. Reverse circulation ("RC") chips are thoroughly logged and photographed, and a 2m composite sample is obtained from two consecutive 1m intervals using a riffle splitter. The homogenized material is poured evenly across the full width of the riffles, splitting it into two equal samples of ~5kg each, which are bagged and assigned the same ticket number. One stream is sent for analysis and the other is archived and stored on site for verification and reference purposes. Core samples are sent to ALS Laboratories Ltd. in Johannesburg, South Africa (SANAS Accredited Testing Laboratory, No. T0387) and ActLabs in Canada, and RC samples are sent to ALS only. Both laboratories are independent of Koryx. Thirty-four elements are analyzed by inductively coupled plasma ("ICP") using a 4-acid digestion, and gold is assayed using a 30g fire assay method. Duplicate samples, blanks and certified standards are included with every batch and are actively used to ensure proper quality assurance and quality control ("QA/QC"), at a frequency of 1 in 20 for each of blanks, duplicates and standards.
Qualified Persons
Mr Robin Mark Welsh (B.Sc. Engineering (Electrical)) is an engineer and project manager with 30 years experience in minerals processing projects and studies. He is a Senior Project Manager for DRA Projects Pty Ltd and is registered with the Engineering Council of South Africa (ECSA) as a Professional Engineer (no. 990118) and is a Senior Member of the South African Institute of Electrical Engineers (SAIEE). Mr Welsh visited the project site from 30 October to 1 November 2023, from 10 to 12 November 2024, and again from 12 to 13 November 2025. Mr Robin Mark Welsh is a qualified person and is independent of the Company, each as defined by NI 43-101.
The Qualified Person for the Mineral Resource estimate is Mr. J.C. Witley (BSc Hons, MSc (Eng.)) who is a geologist with 38 years' experience in base and precious metals exploration and mining as well as Mineral Resource evaluation and reporting. He is Head of Mineral Resources for The MSA Group (an independent consulting company), is registered with the South African Council for Natural Scientific Professions (SACNASP) and is a Fellow of the Geological Society of South Africa (GSSA). Mr. Witley has the appropriate relevant qualifications and experience to be considered a "qualified person" for the style and type of mineralization and activity being undertaken as defined in NI 43-101 and is independent of the Company, each as defined by NI 43-101.
Mr Werner Moeller is a Director and Principal Mining Engineering Consultant of Qubeka Mining Consultants CC, based in Windhoek, Namibia and has reviewed and approved the scientific and technical information in this news release. He holds a BEng degree in Mining Engineering and a BEng (Hons) degree in Industrial Engineering from the University of Pretoria (South Africa). He is a Fellow of the Australian Institute of Mining and Metallurgy (membership number 329888) and a Member of the South African Institute of Mining and Metallurgy (membership number 704793). Mr Werner Moeller has been practising his profession continuously since 2002 and has 24 years of mine planning and operations experience across a range of African projects. He visited the project site from 10 to 12 November 2024, and again from 12 to 13 November 2025. Mr Werner Moeller is a qualified person and is independent of the Company, each as defined by NI 43-101.
About Koryx Copper S.A.
Koryx Copper S.A. is a Luxembourg domiciled copper development company focused on advancing its
More than 170,000m of drilling has been conducted at Haib since the 1960's with significant exploration programs led by companies including Falconbridge (1964), Rio Tinto (1975), Teck (2014) and Koryx (2021-2026). Extensive metallurgical testing and various technical studies have also been completed at Haib. Additional studies are underway aiming to demonstrate Haib as a future long-life, low-cost, low-risk open pit, sulphide milling and flotation copper project with additional heap leach potential.
Mineralization at Haib is typical of a porphyry copper deposit and is dominantly chalcopyrite with minor bornite and chalcocite present and only minor secondary copper minerals at surface due to the arid environment. Haib is one of only a few examples of a Paleoproterozoic porphyry copper deposit in the world. Due to its age, the deposit has been subjected to multiple metamorphic and deformation events but still retains many of the classic mineralization and alteration features typical of these deposits.
Further information about the Project and the Company is available on the Company's website at www.koryxcopper.com and under the Company's profile on SEDAR+ at www.sedarplus.ca.
Additional information is also available by contacting the Company:
Heye Daun
President & CEO
hdaun@koryxcopper.com
+27-21-409-7100
Aideen McDermott
Investor Relations
amcdermott@koryxcopper.com
+1-416-837-7680
Neither the TSX Venture Exchange nor its Regulation Services Provider (as that term is defined in the policies of the TSX Venture Exchange) accepts responsibility for the adequacy or accuracy of this release.
Cautionary Statement Regarding Forward-Looking Information
This press release contains "forward-looking information" within the meaning of applicable Canadian securities legislation. Forward-looking information includes, without limitation, statements regarding the future or prospects of the Project or the Company, including the results of the PFS, including estimates of net present value, internal rate of return, payback, capital and operating costs, production, recoveries, prospective throughput and life-of-mine, the estimation of Mineral Reserves and Mineral Resources, the timing of filing the PFS technical report, the timing and completion of the DFS, the process plant design, the expected electricity demands and supply arrangements, the expected mine bulk water supply arrangements and the expected regulatory review process for the Project and timeframe thereof. Generally, forward-looking information can be identified by the use of forward-looking terminology such as "plans", "expects" or "does not expect ", "is expected ", "budget", "scheduled", "estimates", "forecasts", "intends", "anticipates" or "does not anticipate", or "believes", or variations of such words and phrases or state that certain actions, events or results "may", "could", "would", "might" or "will be taken", "occur" or "be achieved". Forward-looking statements are necessarily based upon a number of assumptions that, while considered reasonable by management, are inherently subject to business, market, and economic risks, uncertainties, and contingencies that may cause actual results, performance, or achievements to be materially different from those expressed or implied by forward-looking statements. Although the Company has attempted to identify important factors that could cause actual results to differ materially from those contained in forward-looking information, other factors may cause results not to be as anticipated, estimated, or intended. There can be no assurance that such information will prove to be accurate, as actual results and future events could differ materially from those anticipated in such statements. Accordingly, readers should not place undue reliance on forward-looking information. Other factors which could materially affect such forward-looking information are described in the risk factors in the Company's most recent annual management discussion and analysis. The Company does not undertake to update any forward-looking information, except in accordance with applicable securities laws.
Non-IFRS Financial Measures
This news release includes certain forward-looking non-IFRS financial measures and ratios, namely: EBITDA and post-tax free cash flow, C1 Cash Cost per pound of payable copper and AISC per pound of payable copper. These measures and ratios do not have a standardized meaning under International Financial Reporting Standards ("IFRS"), may not be comparable to similar measures or ratios presented by other issuers, and should not be considered in isolation or as a substitute for measures or ratios prepared in accordance with IFRS. The Company believes that these measures and ratios assist investors in evaluating the projected economic performance of the Project and are consistent with measures commonly used in the copper mining industry.
The Company is an exploration-stage issuer and the Project is not in production. Accordingly, the equivalent historical non-IFRS financial measures or ratios and the most directly comparable IFRS financial measures are nil, with no differences in composition.
The non-IFRS financial measures and ratios used in this news release and common to the copper mining industry are defined below:
EBITDA is gross revenue less treatment, refining, freight and marketing charges, royalties and export levies, and site operating costs, before income taxes, depreciation and amortization, and before capital expenditures.
Post-tax free cash flow is EBITDA less income taxes paid and less initial and sustaining capital expenditures.
C1 Cash Cost comprises mining, processing, on-site G&A and general site costs, treatment, refining, freight and marketing charges, less by-product credits for molybdenum and gold. It excludes royalties, export levies, sustaining capital, corporate G&A, exploration, and closure and reclamation costs. Total LOM C1 Cash Cost is US
AISC comprises C1 Cash Cost plus royalties and export levies and sustaining capital, and excludes closure and reclamation costs. Total LOM AISC is US
Management uses these measures to assess the projected operating cost position and cash generating capacity of the Project relative to its peers and to inform development and financing decisions.
The forward-looking non-IFRS financial measures and ratios in this news release are forward-looking information and are based on the assumptions and subject to the risks described under "Cautionary Statement Regarding Forward-Looking Information" and "Cautionary Note for U.S. Investors Concerning Mineral Resources".
Cautionary Note for U.S. Investors Concerning Mineral Resources
NI 43-101 is a rule of the Canadian Securities Administrators which establishes standards for all public disclosure an issuer makes of scientific and technical information concerning mineral projects. Technical disclosure contained in this news release has been prepared in accordance with NI 43-101 and the Canadian Institute of Mining, Metallurgy and Petroleum Classification System. These standards differ from the requirements of the U.S. Securities and Exchange Commission ("SEC") and resource and reserve information contained in this news release may not be comparable to similar information disclosed by domestic United States companies subject to the SEC's reporting and disclosure requirements.

To view the source version of this press release, please visit https://www.newsfilecorp.com/release/324393
FAQ
AI-generated questions and answers. How Rhea-AI works. Not financial advice.