Laser Photonics Reports Q2 2025 Revenue Growth of 317% Year-Over-Year
Rhea-AI Summary
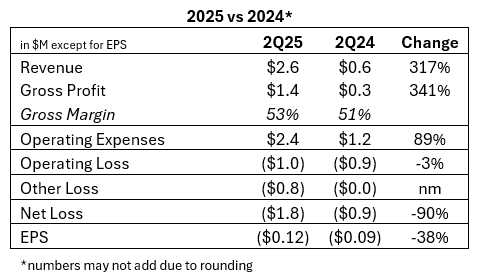
Laser Photonics (NASDAQ:LASE) reported exceptional growth in Q2 2025, with revenue surging 317% to $2.6 million compared to Q2 2024. The company achieved a gross profit increase of 341% to $1.4 million, with improved gross margins of 53.5%.
The growth was driven by strategic acquisitions, including the successful integration of Control Micro Systems (CMS) and the announced acquisition of Beamer Laser Marking Systems, which historically generated $3+ million in annual revenue. The company implemented $2 million in annualized cost reductions during the quarter while securing significant customer wins, including orders from a Fortune 500 appliance manufacturer and the Massachusetts Bay Transportation Authority through W.W. Grainger.
Positive
- Revenue growth of 317% year-over-year to $2.6 million
- Gross profit increased 341% with improved margins of 53.5%
- Strategic acquisition of Beamer Laser Systems adding $3+ million in historical annual revenue
- Implementation of $2 million in annualized cost reductions
- Significant customer wins including Fortune 500 companies
- Expanded distribution network through Beamer's 19 tech centers and 5 demonstration showrooms
Negative
- Reported net loss with $0.8 million in interest expense
- Increased operating expenses from acquired companies
- Integration costs from multiple acquisitions impacting short-term profitability
News Market Reaction – LASE
In the Aug 19 session, LASE gained 59.35%, reflecting a significant positive market reaction. Argus tracked a peak move of +100.2% during that session. Our momentum scanner triggered 41 alerts that day, indicating elevated trading interest and price volatility. Trading volume was exceptionally heavy at 164.1x the daily average, suggesting very strong buying interest.
Data tracked by StockTitan Argus on the day of publication.
AI-generated analysis. How Rhea-AI works. Not financial advice.
Revenue Surges to
Implemented
ORLANDO, FLORIDA / ACCESS Newswire / August 18, 2025 / Laser Photonics Corporation (NASDAQ:LASE), ("LPC"), $LASE, a leading global developer of CleanTech laser systems for laser cleaning and other material applications, today announced results for its second quarter ended June 30, 2025.
Q2 2025 Financial Highlights (versus Q2 2024):
Revenue increased
317% to$2.6 million compared to$0.6 million Gross profit expanded
341% to$1.4 million with gross margins improving to53.5% Successfully implemented plan to reduce
$2 million in annualized expenses during the quarterNet loss included approximately
$0.8 million in interest expense classified under "Other Income (Loss) compared to$0 .
Wayne Tupuola, CEO of Laser Photonics, commented:
"Q2 demonstrated the accelerating momentum of our strategic transformation, with revenue growth exceeding
"Equally important, we delivered on our commitment to operational discipline by implementing
Carlos Sardinas, Chief Financial Officer of Laser Photonics, added:
"Our Q2 financial performance reflects the successful execution of our dual strategy of growth acceleration and operational efficiency. Additionally, this quarter's results included the incremental headcount from the CMS acquisition, which closed in Q4 last year. The
Business Highlights
Strategic Acquisitions & Integration: Building on the successful CMS acquisition completed in Q4 2024, Laser Photonics announced the strategic acquisition of Beamer Laser Marking Systems in June 2025. Beamer's historical performance of
CMS Continued Success: Control Micro Systems secured significant orders from a Fortune 500 home appliance manufacturer and a premier global manufacturing services provider, highlighting the division's expertise in custom-engineered laser marking solutions. These wins demonstrate CMS's proven ability to deliver exceptional value to industry leaders across diverse sectors including precision manufacturing and high-reliability OEM markets.
CleanTech Industrial Expansion: Laser Photonics received an order for its CleanTech Industrial Roughening Laser 3040 (CTIR-3040) through W.W. Grainger for use by the Massachusetts Bay Transportation Authority (MBTA). This strategic win validates the technology's effectiveness in transportation infrastructure applications and strengthens LPC's relationship with Grainger's extensive distribution network serving 4.5 million customers worldwide.
Operational Excellence: The Company successfully implemented
About Laser Photonics Corporation
Laser Photonics is a vertically integrated manufacturer and R&D Center of Excellence for industrial laser technologies and systems. Laser Photonics seeks to disrupt the
Cautionary Note Concerning Forward-Looking Statements
This press release contains "forward-looking statements" (within the meaning of Section 27A of the Securities Act of 1933, as amended, and Section 21E of the Securities Exchange Act of 1934, as amended), including statements regarding the Company's plans, prospects, potential results and use of proceeds. These statements are based on current expectations as of the date of this press release and involve a number of risks and uncertainties, which may cause results and uses of proceeds to differ materially from those indicated by these forward-looking statements. These risks include, without limitation, those described under the caption "Risk Factors" in our Form 10-K for the fiscal year ended December 31, 2024. Any reader of this press release is cautioned not to place undue reliance on these forward-looking statements, which speak only as of the date of this press release. The Company undertakes no obligation to revise or update any forward-looking statements to reflect events or circumstances after the date of this press release except as required by applicable laws or regulations.
Laser Photonics Investor Relations Contact:
Brian Siegel, IRC, MBA
Senior Managing Director
Hayden IR
(346) 396-8696
laser@haydenir.com
CONDENSED CONSOLIDATED BALANCE SHEETS
(in thousands, except par value data)
(unaudited)
As of June 30, 2025 (Unaudited) | As of December 31, 2024 (Audited) | |||||||
Assets | ||||||||
Current Assets: | ||||||||
Cash and Cash Equivalents | $ | 78,522 | $ | 533,871 | ||||
Accounts Receivable, Net | 877,522 | 973,605 | ||||||
Contract Assets | 657,103 | 759,658 | ||||||
Inventory | 1,476,637 | 2,338,759 | ||||||
Other Assets | 256,118 | 58,567 | ||||||
Total Current Assets | 3,345,902 | 4,664,460 | ||||||
Property, Plant, & Equipment, Net | 1,652,952 | 1,872,034 | ||||||
Intangible Assets, Net | 5,138,861 | 5,458,522 | ||||||
Other Long Term Assets | 316,378 | 316,378 | ||||||
Operating Lease Right-of-Use Asset | 4,486,758 | 4,840,753 | ||||||
Total Assets | $ | 14,940,851 | $ | 17,152,147 | ||||
Liabilities & Stockholders' Equity | ||||||||
Current Liabilities: | ||||||||
Accounts Payable | $ | 1,484,062 | $ | 531,268 | ||||
Account payable - affiliates/RP | 126,739 | 27,988 | ||||||
Short term loan | 1,210,923 | - | ||||||
Short term loan - affiliates/ RP | 620,000 | - | ||||||
Deferred Revenue | 319,872 | 55,383 | ||||||
Contract Liabilities | 1,577,417 | 1,042,090 | ||||||
Current Portion of Operating Lease | 440,468 | 649,989 | ||||||
Accrued Expenses | 562,342 | 266,717 | ||||||
Total Current Liabilities | 6,341,823 | 2,573,435 | ||||||
Long Term Liabilities: | ||||||||
Lease liability - less current | 4,262,061 | 4,366,419 | ||||||
Total Long Term Liabilities | 4,262,061 | 4,366,419 | ||||||
Total Liabilities | 10,603,884 | 6,939,854 | ||||||
Stockholders' Equity: | ||||||||
Preferred stock Par value | - | - | ||||||
Common Stock Par Value | 14,276 | 14,257 | ||||||
Additional Paid in Capital | 15,565,439 | 17,886,159 | ||||||
Retained Earnings (Deficit) | (11,208,938 | ) | (7,754,313 | ) | ||||
Shares to be issued | - | 100,000 | ||||||
Treasury Stock | (33,810 | ) | (33,810 | ) | ||||
Total Stockholders' Equity | 4,336,967 | 10,212,293 | ||||||
Total Liabilities & Stockholders' Equity | $ | 14,940,851 | $ | 17,152,147 | ||||
STATEMENTS OF PROFIT AND LOSS
(in thousands, except per share data)
(unaudited)
3 Months Ended | 6 Months Ended | |||||||||||||||
June 30,2025 (Unaudited) | June 30, 2024 (Unaudited) | June 30,2025 (Unaudited) | June 30, 2024 (Unaudited) | |||||||||||||
Net Sales | $ | 2,598,975 | $ | 623,435 | $ | 4,889,257 | $ | 1,366,426 | ||||||||
Cost of Sales | 1,208,871 | 308,081 | 2,359,387 | 665,204 | ||||||||||||
Gross Profit | 1,390,104 | 315,354 | 2,529,870 | 701,222 | ||||||||||||
Operating Expenses: | ||||||||||||||||
Sales & Marketing | 256,635 | 266,282 | 874,334 | 402,891 | ||||||||||||
General & Administrative | 697,265 | 435,776 | 1,597,299 | 792,042 | ||||||||||||
Depreciation & Amortization | 339,123 | 245,894 | 576,134 | 431,210 | ||||||||||||
Payroll Expenses | 928,482 | 238,703 | 1,769,343 | 447,158 | ||||||||||||
Research and Development Cost | 131,287 | 60,232 | 247,973 | 107,923 | ||||||||||||
Total Operating Expenses | 2,352,792 | 1,246,887 | 5,065,083 | 2,181,224 | ||||||||||||
Operating Income (Loss) | (962,688 | ) | (931,533 | ) | (2,535,213 | ) | (1,480,002 | ) | ||||||||
Other Income (Expense): | ||||||||||||||||
Interest Expense | (813,400 | ) | ||||||||||||||
Other Income | 2,186 | |||||||||||||||
Total Other Income (Loss) | (811,214 | ) | (2,723 | ) | (919,412 | ) | 37 | |||||||||
Income (Loss) Before Tax | (1,773,902 | ) | (934,256 | ) | (3,454,625 | ) | (1,479,965 | ) | ||||||||
Tax Provision | - | - | - | - | ||||||||||||
Net Income (Loss) | $ | (1,773,902 | ) | $ | (934,256 | ) | $ | (3,454,625 | ) | $ | (1,479,965 | ) | ||||
Deemed Dividend from Software Acquisition | (6,615,000 | ) | (6,615,000 | ) | ||||||||||||
Net Comprehensive loss attributed to Common Shareholders | (1,773,902 | ) | (7,549,256 | ) | (3,454,625 | ) | (8,094,965 | ) | ||||||||
Earning (Loss) per Share: | ||||||||||||||||
Basic and diluted | $ | (0.12 | ) | $ | (0.09 | ) | $ | (0.24 | ) | $ | (0.15 | ) | ||||
Loss per share (attributable to common shareholders) | (0.12 | ) | (0.71 | ) | (0.24 | ) | (0.82 | ) | ||||||||
Weighted Average of Shares Outstanding | 14,276,150 | 10,589,108 | 14,273,878 | 9,924,908 | ||||||||||||
Statement of Cash Flows
(in thousands)
(unaudited)
2025 (Unaudited) | 2024 (Unaudited) | |||||||
OPERATING ACTIVITIES | ||||||||
Net Loss/Gain | $ | (3,454,625 | ) | $ | (1,479,965 | ) | ||
Adjustments to Reconcile Net Loss to Net Cash Flow from Operating Activities: | ||||||||
Bad Debt | 7,655 | - | ||||||
Debt discount amortization | 71,008 | - | ||||||
Shares issued for compensation | 33,336 | |||||||
Distribution to affiliate | (2,420,701 | ) | (2,198,993 | ) | ||||
Depreciation & Amortization | 576,134 | 431,210 | ||||||
Change in Operating Assets & Liabilities: | ||||||||
Accounts Receivable | 88,429 | 370,348 | ||||||
Contract Assets | 102,555 | - | ||||||
Inventory | 847,289 | 132,034 | ||||||
Prepaids & Other Current Assets | (197,553 | ) | (366,448 | ) | ||||
Net Change, Right-of-Use Asset & Liabilities | 40,118 | - | ||||||
Accounts Payable | 1,051,545 | (24,804 | ) | |||||
Contract Liabilities | 535,327 | - | ||||||
Accrued Expenses | 295,625 | (53,924 | ) | |||||
Deferred Revenue | 264,490 | (96,550 | ) | |||||
Net Cash Used in Operating Activities | (2,192,704 | ) | (3,253,756 | ) | ||||
INVESTING ACTIVITIES | ||||||||
Purchase of Property, Plant an Equipment | - | (12,934 | ) | |||||
Purchase of Research & Development Equipment | (6,900 | ) | (4,095 | ) | ||||
Leasehold Improvements | (15,660 | ) | (182,719 | ) | ||||
Net Cash Used in Investing Activities | (22,560 | ) | (199,748 | ) | ||||
FINANCING ACTIVITIES | ||||||||
IPFS Loan | (29,458 | ) | - | |||||
Borrowings on debt | 2,550,000 | - | ||||||
Borrowings on debt | (1,380,627 | ) | - | |||||
Short term Loan From Affiliate | 620,000 | - | ||||||
Common stock .01 x 100,000,000 | - | (92,533 | ) | |||||
Common stock .001 x 100,000,000 | - | 12,253 | ||||||
Additional Paid in Capital | - | 80,280 | ||||||
Net Cash provided by (used in) Financing Activities | 1,759,915 | - | ||||||
Net Cash Flow for Period | (455,349 | ) | (3,453,504 | ) | ||||
Cash and Cash Equivalents - Beginning of Period | 533,871 | 6,201,137 | ||||||
Cash and Cash Equivalents- End of Period | $ | 78,522 | $ | 2,747,633 | ||||
NON-CASH INVESTING AND FINANCING ACTIVITIES | ||||||||
Shares issued for Investment | 100,000 | - | ||||||
Transfer demo inventory to PPE | 14,833 | - | ||||||
Share issued for purchase of license | - | 6,615,000 | ||||||
SOURCE: Laser Photonics Corp.
View the original press release on ACCESS Newswire