
Mako Mining Reports Q1 2026 Financial Results, Including Adjusted EBITDA(1) of US$40.1 Million and EPS of US$0.26/Share
Mako Mining (NASDAQ:MAKO) reported record Q1 2026 revenue of $68.6 million, Adjusted EBITDA of $40.1 million, Mine OCF of $46.1 million and net income of $23.1 million ($0.26/share).
Rhea-AI Summary
Mako Mining (NASDAQ:MAKO) reported record Q1 2026 revenue of $68.6 million, Adjusted EBITDA of $40.1 million, Mine OCF of $46.1 million and net income of $23.1 million ($0.26/share).
The company sold 13,721 oz of gold at an average realized price of $4,902/oz, with cash costs of $1,843/oz and AISC of $2,275/oz. Cash and trade receivables totaled $96.1 million, with ROE of 36.4% and ROA of 23.5%. Exploration spending reached $2.5 million across San Albino, Eagle Mountain and Mt. Hamilton.
Positive
- Record Q1 2026 revenue of $68.6 million
- Q1 2026 Adjusted EBITDA of $40.1 million
- Q1 2026 Mine Operating Cash Flow of $46.1 million
- Q1 2026 net income of $23.1 million or $0.26/share
- Cash and trade receivables totaling $96.1 million at quarter end
- Return on equity of 36.4% and return on assets of 23.5%
- Q1 2026 exploration and evaluation spending of $2.5 million on growth projects
Negative
- None.
Details
News Market Reaction – MAKO
In the May 15 session, MAKO gained 3.53%, reflecting a moderate positive market reaction.
Data tracked by StockTitan Argus on the day of publication.
Key Figures
- Q1 2026 Revenue
- $68.6M
- Three months ended March 31, 2026
- Q1 2026 Adjusted EBITDA
- $40.1M
- Three months ended March 31, 2026
- Q1 2026 Net Income
- $23.1M
- Three months ended March 31, 2026
- Q1 2026 EPS
- $0.26/share
- Three months ended March 31, 2026
- Cash & Receivables
- $96.1M
- Balance at March 31, 2026
- Cash Cost
- $1,843/oz sold
- Q1 2026 cash cost per ounce sold
- AISC
- $2,275/oz sold
- Q1 2026 all-in sustaining cost
- ROE
- 36.4%
- Trailing twelve months to Q1 2026
Previous Earnings Reports
-
Q4 2025 results with strong revenue, EBITDA, and net income metrics.
24h Move is the share-price change in the day after each event; other market factors may also have contributed.
Key Terms
adjusted ebitda financial
ebitda financial
all-in sustaining cost financial
aisc financial
non-gaap financial measures financial
ifrs regulatory
roe financial
roa financial
AI-generated analysis. How Rhea-AI works. Not financial advice.




VANCOUVER, BC / ACCESS Newswire / May 15, 2026 / Mako Mining Corp. (NASDAQ:MAKO)(TSXV:MKO) ("Mako" or the "Company") is pleased to report financial results for the three months ended March 31, 2026 ("Q1 2026"). All dollar amounts referred to herein are expressed in United States dollars unless otherwise stated.
The Company's financial results for Q1 2026 reflect record revenue of
Q1 2026 Highlights
Financial
$68.6 million in Revenue$40.1 million in Adjusted EBITDA (1)$46.1 million in Mine OCF (1)(3)$23.1 million Net Income$96.1 million in Cash and Trade Receivables$1,843 Cash Cost ($/oz sold) (1)(2)$2,275 AISC ($/oz sold) (1)(2). San Albino$1,661 and Moss Mine$2,977 Return on Equity ("ROE") (1) of
36.4% and Return on Assets ("ROA") of23.5% (1)
Growth
$2.5 million in exploration and evaluation expenses ($1.2 million in areas surrounding San Albino,$1.2 million at Eagle Mountain, Guyana and$0.1 million in Mt. Hamilton)
Akiba Leisman, CEO of Mako, states, "Q1 2026 was a record quarter for production, revenue, and profitability, with net income of
Table 1 - Operating Data San Albino and Moss Mine
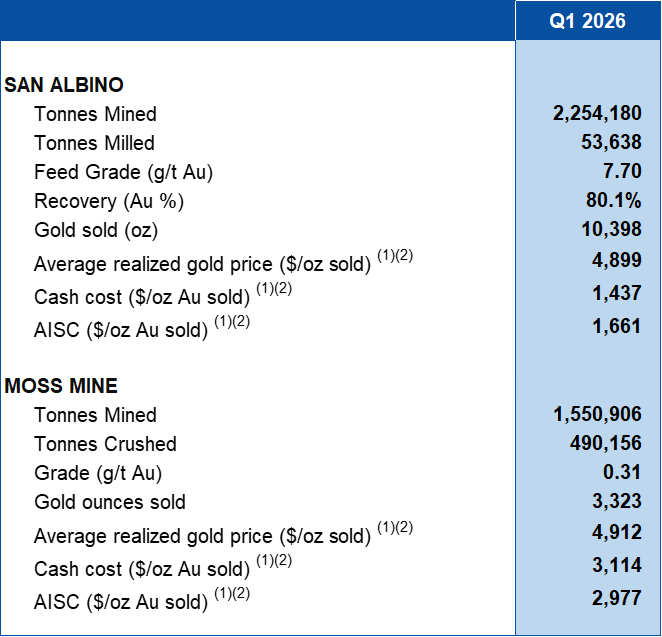
Table 2 - Consolidated Revenue
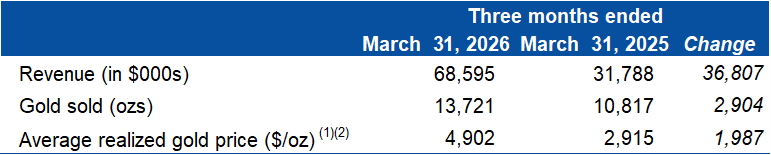
Table 3 - EBITDA(1) Reconciliation
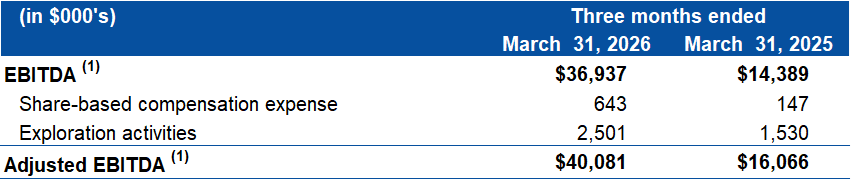
Chart 1
Q1 2026 - Mine OCF(1)()3) Calculation and Cash Reconciliation (in $ million)
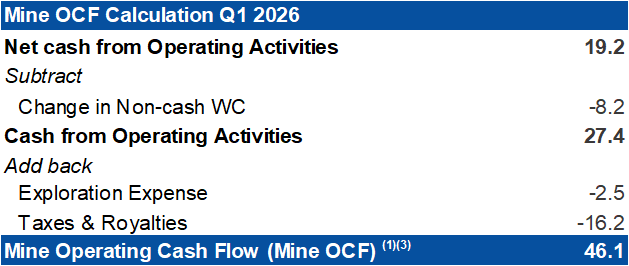
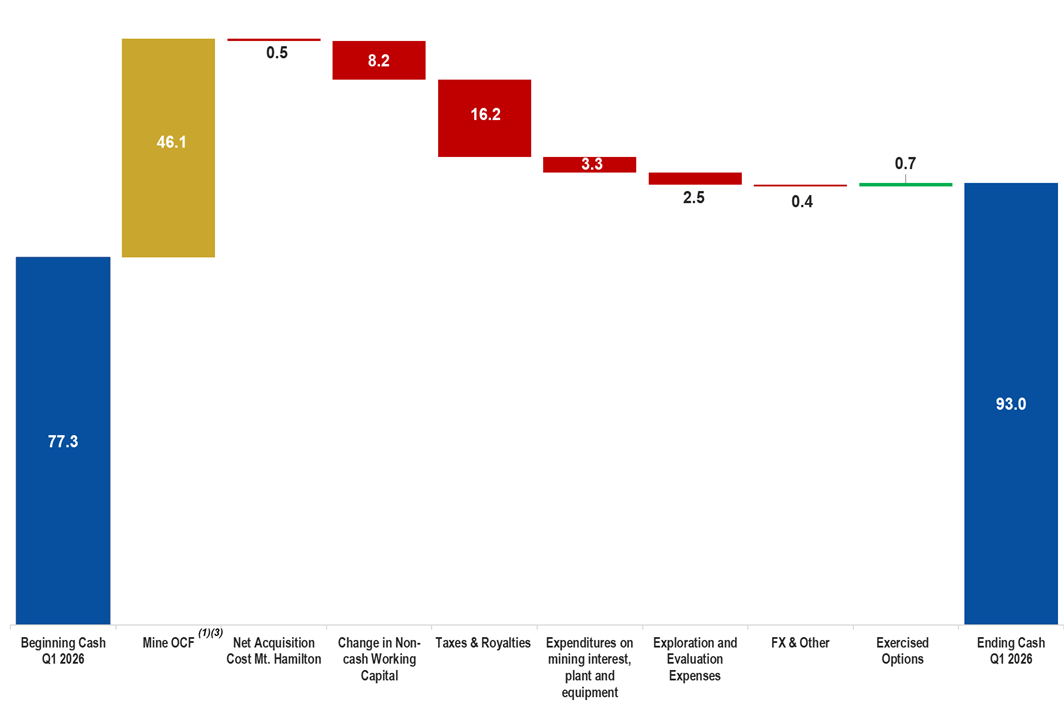
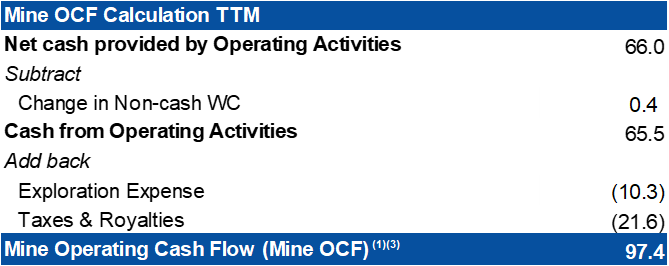
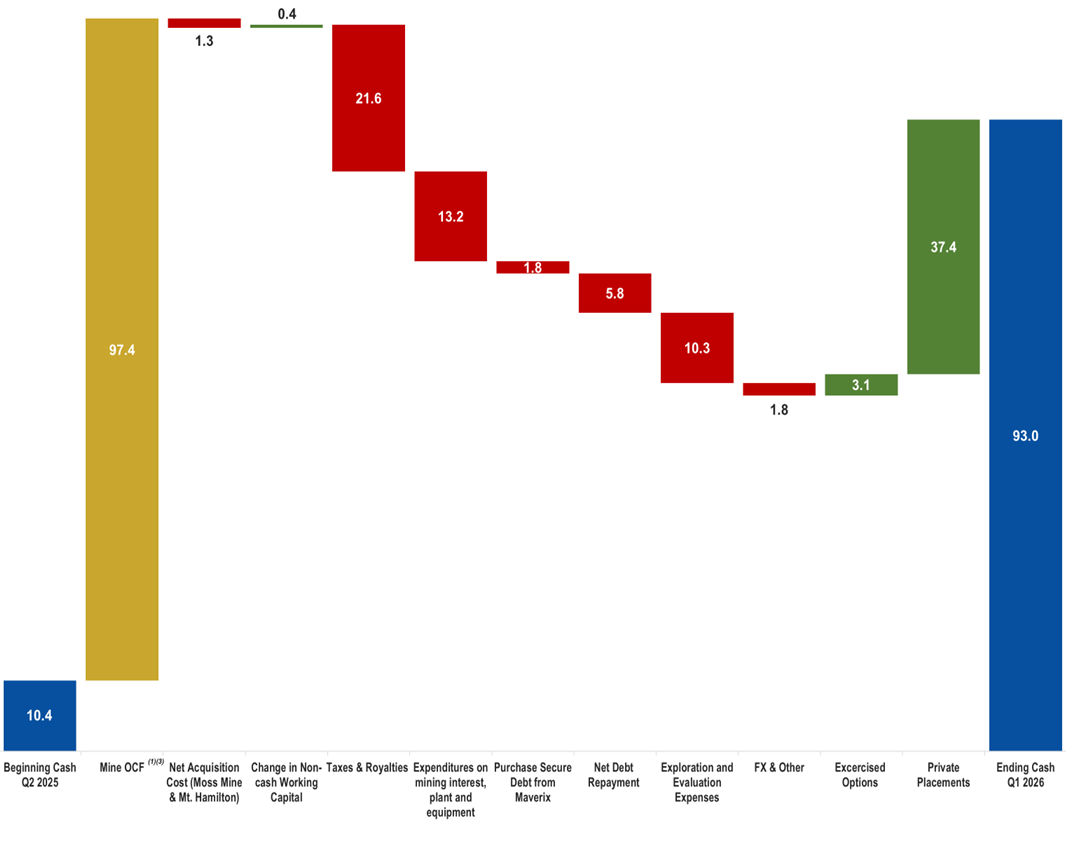
Chart 2
Twelve Trailing Months ("TTM") - Mine OCF(1)(3) Calculation and Cash Reconciliation (in $ million)
End Notes
Refers to a Non-GAAP financial measure within the meaning of National Instrument 52-112 - Non-GAAP and Other Financial Measures Disclosure ("NI 52-112"). Refer to information under the heading "Non-GAAP Measures" as well as the reconciliations in this press release.
Refers to a Non-GAAP ratio within the meaning of NI-52-112. Refer to information under the heading "Non-GAAP Measures" later in this press release.
Refer to "Chart 1 & 2 - Mine OCF Calculation and Cash Reconciliation (in $ millions)" for a reconciliation of the beginning and ending cash position of the Company, including OCF.
For complete details, please refer to the unaudited condensed interim consolidated financial statements and the associated management's discussion and analysis for the three months ended March 31, 2026, available under the Company's profile on SEDAR+ (www.sedarplus.ca), on EDGAR at www.sec.gov or on the Company's website (www.makominingcorp.com).
Non-GAAP Measures
The Company has included certain non-GAAP financial measures and non-GAAP ratios in this press release such as EBITDA, Adjusted EBITDA, Mine OCF, Cash cost per ounce sold, , AISC per ounce sold, ROE, ROA and Average realized gold price per ounce sold. These non-GAAP measures are intended to provide additional information and should not be considered in isolation or as a substitute for measures of performance prepared in accordance with IFRS. In the gold mining industry, these are commonly used performance measures and ratios, but do not have any standardized meaning prescribed under IFRS and therefore may not be comparable to other issuers. The Company believes that, in addition to conventional measures prepared in accordance with IFRS, certain investors use this information to evaluate the Company's underlying performance of its core operations and its ability to generate cash flow.
"EBITDA" represents earnings before interest (including non-cash accretion of financial obligation and lease obligations), income taxes and depreciation, depletion and amortization.
"Adjusted EBITDA" represents EBITDA, adjusted to exclude exploration activities, share-based compensation and change in provision for reclamation and rehabilitation.
"Cash cost per ounce sold" is production costs divided by the number of gold ounces sold.
"AISC per ounce sold" includes cash costs (as defined above) and adds the sum of G&A, sustaining capital and certain exploration and evaluation ("E&E") costs, sustaining lease payments, provision for environmental fees, if applicable, and rehabilitation costs paid, all divided by the number of ounces sold. As this measure seeks to reflect the full cost of gold production from current operations, capital and E&E costs related to expansion or growth projects are not included in the calculation of AISC per ounce sold. Additionally, certain other cash expenditures, including income and other tax payments, financing costs and debt repayments, are not included in AISC per ounce sold.
"Mine OCF" represents operating cash flow, excluding taxes and royalties, changes in non-cash working capital and exploration expense.
"ROE" is calculated by dividing the twelve trailing months Net Income by the average shareholder's equity. The average shareholder's equity is calculated by adding the total equity at the end of the period to the total equity at the beginning of the period and dividing by two.
"ROA" is calculated by dividing the twelve trailing months Net Income by the average total assets. The average total assets is calculated by adding the total assets at the end of the period to the total assets at the beginning of the period and dividing by two.
"Average realized gold price per ounce sold" is calculated by dividing total gold revenue by the total gold ounces sold into the spot market.
On behalf of the Board,
Akiba Leisman
Chief Executive Officer
About Mako
Mako Mining Corp. is a publicly listed gold mining, development and exploration company. The Company operates the high-grade San Albino gold mine in Nueva Segovia, Nicaragua, which ranks as one of the highest-grade open pit gold mines globally and offers district-scale exploration potential. Mako also owns two assets in the U.S.: the Moss Mine in Arizona, an open pit gold mine in northwestern Arizona and the Mt. Hamilton Project, a permitted heap leach project in Nevada. Mako also holds a
For further information: Mako Mining Corp., Akiba Leisman, Chief Executive Officer, Telephone: 917-558-5289, E-mail: aleisman@makominingcorp.com or visit our website at www.makominingcorp.com and SEDAR www.sedar.ca.
Cautionary Statement Regarding Forward-Looking Information
Statements contained herein, other than historical fact, may be considered "forward-looking information" or "forward-looking statements" (collectively, "forward-looking information") within the meaning of applicable securities laws. Except for statements of historical fact relating to the Company, information contained herein constitutes forward-looking information, including, but not limited to, any information as to the Company's strategy, objectives, plans or future financial or operating performance. Forward-looking statements are characterized by words such as "plan", "expect", "budget", "target", "project", "intend", "believe", "anticipate", "estimate" and other similar words or negative versions thereof, or statements that certain events or conditions "may", "will", "should", "would" or "could" occur. In particular, forward-looking information included in this press release includes, without limitation, statements with respect to:
Eagle Mountain and Mt. Hamilton expected to meaningfully boost profitability over the next few years;
the Company's focus over the next few quarters on lowering our cost of capital to accelerate our accretive growth trajectory;
and
Forward-looking information is based on the opinions, assumptions and estimates of management considered reasonable on the date the statements are made, and is inherently subject to a variety of risks and uncertainties and other known and unknown factors that could cause actual events or results to differ materially from those projected in the forward-looking information. These factors include the Company's dependence on products produced from its key mining assets; fluctuating price of gold; risks relating to the exploration, development and operation of mineral properties, including but not limited to adverse environmental and climatic conditions, unusual and unexpected geologic conditions and equipment failures; risks relating to operating in emerging markets, particularly Nicaragua and South America, including risk of government expropriation or nationalization of mining operations; health, safety and environmental risks and hazards to which the Company's operations are subject; the Company's ability to maintain or increase present level of gold production; access to financing; cost and availability of commodities; increases in costs of production, such as fuel, steel, power, labor and other consumables; risks associated with infectious diseases; uncertainty in the estimation of mineral resources; the Company's ability to replace and expand mineral resources at its mines; factors that may affect the Company's future production estimates, including but not limited to the quality of ore, production costs, infrastructure and availability of workforce and equipment; risks relating to partial ownerships and/or joint ventures at the Company's operations; reliance on the Company's existing infrastructure and supply chains at the Company's operating mines; risks relating to the acquisition, holding and renewal of title to mining rights and permits, and changes to the mining legislative and regulatory regimes in the Company's operating jurisdictions; limitations on insurance coverage; risks relating to illegal and artisanal mining; the Company's compliance with anti-corruption laws; risks relating to the development, construction and start-up of new mines, including but not limited to the availability and performance of contractors and suppliers, the receipt of required governmental approvals and permits, and cost overruns; risks relating to acquisitions and divestures; title disputes or claims; risks relating to the termination of mining rights; risks relating to security and human rights; risks associated with processing and metallurgical recoveries; risks related to enforcing legal rights in foreign jurisdictions; competition in the precious metals mining industry; fluctuating currency exchange rates (including the US Dollar, Nicaraguan cordoba and Guyanese dollar exchange rates); the values of assets and liabilities based on projected future conditions and potential impairment charges; timing and possible outcome of pending and outstanding litigation and any labor disputes; taxation risks; scrutiny from non-governmental organizations; labor and employment relations; risks related to third-party contractor arrangements; repatriation of funds from foreign subsidiaries; community relations; risks related to relying on local advisors and consultants in foreign jurisdictions; the impact of global financial, economic and political conditions, global liquidity, interest rates, inflation and other factors on the Company's results of operations and market price of common shares; risks associated with financial projections; force majeure events; transactions that may result in dilution to common shares; future sales of common shares by existing shareholders; the Company's dependence on key management personnel and executives; possible conflicts of interest of directors and officers of the Company; the reliability of the Company's disclosure and internal controls; compliance with international ESG disclosure standards and best practices; vulnerability of information systems including cyber-attacks; as well as those risk factors discussed or referred to in the Company's annual information form and management's discussion and analysis and other public disclosure available under the Company's profile at www.sedarplus.ca, and on EDGAR at www.sec.gov.
Although the Company has attempted to identify important factors that could cause actual actions, events or results to differ materially from those described in forward-looking information, there may be other factors that could cause actions, events or results to not be as anticipated, estimated or intended. There can be no assurance that forward-looking information will prove to be accurate, as actual results and future events could differ materially from those anticipated in such statements. The Company undertakes no obligation to update forward-looking information if circumstances or management's estimates, assumptions or opinions should change, except as required by applicable law. The reader is cautioned not to place undue reliance on forward-looking information. The forward-looking information contained herein is presented for the purpose of assisting investors in understanding the Company's expected financial and operational performance and results as at and for the periods ended on the dates presented in the Company's plans and objectives and may not be appropriate for other purposes.
CAUTIONARY NOTE TO U.S. INVESTORS REGARDING MINERAL RESERVE AND MINERAL RESOURCE ESTIMATES
NI 43-101 is a rule of the Canadian Securities Administrators which establishes standards for all public disclosure an issuer makes of scientific and technical information concerning mineral projects. Technical disclosure contained in this news release has been prepared in accordance with NI 43-101 and the Canadian Institute of Mining, Metallurgy and Petroleum Classification System. These standards differ from the requirements of the U.S. Securities and Exchange Commission ("SEC") and resource information contained in this news release may not be comparable to similar information disclosed by domestic United States companies subject to the SEC's reporting and disclosure requirements.
Neither the TSX Venture Exchange nor its Regulation Services Provider (as that term is defined in the policies of the TSX Venture Exchange) accepts responsibility for the adequacy or accuracy of this release.
SOURCE: Mako Mining Corp.
View the original press release on ACCESS Newswire