
America's Most Dangerous Driving Window Starts at 3pm - and Gets Worse an Hour Later
Mercury Insurance (NYSE:MCY) analyzed five years of auto claims to identify the most dangerous driving windows.
Rhea-AI Summary
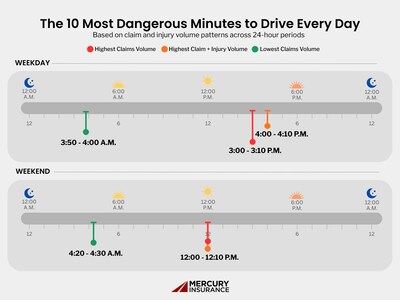
Mercury Insurance (NYSE:MCY) analyzed five years of auto claims to identify the most dangerous driving windows. Weekday crash volume peaks from 3:00–3:10 p.m., while the highest injury rates occur from 4:00–4:10 p.m. as speeds rise. Weekends shift both crash and injury peaks to around 12:00–12:10 p.m., and pedestrian injury rates often exceed 60%, reaching 80% in some cases.
Positive
- None.
Negative
- None.
Details
News Market Reaction – MCY
On May 19, the day this news came out, MCY closed 0.79% above the previous close.
Data tracked by StockTitan Argus for the May 19 session.
Key Figures
- Crash window weekday
- 3:00–3:10 p.m.
- Highest crash volume of the weekday
- Injury window weekday
- 4:00–4:10 p.m.
- Highest injury rate despite fewer crashes
- Weekday crashes involved
- Over 61,000 people
- Five-year period during busiest 10-minute weekday window
- Weekend crashes involved
- Approximately 19,000 people
- Five-year period during 12:00–12:10 p.m. weekend window
- Weekend injury rate
- About 9%
- Share of people sustaining injuries in weekend peak window
- General injury rate
- 9%–12%
- Typical injury rate for drivers and passengers throughout day
- Pedestrian injury rate
- Frequently 60%+
- Injury rates for pedestrians, sometimes reaching 80%+
- Analysis period
- Five years
- Claims data window used for crash and injury analysis
Historical Context
-
Guidance on strengthening wildfire evacuation plans and overlooked items.
-
Investment in BurnBot to advance wildfire mitigation and insurance availability.
-
Partnership with Olympus Insurance to expand auto-home bundling in Florida.
-
Education on evolving defensible space as embers drive home ignitions.
-
Return to profitability, improved combined ratio, and dividend declaration.
24h Move is the share-price change in the day after each event; other market factors may also have contributed.
AI-generated analysis. How Rhea-AI works. Not financial advice.




Mercury Insurance's analysis of five years of claims data found crash volume peaks at 3pm, but serious injuries rise later as traffic speeds increase
While crash volume peaks between 3:00 and 3:10pm, the risk of injury rises even higher about an hour later, between 4:00 and 4:10pm., when traffic begins moving faster and collisions become more severe. Over a five-year period, more than 61,000 people were involved in crashes during the busiest 10-minute weekday window alone.
"Rush hour doesn't play out the same way from start to finish, and that shows up clearly in the claims data," said Heather Paull, Manager, Divisional Claims at Mercury Insurance. "Earlier in the afternoon, there's more congestion with school pick-ups and people getting on the road, so you see more low-speed, stop-and-go incidents. As the drive goes on, traffic starts to move more freely, and drivers tend to pick up speed or get a little less attentive. That's when the crashes we see tend to be more serious."
The commute changes – and so does the risk.
The data points to a consistent weekday pattern driven by school schedules and work commutes:
- 3:00 to 3:10 p.m. marks the highest crash volume of the day
- 4:00 to 4:10 p.m. marks the highest injury rate, despite fewer crashes
- Crash volume concentrates between 3:00 and 4:00 p.m.
- Injury severity increases between 4:00 and 5:00 p.m.
Weekends shift the risk earlier
On weekends, both crash volume and injury risk shift earlier, peaking around 12:00 to 12:10 p.m. as midday errands and leisure travel replace structured commutes.
During this window, approximately 19,000 people were involved in crashes, with about 9 percent sustaining injuries. While slightly lower than weekday peaks, the concentration of activity still creates a clear midday risk spike.
More crashes doesn't always mean more danger
For drivers and passengers, injury rates remain relatively consistent throughout the day, generally ranging from 9 to 12 percent. Time of day primarily affects exposure, not the likelihood of injury in a single crash.
Pedestrians face a different level of risk:
- Injury rates frequently exceed 60 percent and can reach 80 percent or higher
- Risk is highest during lunchtime, commutes, and mid-afternoon hours
- Even lower-volume incidents often result in serious outcomes
A consistent pattern across regions
Across major urban and commuter-heavy areas, the same pattern emerges. Crash volume peaks around 3:00 p.m., followed by higher injury severity in the 4:00 to 5:00 p.m. window.
Some regions see heavier crash volume around noon but still experience more severe injuries later in the afternoon, likely driven by higher speeds and fatigue.
The pattern repeats almost every day
Crash risk is not random. It follows a consistent daily rhythm:
- Weekdays are driven by school pick-up and the transition into the evening commute
- Weekends are shaped by midday travel and condensed activity windows
- Injury severity lags behind peak traffic volume
"Drivers often assume the risk stays the same throughout the commute, but the data shows the road environment changes hour by hour," added Paull. Around 3 to 4 p.m., it comes down to patience, keeping space, and avoiding distractions. Later in the commute, keeping your speed in check and staying alert becomes more important as traffic starts moving faster. Knowing that shift is coming can help drivers stay more intentional behind the wheel and make better decisions in the moment."
Mercury Insurance encourages drivers to treat the afternoon commute as a changing risk environment by reducing distractions, maintaining safe following distances, and adjusting driving behavior as traffic patterns evolve throughout the day.
For more information about driver safety, visit the Mercury Insurance Blog.
About Mercury Insurance
Mercury Insurance (NYSE: MCY) is a multiple-line insurance carrier predominantly offering personal auto, homeowners, renters and commercial insurance through a network of independent agents in
Since 1962, Mercury has provided customers with tremendous value for their insurance dollar by pairing ultra-competitive rates with excellent customer service, through more than 4,200 employees and a network of more than 6,340 independent agents in 11 states. Mercury has earned an "A" rating from A.M. Best, as well as "Best Auto Insurance Company" designations from Forbes and Insure.com. For more information visit www.MercuryInsurance.com or follow the company on LinkedIn, Instagram or Facebook.
Media interested in receiving updates from Mercury can learn more at the Mercury Newsroom.

 View original content to download multimedia:https://www.prnewswire.com/news-releases/americas-most-dangerous-driving-window-starts-at-3pm--and-gets-worse-an-hour-later-302776116.html
SOURCE Mercury Insurance
FAQ
AI-generated questions and answers. How Rhea-AI works. Not financial advice.