Metals Acquisition Limited Announces June 2024 Quarterly Report
Record Quarterly Production and Cash Flow Generation1
ST. HELIER, Jersey--(BUSINESS WIRE)-- Metals Acquisition Limited (NYSE: MTAL; ASX:MAC)
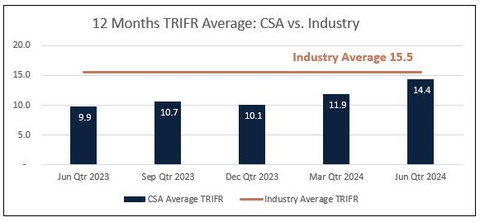
Figure 1 - CSA Copper Mine Recordable Injuries by Quarter (Graphic: Business Wire)
Metals Acquisition Limited ARBN 671 963 198 (NYSE: MTAL; ASX: MAC), a private limited company incorporated under the laws of Jersey, Channel Islands (“MAC” or the “Company”) is pleased to release its June 2024 quarterly activities report (“Q2 2024” or “June quarter”).
HIGHLIGHTS
TRIFR of 14.4 an increase quarter on quarter with remediation strategies implemented, zero recordable injuries in the month of June.
Record quarterly copper production under MAC ownership
-
Record copper production under MAC of 10,864 tonnes up ~
24% quarter on quarter, with record copper production month in June of 5,378 tonnes - Record daily production under MAC of 265 tonnes – highest daily production since 2021
- The record quarter achieved despite a major planned maintenance shutdown in April, with 1,583 tonnes produced for the month, and a combined 9,281 tonnes of copper produced over May and June
-
Copper grade of
4.2% for the quarter, a ~20% increase from the prior quarter as the mine plan shifted to higher grade stopes and dilution control was improved -
C1 of
US /lb2 and Total Cash Costs of$1.92 US /lb3 improved by ~$2.62 11% and ~17% respectively compared to the March quarter, driven by improved production resulting from grade, operational efficiencies and consistency improvements - Copper production for 2024 tracking to mid-point of guidance with no change to 2025 and 2026 guidance
Generating material free cash flow
-
Operational free cash flow of
~US 4 for the quarter with an average realised Copper sales price of$21 million US /lb5 (Q2 Copper spot average at$4.41 US /lb)$4.42 -
Cash and cash equivalents increased by ~
25% toUS after pre-sales of$88.6 million US , payment of a one-off Stamp Duty payment of$37.4 million US , repayment of$23.2 million US in senior debt principal, a$7.9 million ~US investment in Polymetals Limited (“POL”) and$1.8 million US of exploration expenditure$2.1 million -
MAC also has
US of outstanding Quotational Period receipts and$2.8 million US of unsold concentrate as at 30 June 20246, with the June quarter resulting in a strong build in cash and available liquidity$20.7 million -
Generated unaudited preliminary revenue of
~US (excluding pre-sales of$78 million US ), an increase of$37.4 million 18% quarter on quarter
Strategic investment and simplification of capital structure
-
MAC made a strategic investment in POL with an initial
A invested for a$2.5m 4.31% interest in POL, which also provides for access to water rights and Zinc processing capacity - Simplification of the capital structure with the completion of the Private and Public warrant redemption process as announced on 10 June 2024
Production and cost summary
Table 1 – Production and cost summary (unaudited)
Units |
Q4 2023 |
Q1 2024 |
Q2 2024 |
QoQ Change (%) |
H1 2024 |
|
Copper Production |
Tonnes |
9,832 |
8,786 |
10,864 |
|
19,650 |
Sustaining capital |
US$ million |
|
|
|
( |
|
Cash cost (C1)7 |
US$/lb |
|
|
|
( |
|
Total cash cost8 |
US$/lb |
|
|
|
( |
|
Group Net Debt9 |
US$ million |
|
|
|
( |
|
Metals Acquisition Limited’s CEO, Mick McMullen, said:
“Our operations performed to a record level under MAC’s ownership and in line with our mine plan during the June quarter, reaching a record level of production of 10,864 tonnes of copper with around
The production trend in the quarter was for sequentially stronger production each month coming out of the planned mill shutdown in April. Higher grade stopes at the CSA Copper Mine form a large proportion of our annual production and played a key role during the quarter, with milled copper grade improving by around
Our CSA Copper Mine operational team delivered as per the new 2023 mine plan, and as the quarter progressed went from strength to strength in delivering consistent production whilst significantly improving safety performance. Overall, our TRIFR remains above where we would like it but the site team had zero recordable injuries in the month of June, coupled with record production and cost performance.
We again ended the quarter with a large broken ore stockpile of high-grade ore which will underpin production over the upcoming quarter. Based on the reserve plan, we expect copper production to now stabilise over the remaining quarters of the year.
The further benefit of the record production is the fact that our unaudited preliminary revenue (excluding the
This is an incredibly strong result when considered in the context of the bulk of the production and cash flow coming from the last two months of the quarter alone.
We have already put the additional liquidity to good use in reducing our overall interest-bearing liabilities by approximately
As part of the ongoing turnaround and optimisation at the CSA Copper Mine, we announced in Q2 2024 the new Reserve and Resource Statement, which is a snapshot in time based on information available back in August 2023. As reported earlier in the quarter, the new 2023 Reserves and Resources Statement shows a substantial increase of
The operational performance and the resource upgrade support our belief that the CSA Copper Mine is a high-quality, free cash flow generating, long life copper asset. The performance of the site team in the June quarter has showcased just what this mine can do when operations perform the way we know it can, and the Board and I would like to express our thanks to the entire team for the strong performance.
Finally, to reconfirm our disciplined M&A strategy, we will continue to evaluate prospects for growth to enhance shareholder value.”
ESG
Safety
The TRIFR for the CSA Copper Mine increased from an average of 11.9 in Q1 2024 to 14.4 in Q2 2024. This is below the NSW underground metalliferous TRIFR average for 2022 of 15.5. Q2 2024 has not been favourable for safety performance with two contractor LTI’s, three MTI’s and one RWI recorded for the period. June improved with no recordable injuries, showing a strong improvement from prior months. Plans are in place to implement strategies to remediate the increase in TRIFR through increased awareness via extensive training and coaching, as well as increased safety presence on site.
Figure 1 - CSA Copper Mine Recordable Injuries by Quarter
Regulatory
The CSA Mine Rehabilitation Objectives Statement, Final Landform and Rehabilitation Plan, the Annual Rehabilitation Report and the CSA Mine Forward Program have all been approved by the NSW Resources Regulator. Scoping is currently underway for alternate energy providers for a mix of both wind and solar, to potentially secure long term energy security, pricing and reductions in greenhouse gas emissions.
The STSF Stage 9 buttress bulk earthworks are now complete. Geochemical testing is being completed for Stage 10 material, with the tendering process under way.
Operations
Table 2 - Quarterly Operational Performance of the CSA Copper Mine (unaudited)
CSA Copper Mine Metrics (unaudited) |
Units |
Q4 2023 |
Q1 2024 |
Q2 2024 |
QoQ % variance |
H1 2024 |
U/g development - Capital |
Metres |
841 |
466 |
449 |
( |
915 |
U/g development - Operating |
Metres |
448 |
703 |
611 |
( |
1,313 |
Rehab |
Metres |
153 |
246 |
113 |
( |
360 |
Total development |
Metres |
1,441 |
1,415 |
1,173 |
( |
2,588 |
Ore Mined |
Tonnes |
268,685 |
256,031 |
271,469 |
|
527,500 |
Tonnes Milled |
Tonnes |
266,105 |
260,297 |
266,936 |
|
527,233 |
Copper grade milled |
% |
|
|
|
|
|
Copper Recovery |
% |
|
|
|
|
|
Copper Produced |
Tonnes |
9,832 |
8,786 |
10,864 |
|
19,650 |
Silver Produced |
Ounces |
114,969 |
102,182 |
134,701 |
|
236,883 |
Copper Sold |
Tonnes |
10,812 |
8,039 |
8,048 |
|
16,087 |
Achieved Copper price10 |
US$/lb |
3.85 |
3.87 |
4.41 |
|
4.14 |
Mining Cost |
US$/t Mined |
|
|
|
( |
|
Processing Cost |
US$/t Milled |
|
|
|
|
|
G+A Cost |
US$/t Milled |
|
|
|
( |
|
Total Operating Cost |
US$/t |
|
|
|
( |
|
Development Cost |
US$/metre |
|
|
|
( |
|
Sustaining Capital11 |
US$ million |
|
|
|
( |
|
Tonnes Milled per employee |
t/employee |
189 |
184 |
186 |
|
185 |
Mining |
US$/lb prod |
0.94 |
1.27 |
1.04 |
( |
1.14 |
Processing |
US$/lb prod |
0.31 |
0.35 |
0.36 |
|
0.35 |
General and Admin |
US$/lb prod |
0.36 |
0.44 |
0.28 |
( |
0.36 |
Treatment and refining |
US$/lb prod |
0.36 |
0.17 |
0.17 |
|
0.17 |
Work in Progress inventory |
US$/lb prod |
(0.01) |
(0.14) |
0.03 |
( |
(0.04) |
Freight and other costs |
US$/lb prod |
0.17 |
0.17 |
0.14 |
( |
0.15 |
Silver Credits |
US$/lb prod |
(0.14) |
(0.10) |
(0.11) |
|
(0.11) |
C1 Cash Cost |
US$/lb prod |
1.99 |
2.15 |
1.92 |
( |
2.02 |
Leases |
US$/lb prod |
0.07 |
0.08 |
0.07 |
( |
0.07 |
Inventory WIP |
US$/lb prod |
0.01 |
0.14 |
(0.03) |
( |
0.04 |
Royalties |
US$/lb prod |
0.20 |
0.13 |
0.13 |
|
0.13 |
Sustaining capital |
US$/lb prod |
0.46 |
0.67 |
0.53 |
( |
0.59 |
Total Cash Cost |
US$/lb prod |
2.73 |
3.17 |
2.62 |
( |
2.86 |
Total Revenue |
US$ millions |
88.3 |
66.0 |
78.0 |
|
144.1 |
Unless stated otherwise all references to dollar or $ are in USD.
The June quarter was affected by a planned major shut of mill operations in April 2024, which was offset by a ramp up in production over May and June resulting in comparable tonnes milled from Q4 2023 to Q2 2024. Production further benefited from an increased grade of
Double lift extraction sequence was completed on two stopes in Q2 that performed better than expected, resulting in less mining dilution achieved with stronger grades and less total ore tonnes for the same metal. This has been critical to the H1 strategy and will be implemented across future stopes in Q3. Ventilation system upgrades continued to be scoped in Q3 to access future stopes. Increased paste was placed in June meaning the mine is well placed for production into July.
Figure 2 - CSA Copper Mine Quarterly Copper Production (tonnes)
The average received copper price before hedge settlements was higher when comparing to the prior period with the June quarter at
In addition, the Australian dollar exchange rate was broadly flat compared to the prior quarter.
C1 cash costs decreased by ~
This is an incredibly strong result given the low production in April due to the planned mill shutdown with C1 for May and June during normal operations at
Figure 3 - CSA Copper Mine C1 Cash Costs13 - US$/lb produced
MAC management will continue to implement additional productivity measures to further reduce C1 costs.
Figure 4 provides an illustration of tonnes milled per employee, which remains relatively stable quarter on quarter despite the shut in April 2024.
Figure 4 - CSA Mine Tonnes Milled per Employee
Figure 5 - CSA Mine Mining Unit Rate US$/t
Apart from copper production, the largest driver of C1 costs is the mining unit rate as mining accounts for approximately
Mining unit rates were broadly in line with the prior quarter with similar capital development metres achieved. Lower capital development performance in Q1 and Q2 resulted in a lower portion of costs able to be capitalised in those quarters, and hence contributed to the increase in the mining costs when compared to Q3 and Q4 2023.
Figure 6 - CSA Copper Mine Mining Development Costs
Figure 7 - CSA Copper Capital Development metres
Figures 8 and 9 shows the unit rates for processing and site G&A for the year.
Processing costs per tonne milled increased in the June quarter given the 10-day full plant shutdown in April. Work was completed on schedule and budget with no significant incidents recorded.
G&A unit rates decreased during the current quarter after reallocation of stock consumables to mining and processing previously allocated to G&A.
Figure 8 - CSA Copper Mine Processing Unit Rate US$/t
Figure 9 - CSA Copper Mine Site G+A Unit Rate US$/t
As seen in Figure 10, capital spend (including capitalized development) decreased slightly over the quarter, largely driven by work on the TSF embankment, diamond drilling and plant related works as part of the mill shutdown, with the latter adding an additional
Figure 10 - CSA Copper Mine Sustaining Capital Expenditure
Rail delays due to coal protest action in the NSW Hunter Valley meant that ~24kt of copper concentrate remained at site and at port at quarter end, of which ~18kt of concentrate was pre-sold during the quarter.
Cash position, liquidity and debt facilities
The Company’s unaudited cash holding at the end of Q2 2024 was
The unaudited cash position is after taking into account the one-off payment of Stamp Duty to the
As of 30 June 2024, the Company had
Figure 11 - Q2 2024 Cash flow waterfall (US$M)
Mine Plan, Resource and Reserve
As previously reported, on 23 April 2024 we announced the release of the new 2023 Reserves and Resources Statement (“R+R”). The effective date for the R+R was 31 August 2023 and as such, any new information received after that time has not been incorporated into the R+R at this stage.
Acquisition of additional
At the time MAC acquired CMPL from Glencore in 2023, CMPL held an interest (
The Mt Hope Joint Venture CMPL (
The agreement provided that, subject to satisfaction of customary condition precedent, CMPL was to pay
Exploration
During the quarter,
During the quarter, MAC continued the resource development and exploration diamond drilling surrounding the upper Lead-Zinc (“Pb-Zn”) mineralisation of the Eastern and Western Systems, for a total of 1,665m. We are awaiting results and anticipate releasing them shortly but confirmed the presence of in situ, high-grade Pb-Zn material in the upper portions of the mine, within less than 40m of existing development.
Late in the quarter, extensional and infill diamond drilling also recommenced at the shallow, high-grade QTSSU-A resource and ongoing at quarter-end, with results expected to be released when data is finalised.
Exploratory diamond drilling also continued on CML5 for a total of 1,779m during the quarter. The initial drilling has intersected areas of structural complexity and base-metal geochemical anomalism indicating the potential for buried base-metal mineralisation. Preliminary interpretation of the 2024 fixed-loop electromagnetic geophysical survey data shows late-time anomalies, suggestive of deeply buried conductive material, in proximity to and along trend of the drilling at the Cherry prospect.
Warrant redemption
On 6 May 2024, MAC announced that it would redeem all public and private placement warrants that remained outstanding at 5:00 p.m.
1,026 Warrants were exercised at an exercise price of
Three Year Production Guidance
The copper production guidance provided to the market covering 2024, 2025 and 2026 remains unchanged:
Table 3 - CSA Copper Mine Production Guidance
Year |
2024 |
2025 |
2026 |
|||
|
Low |
High |
Low |
High |
Low |
High |
Copper Production (t) |
38,000 |
43,000 |
43,000 |
48,000 |
48,000 |
53,000 |
This 3-year production guidance is based primarily on Ore Reserves but also on measured and indicated Mineral Resources (as at 31 August 2023) and, given that all the deposits are open and a large drill program is underway, we consider it likely that there will be changes over the relevant period as the Company’s overall plan to continue operational and production improvement continues to develop.
Changes to Board of Directors
Appointment of Ms Leanne Heywood
As announced on the 1 May 2024, Ms Leanne Heywood has been appointed as a Non-Executive Director of the Company’s Board of Directors, effective 1 May 2024. Ms Heywood is an experienced non-executive director with broad general management experience gained through an international career in the mining sector, including 10 years with the Rio Tinto Copper Group.
Appointment of Ms Anne Templeman-Jones
As announced on 22 July 2024, Ms Templeman-Jones has been appointed as a Non-Executive Director of the Company’s Board of Directors, effective 22 July 2024. Ms Templeman-Jones, is an accomplished listed company director with substantial financial, operational risk, regulatory, governance and strategy experience from a number of industries, including banking and finance, engineering services in the energy sector, consumer goods and manufacturing.
In addition to Metals Acquisition Limited, Ms Templeman-Jones currently serves as a Non-Executive Director, and has been responsible for a diverse range of committee chairs and memberships for Commonwealth Bank of Australia (Director since March 2018) and Trifork Ag (Director since April 2021). From November 2017 until 1 July 2024, Ms Templeman-Jones was a director of Worley Limited.
Change of Glencore Nominee Director
Also announced on 22 July 2024, are changes to the Glencore Nominee Director where Mr Mohit Rungta will replace Mr Matt Rowlinson and Mr John Burton as Glencore’s nominee Director to the Company’s Board of Directors. Glencore is entitled to nominate one Director for every
Hedging
Revenue significantly leveraged to spot copper prices with over ~
During the quarter, the Company delivered 3,105 tonnes of copper into the hedge book at an average price of
Table 4 – Hedge position
|
Copper |
|||
|
2024 |
2025 |
2026 |
Total |
Future Sales (t) |
6,210 |
12,420 |
5,175 |
23,805 |
Future Sales ($/t) |
3.72 |
3.72 |
3.72 |
3.72 |
Conference Call
The Company will host a conference call and webcast to discuss the Company’s second quarter 2024 results on Monday, July 22, 2024 at 7:00 pm (
Details for the conference call and webcast are included below.
Webcast
Participants can access the webcast at the following link https://event.choruscall.com/mediaframe/webcast.html?webcastid=Odl1UuhQ.
Conference Call
Participants can dial into the live call by dialing one of the numbers below and request the operator connect to the Metals Acquisition Limited call.
Toll Free Dial In: |
|
|
+1-844-763-8274 |
International Dial In: |
|
|
+1-647-484-8814 |
|
|
|
+61-3-8592-6289 |
Replay
The conference call will be available for playback until October 20, 2024, and can be accessed by dialing:
US Toll Free: |
|
+1-877-344-7529 |
International Toll Free: |
|
+1-412-317-0088 |
-ENDS-
This report is authorised for release by the Board of Directors.
About Metals Acquisition Limited
Metals Acquisition Limited (NYSE: MTAL; ASX: MAC) is a company focused on operating and acquiring metals and mining businesses in high quality, stable jurisdictions that are critical in the electrification and decarbonization of the global economy.
Estimates of Mineral Resources and Ore Reserves and Production Target
This release contains estimates of Ore Reserves and Mineral Resources as well as a Production Target. The Ore Reserves, Mineral Resources and Production Target are reported in MAC’s ASX Announcement dated 23 April 2024 titled ‘Updated Resource and Reserve Statement and Production Guidance’ (the R&R Announcement). The Company is not aware of any new information or data that materially affects the information included in the R&R Announcement, and that all material assumptions and technical parameters underpinning the estimates or Ore Reserves and Mineral Resources in the R&R Announcement continue to apply and have not materially changed. The material assumptions underpinning the Production Target in the R&R Announcement continue to apply and have not materially changed. It is a requirement of the ASX Listing Rules that the reporting of ore reserves and mineral resources in
Forward Looking Statements
This release includes “forward-looking statements.” The forward-looking information is based on the Company’s expectations, estimates, projections and opinions of management made in light of its experience and its perception of trends, current conditions and expected developments, as well as other factors that management of the Company believes to be relevant and reasonable in the circumstances at the date that such statements are made, but which may prove to be incorrect. Assumptions have been made by the Company regarding, among other things: the price of copper, continuing commercial production at the CSA Copper Mine without any major disruption, the receipt of required governmental approvals, the accuracy of capital and operating cost estimates, the ability of the Company to operate in a safe, efficient and effective manner and the ability of the Company to obtain financing as and when required and on reasonable terms. Readers are cautioned that the foregoing list is not exhaustive of all factors and assumptions which may have been used by the Company. Although management believes that the assumptions made by the Company and the expectations represented by such information are reasonable, there can be no assurance that the forward-looking information will prove to be accurate.
MAC’s actual results may differ from expectations, estimates, and projections and, consequently, you should not rely on these forward-looking statements as predictions of future events. Words such as “expect,” “estimate,” “project,” “budget,” “forecast,” “anticipate,” “intend,” “plan,” “may,” “will,” “could,” “should,” “believes,” “predicts,” “potential,” “continue,” and similar expressions (or the negative versions of such words or expressions) are intended to identify such forward- looking statements. These forward-looking statements include, without limitation, MAC’s expectations with respect to future performance of the CSA Copper Mine. These forward-looking statements involve significant risks and uncertainties that could cause the actual results to differ materially from those discussed in the forward-looking statements. Most of these factors are outside MAC’s control and are difficult to predict. Factors that may cause such differences include, but are not limited to: the supply and demand for copper; the future price of copper; the timing and amount of estimated future production, costs of production, capital expenditures and requirements for additional capital; cash flow provided by operating activities; unanticipated reclamation expenses; claims and limitations on insurance coverage; the uncertainty in Mineral Resource estimates; the uncertainty in geological, metallurgical and geotechnical studies and opinions; infrastructure risks; and other risks and uncertainties indicated from time to time in MAC’s other filings with the SEC and the ASX. MAC cautions that the foregoing list of factors is not exclusive. MAC cautions readers not to place undue reliance upon any forward-looking statements, which speak only as of the date made. MAC does not undertake or accept any obligation or undertaking to release publicly any updates or revisions to any forward-looking statements to reflect any change in its expectations or any change in events, conditions, or circumstances on which any such statement is based.
More information on potential factors that could affect MAC’s or CSA Copper Mine’s financial results is included from time to time in MAC’s public reports filed with the SEC and the ASX. If any of these risks materialize or MAC’s assumptions prove incorrect, actual results could differ materially from the results implied by these forward-looking statements. There may be additional risks that MAC does not presently know, or that MAC currently believes are immaterial, that could also cause actual results to differ from those contained in the forward-looking statements. In addition, forward-looking statements reflect MAC’s expectations, plans or forecasts of future events and views as of the date of this communication. MAC anticipates that subsequent events and developments will cause its assessments to change. However, while MAC may elect to update these forward-looking statements at some point in the future, MAC specifically disclaims any obligation to do so, except as required by law. These forward-looking statements should not be relied upon as representing MAC’s assessment as of any date subsequent to the date of this communication. Accordingly, undue reliance should not be placed upon the forward-looking statements.
Non-IFRS financial information
MAC’s results are reported under International Financial Reporting Standards (IFRS), noting the results in this report have not been audited or reviewed. This release may also include certain non-IFRS measures including C1, Total Cash costs and Free Cash Flow. These C1, Total Cash cost and Free Cash Flow measures are used internally by management to assess the performance of our business, make decisions on the allocation of our resources and assess operational management. Non-IFRS measures have not been subject to audit or review and should not be considered as an indication of or alternative to an IFRS measure of financial performance.
C1 Cash Cost
C1 costs are defined as the costs incurred to produce copper at an operational level. This includes costs incurred in mining, processing and general and administration as well freight and realisation and selling costs. By-product revenue is credited against these costs to calculate a dollar per pound metric. This metric is used as a measure operational efficiency to illustrate the cost of production per pound of copper produced.
Total Cash Cost
Total cash costs include C1 cash costs plus royalties and sustaining capital less inventory WIP movements. This metric is used as a measure operational efficiency to further illustrate the cost of production per pound of copper produced whilst incurring government-based royalties and capital to sustain operations.
Free Cash Flow
Free cash flow is defined as net cash provided by operating activities less additions to property, plant, equipment and mineral interests. This measure, which is used internally to evaluate our underlying cash generation performance and the ability to repay creditors and return cash to shareholders, provides investors with the ability to evaluate our underlying performance.
_________________________
1 Record production referencing the CSA Copper Mine under MAC ownership.
2 See “Non-IFRS financial information” and refer to table 2 for reconciliation of C1 Cash Cost.
3 See “Non-IFRS financial information” and refer to table 2 for reconciliation of Total Cash Cost.
4 See “Non-IFRS financial information.”
5 Realised sales price excluding hedging impact.
6 2,185 dmt at Cu spot price of
7 See “Non-IFRS Information” and refer to table 2 for reconciliation of C1 Cash Cost.
8 Excludes corporate costs from parent entity. See “Non-IFRS financial information” and refer to table 2 for reconciliation of Total Cash Cost.
9 Senior Debt + Mezzanine Facility – Cash and cash equivalents (excluding streams)
10 Realised price is before impact of hedging
11 Sustainable capex
12 See “Non-IFRS Information” and refer to table 2 for reconciliation of C1 Cash Cost.
13 See “Non-IFRS Information” and refer to table 2 for reconciliation of C1 Cash Cost.
14 Net debt is calculated taking senior debt (+) mezzanine debt (-) cash and cash equivalents excluding streams.
15 Spot Copper price as of 28 June 2024 of
View source version on businesswire.com: https://www.businesswire.com/news/home/20240722961999/en/
Mick McMullen
Chief Executive Officer
Metals Acquisition Limited
investors@metalsacqcorp.com
Morne Engelbrecht
Chief Financial Officer
Metals Acquisition Limited
Source: Metals Acquisition Limited