North Bay Resources Announces Resource Estimate of 474,000 ounces at Fran Gold Project, British Columbia
Rhea-AI Summary
Positive
- Resource estimate shows significant gold presence with 474,000 ounces from 43.8M tonnes
- Strategic location next to major mines including Centerra's Mt. Milligan and Artemis Gold's Blackwater Mine
- Deposit remains open for expansion in multiple directions and at depth
- Company owns a 100-ton per day gold mill in Bishop, California for processing
- Successful debt restructuring with $350,000 converted to 2-year secured debenture
Negative
- Resource estimate is not NI 43-101 compliant, reducing its credibility
- Relatively low average gold grade of 0.34 g/t in the Main Zone + East Extension
- Significant warrant dilution with 500 million warrants issued at $0.0007
- Outstanding demand loan of $11,951 remains
AI-generated analysis. How Rhea-AI works. Not financial advice.
BISHOP, Calif., May 13, 2025 (GLOBE NEWSWIRE) -- North Bay Resources, Inc. (the “Company” or “North Bay”) (OTC: NBRI) is pleased to announce a resource estimate (non-NI 43-101) for the Bullion Alley Zone at the Company’s Fran Gold Project. The preliminary resource estimate was completed by the Company using Leapfrog Geo + Edge 3D modelling software and diamond drilling data from 2001, 2005, 2006, 2012, and 2018 totaling 18,000 meters (55,000 feet) in 104 holes utilizing block model, with no cut-off:
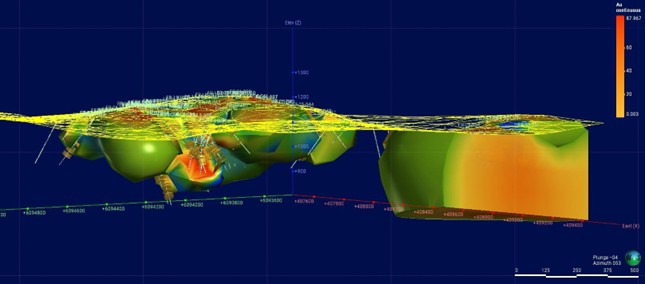
Diagram 1. Fran Gold Block Model (Smooth)
| Bullion Alley - Main Zone | |||
| Mass (tonnes) | Average (g/t) | Total (grams) | Total (tr. ounces) |
| 20,035,146 | 0.50 | 10,051,730 | 323,170 |
| Bullion Alley - Main Zone + East Extension | |||
| Mass (tonnes) | Average (g/t) | Total (grams) | Total (tr. ounces) |
| 43,797,234 | 0.34 | 14,743,070 | 474,001 |
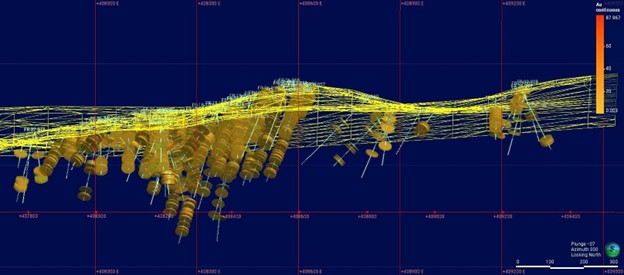
Diagram 2. Fran Gold Au >0.1 g/t cutoff
Recent data compilation has resulted in identification of the following significant drill intercepts.
| Hole ID | From (m) | To (m) | Width (m) | Grade g/t |
| 2001-01 | 46.0 | 234.0 | 188.0 | 0.1 |
| incl. | 102.8 | 127.1 | 24.3 | 0.5 |
| incl. | 220.0 | 234.0 | 14.0 | 0.6 |
| 2001-02 | 39.0 | 214.5 | 175.5 | 0.3 |
| incl. | 44.0 | 91.0 | 47.0 | 0.7 |
| incl. | 179.0 | 214.5 | 35.5 | 0.6 |
| 2001-04 | 66.0 | 180.0 | 114.0 | 0.1 |
| incl. | 75.0 | 95.5 | 20.5 | 0.3 |
| 2001-05 | 76.6 | 129.2 | 52.6 | 0.4 |
| 2001-06 | 19.8 | 74.0 | 54.2 | 0.3 |
| 2001-12 | 52.8 | 154.0 | 101.3 | 0.3 |
| 2002-26 | 40.7 | 82.0 | 41.3 | 1.2 |
| 2002-27 | 44.7 | 172.0 | 127.4 | 0.5 |
| 2002-31 | 167.1 | 185.3 | 18.3 | 0.5 |
| 2002-33 | 39.2 | 186.0 | 146.8 | 0.1 |
| incl. | 53.7 | 80.6 | 26.9 | 0.3 |
| 2002-34 | 16.7 | 195.5 | 178.9 | 0.2 |
| incl. | 154.5 | 195.5 | 41.0 | 0.7 |
| 2002-36 | 88.0 | 235.1 | 147.1 | 0.4 |
| 2002-37 | 118.0 | 229.6 | 111.6 | 0.1 |
| incl. | 118.0 | 133.8 | 15.9 | 0.5 |
| 2006-43 | 153.0 | 193.2 | 40.2 | 0.7 |
| 2006-47 | 35.1 | 81.6 | 46.5 | 1.3 |
| 2006-49 | 104.1 | 119.3 | 15.1 | 2.7 |
| 2006-50A | 44.3 | 118.1 | 73.8 | 0.7 |
| 2006-51 | 66.1 | 85.4 | 19.3 | 0.7 |
| 2006-53 | 79.8 | 92.9 | 13.1 | 1.6 |
| 2006-55 | 27.9 | 100.5 | 72.5 | 1.8 |
| 2006-56 | 90.5 | 116.5 | 26.1 | 1.2 |
| 2006-58 | 61.4 | 157.4 | 96.0 | 0.3 |
| 2006-59 | 21.8 | 74.1 | 52.3 | 0.6 |
| 2006-60 | 90.5 | 131.5 | 41.0 | 0.7 |
| 2006-61 | 9.1 | 58.8 | 49.6 | 0.6 |
| 2006-62 | 79.9 | 150.3 | 70.5 | 0.5 |
| 2007-66 | 72.5 | 102.0 | 29.5 | 0.3 |
| 2007-68 | 127.1 | 147.1 | 20.0 | 0.8 |
| 2007-69 | 171.3 | 197.8 | 26.6 | 0.5 |
| 2007-70 | 131.1 | 246.0 | 114.9 | 0.7 |
| 2007-71 | 32.9 | 116.9 | 84.0 | 0.9 |
| 2007-72 | 78.9 | 106.9 | 28.0 | 0.3 |
| 2007-73 | 180.6 | 194.2 | 13.6 | 0.4 |
| 2007-74 | 111.9 | 269.8 | 157.9 | 0.6 |
| incl. | 111.9 | 188.0 | 76.1 | 1.1 |
| 2007-75 | 49.0 | 124.5 | 75.5 | 0.8 |
| 2007-76 | 133.2 | 169.8 | 36.6 | 0.9 |
| 2018-91 | 249.4 | 296.0 | 46.6 | 0.4 |
| 2018-94 | 222.0 | 339.2 | 117.2 | 0.6 |
| 2018-95 | 202.7 | 309.0 | 106.3 | 1.0 |
| 2018-96 | 134.7 | 284.0 | 149.3 | 0.9 |
| 2018-103 | 105.7 | 178.6 | 72.9 | 1.4 |
*Non-weighted interval length has been used to determine avg. grade
The company continues to compile data in preparation for a NI 43-101 Compliant Mineral Resource Estimate. In particular, the addition of surface trenching data and sampling data for areas that have not been drill tested between the Main and East Zones as well as to the East and North-east where a significant gold in soil anomaly exists and may add to the data set. The deposit remains open in these directions as well as to the South where a parallel vein system exists and most significantly, throughout the main zone, at depth.
Fran Gold Project
The Fran Gold Project is next to Centerra Gold’s Mt. Milligan Project, with Reserves of 264Mt grading 0.3 gram per tonne gold and
Historical exploration and development planning at Fran focused on delineation of mid-high grade veins with an eye to underground mining of these veins. Very limited focus was placed on bulk tonnage and disseminated gold, although discussed in reports from 2006, no follow-up appears to have occurred. North Bay’s recent ongoing focus has been the development of mid-high grade surface material as feedstock for its Bishop Gold Mill. This in turn has led to a re-evaluation of the project potential resulting in what is currently a dual focus with high grade surface material going to the Company’s mill and further evaluation of the larger potential of the mass tonnage gold deposit. Data indicates substantial expansion potential at depth beyond 300m (984 feet) and extensions of the disseminated gold zones to the East and North-East where copper grades begin to rise. Drilling was stopped in these directions due to the loss of the mid-high grade veins that were the focus of historical exploration and these areas remain largely unexplored.
In addition to the bulk gold deposit, the Company continues to develop the project as mid-high grade feedstock for its 100 ton per day Bishop, California gold mill utilizing existing stockpiles and development of the surface oxide zone where trenching has shown consistent grade of 16 grams (0.5 ounces per ton) over 30m (110 feet) in trenches B+C.
Corporate Update
The Company has settled a demand loan totalling
The Company has begun work with the Company’s prior auditors for the purpose of returning to SEC reporting status and upon completion may commence the uplisting process.
On behalf of the Board of Directors of
NORTH BAY RESOURCES INC.
Jared Lazerson
CEO
X: @NorthBayRes
YouTube: North Bay Resources - YouTube
LinkedIn: North Bay Resources Inc | LinkedIn
This news release may contain certain “Forward-Looking Statements” within the meaning of the United States Private Securities Litigation Reform Act of 1995 and applicable Canadian securities laws.
Photos accompanying this announcement are available at:
https://www.globenewswire.com/NewsRoom/AttachmentNg/3185942d-335c-4522-84fe-7253039eb433
https://www.globenewswire.com/NewsRoom/AttachmentNg/9550097c-8782-40b7-abb3-af5a6f03939a
