Oak View Bankshares, Inc. Announces Strong Third Quarter Performance
Rhea-AI Summary
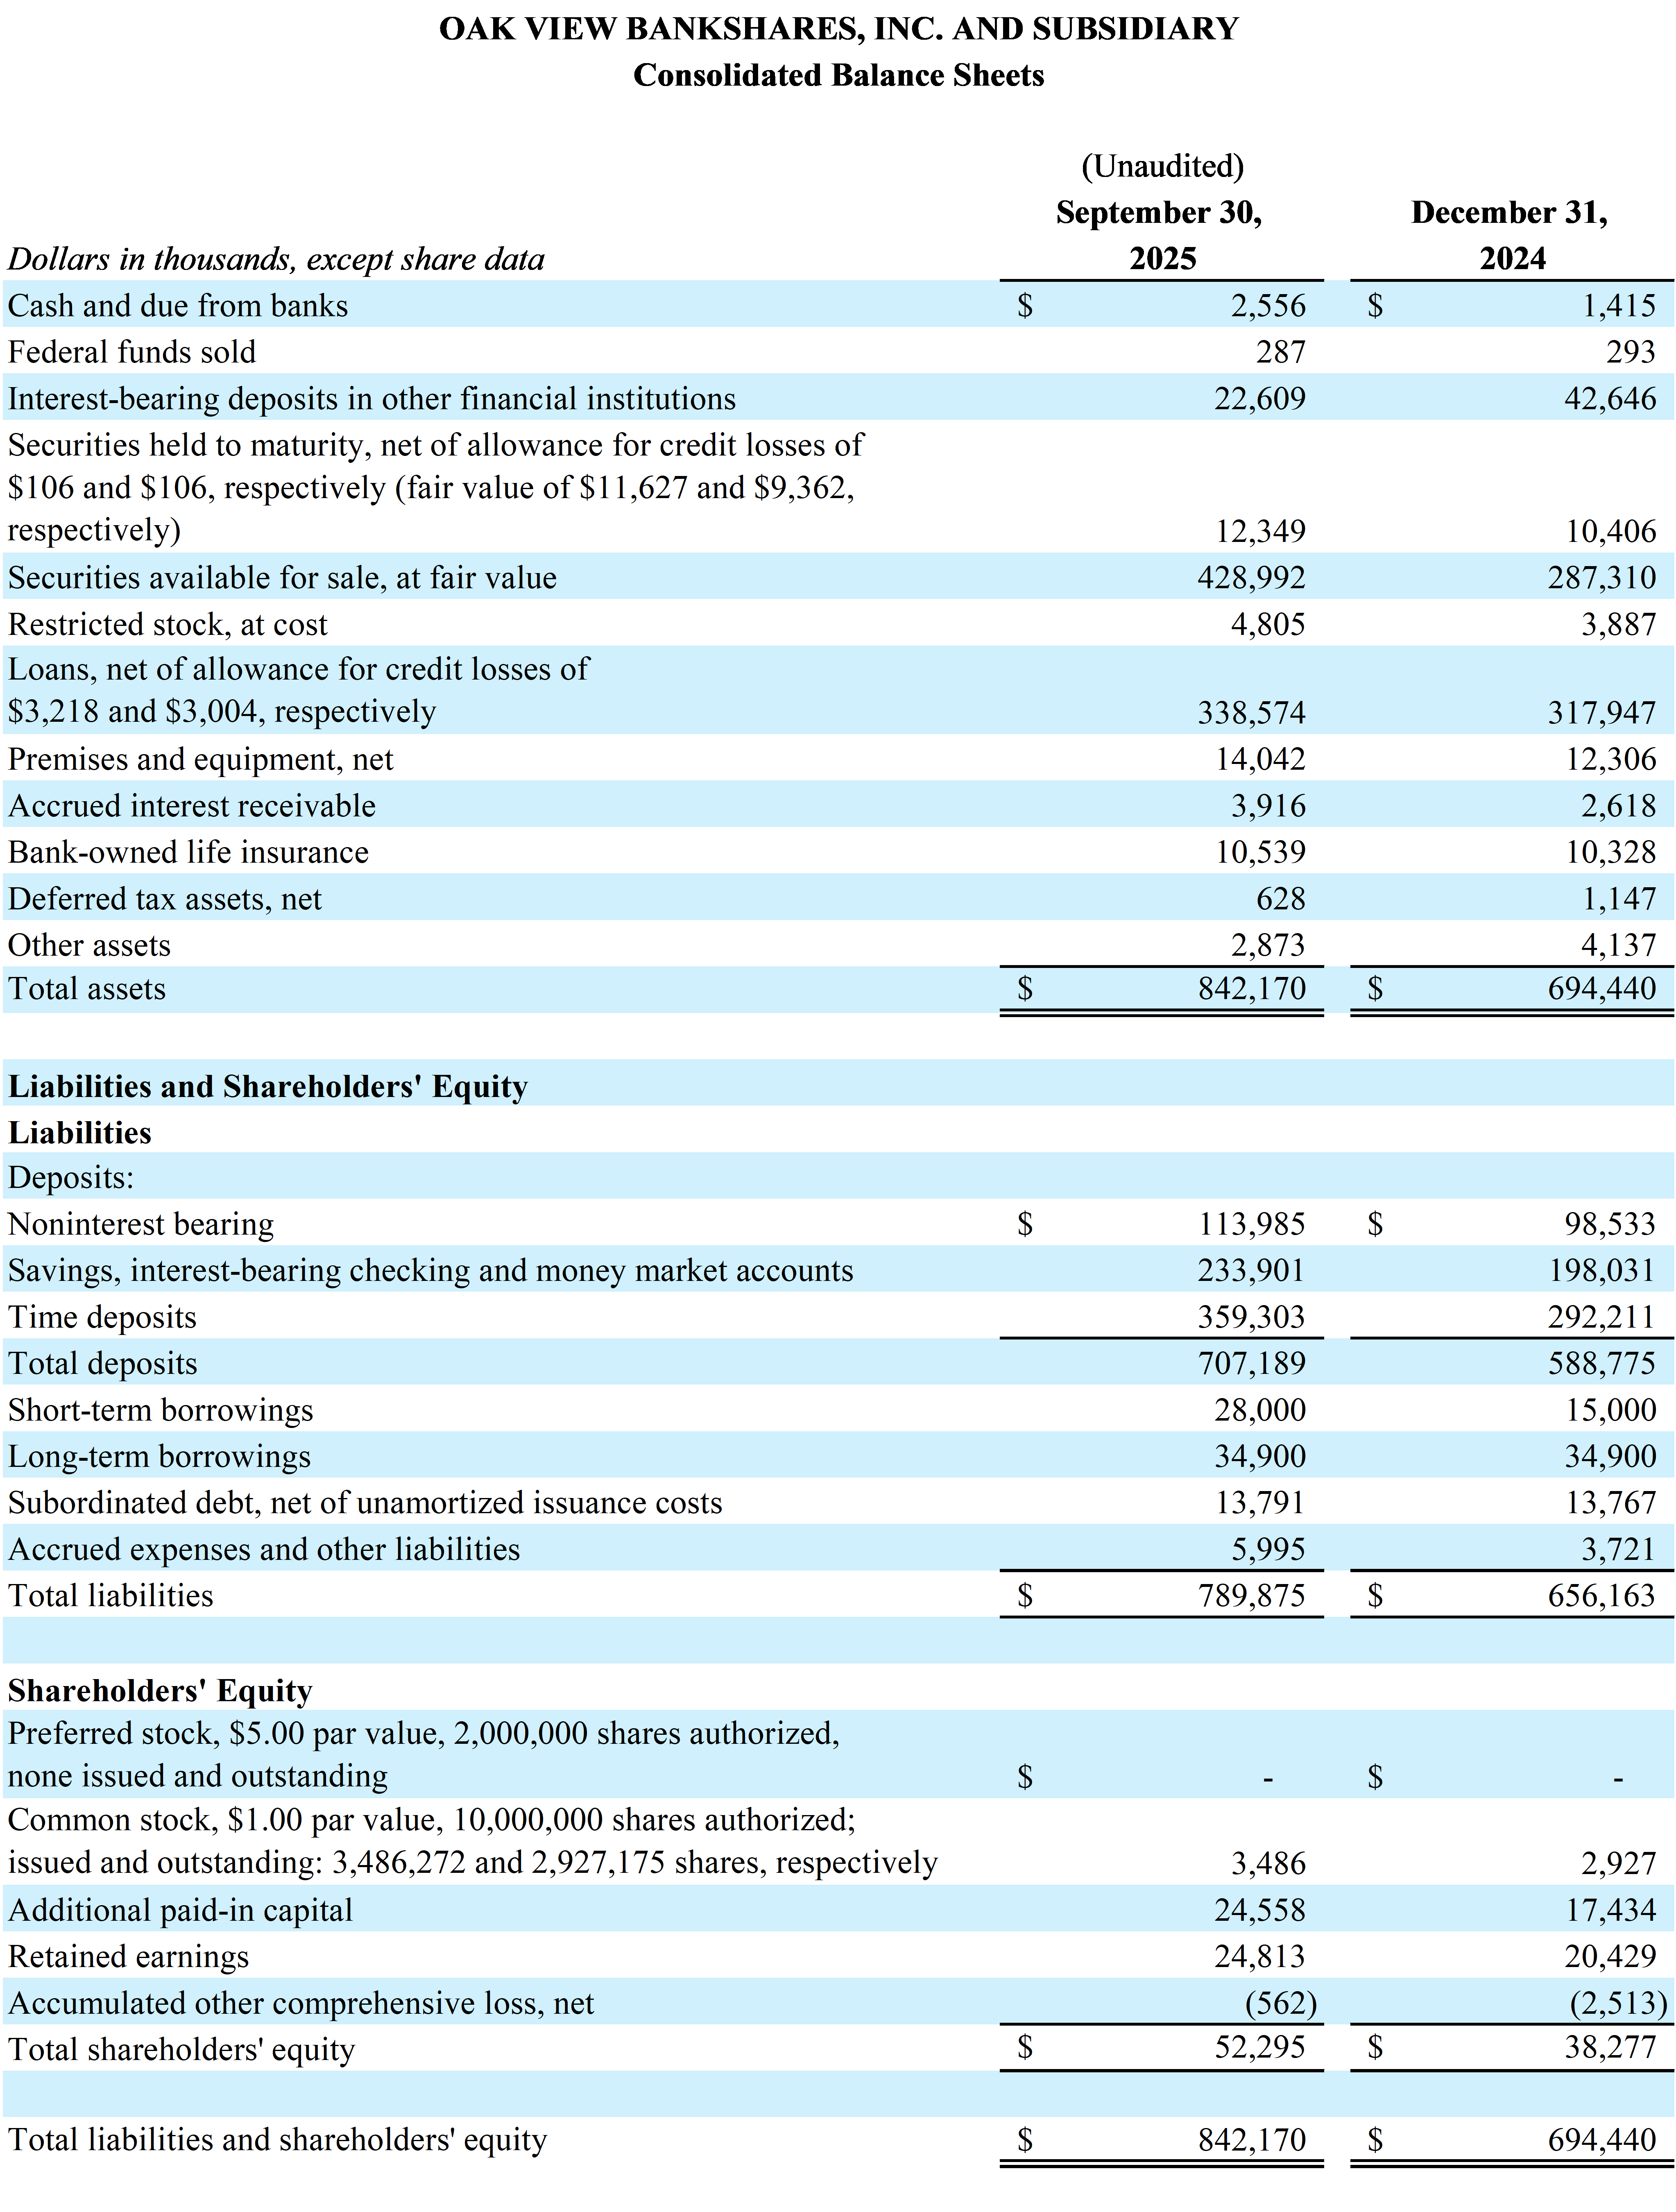
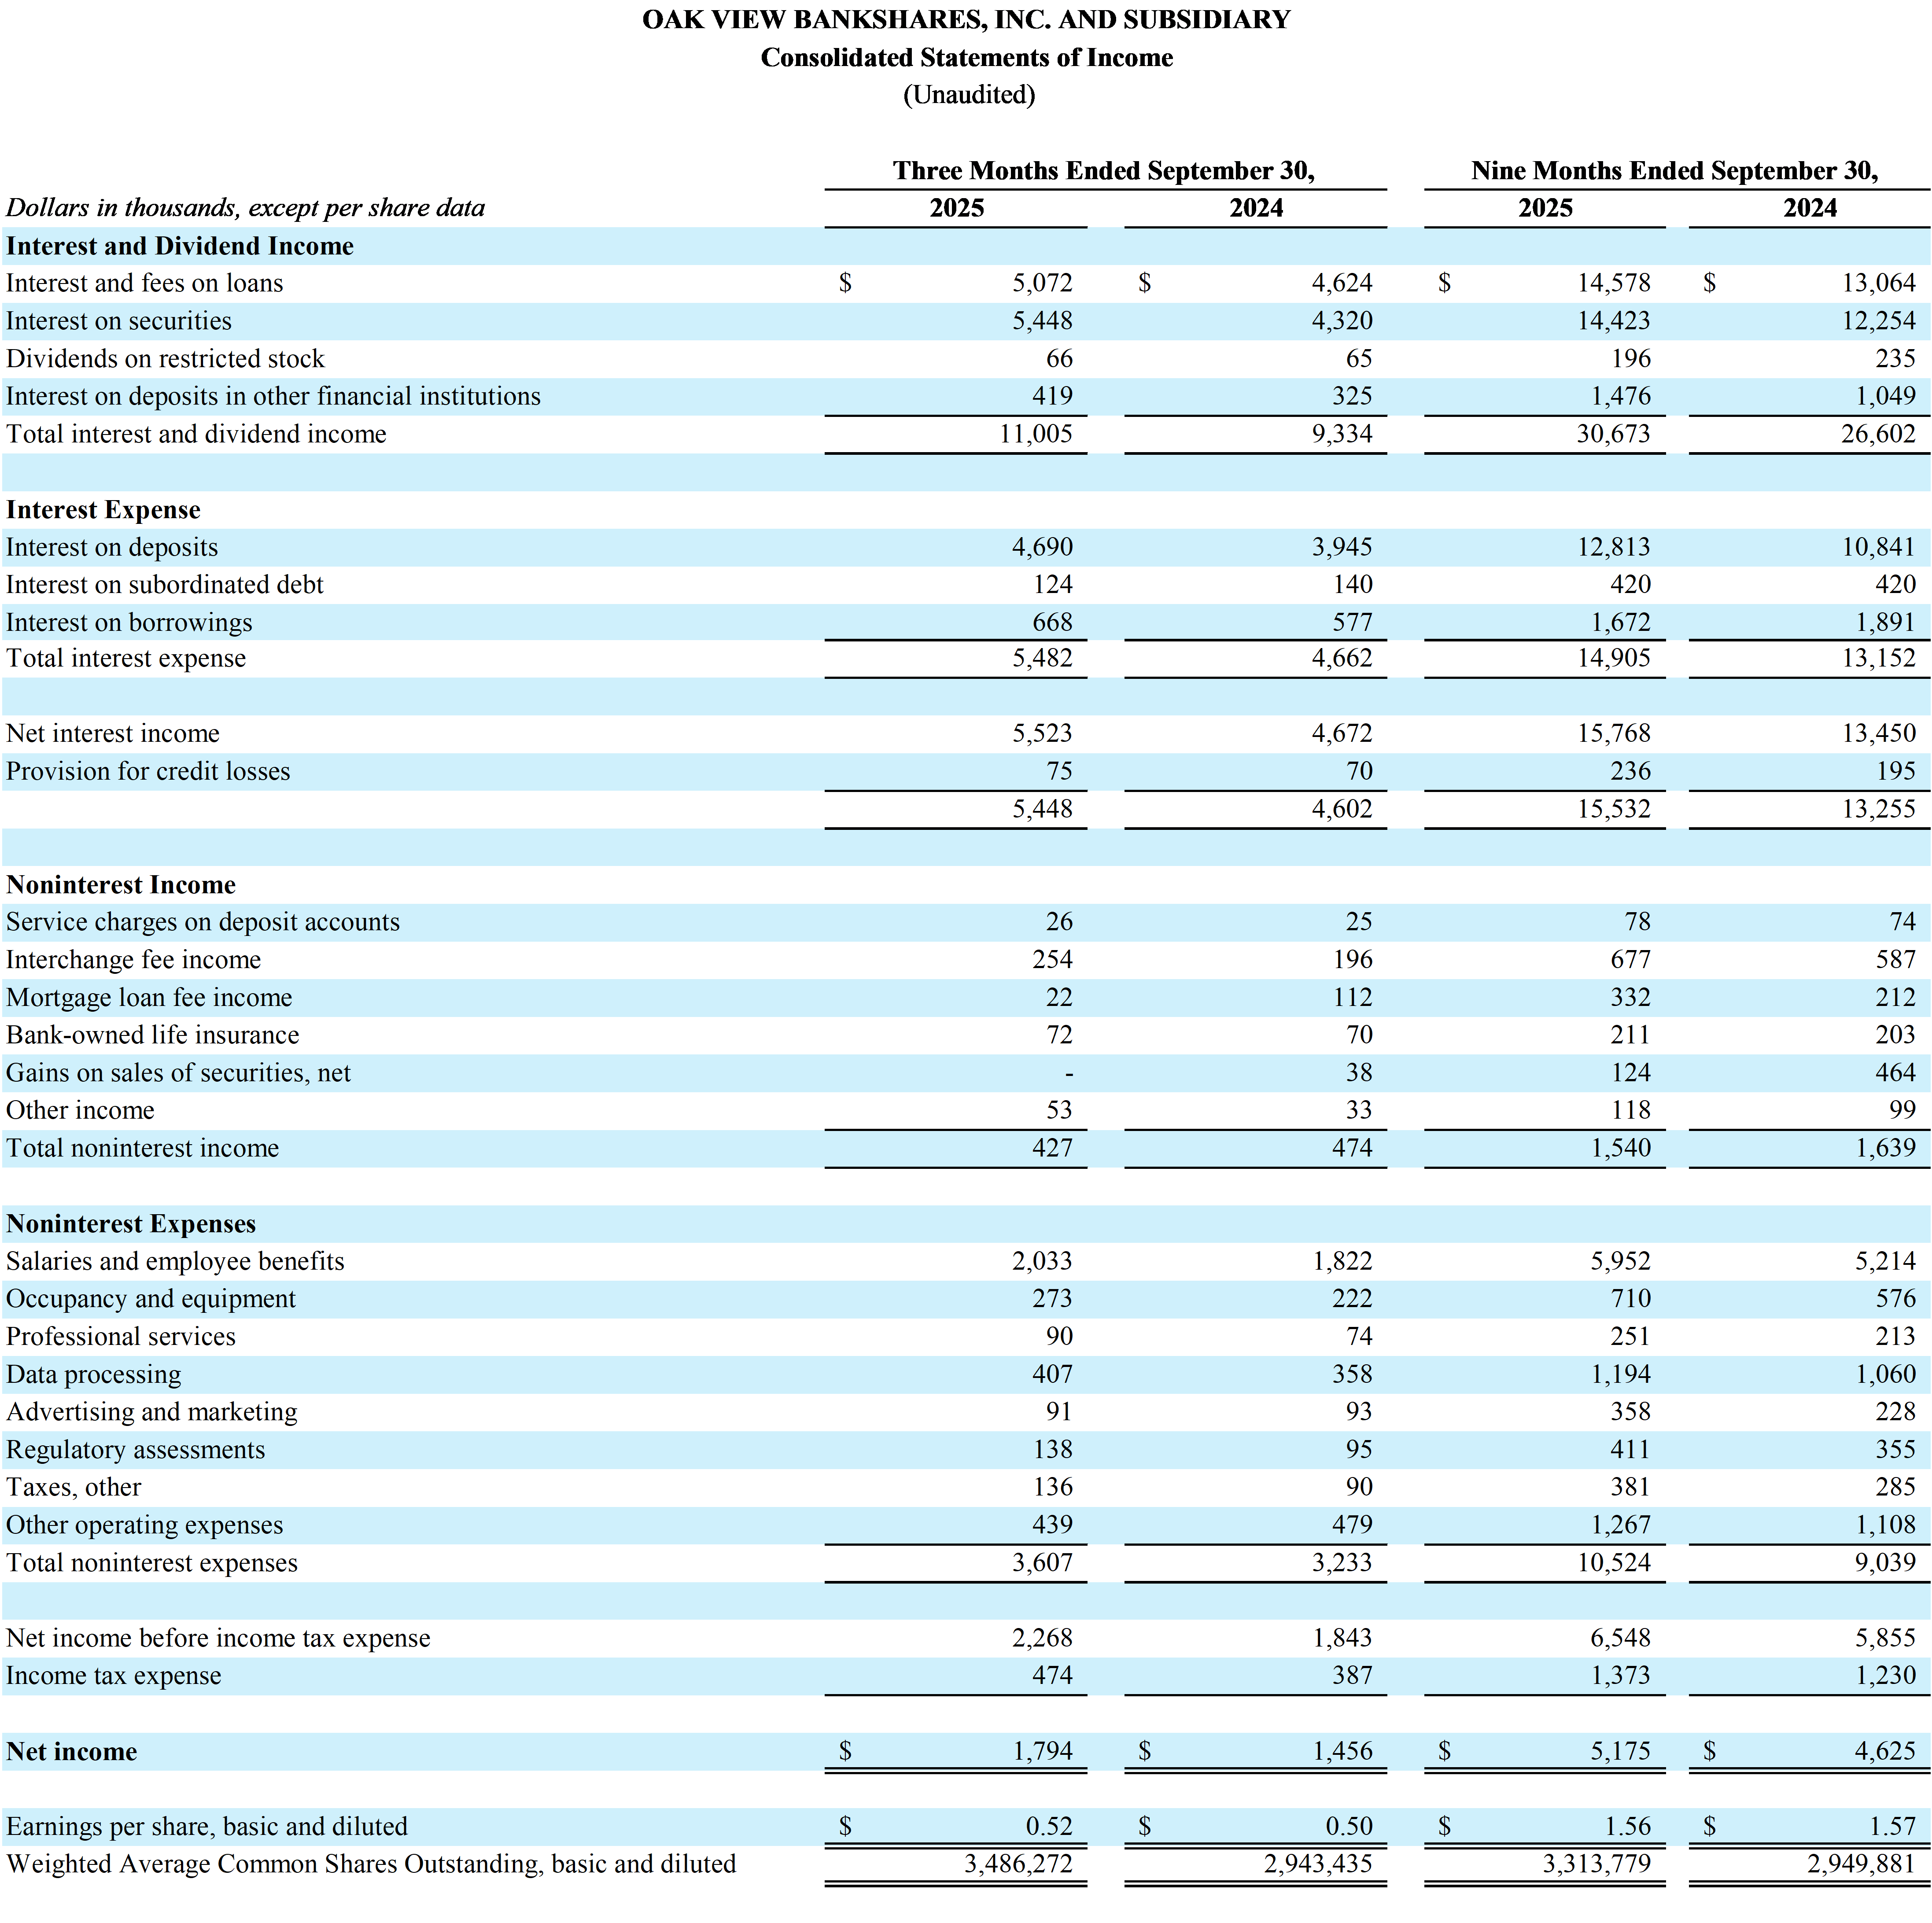
Oak View Bankshares (OTCID: OAKV) reported third-quarter 2025 results on October 16, 2025, with quarterly net income of $1.8M versus $1.5M a year earlier and nine‑month net income of $5.2M versus $4.6M. Key balance sheet moves included total assets of $842.2M (up $147.7M from Dec 31, 2024), total deposits $707.2M (up $118.4M), and debt securities $441.3M (up $143.6M).
Other highlights: net interest income before provision was $5.5M for the quarter, shareholders' equity rose to $52.3M, book value per share was $15.00, liquidity available totaled $546.5M, and regulatory capital remained above "well capitalized" thresholds.
Positive
- Total assets +$147.7M since Dec 31, 2024
- Total deposits +$118.4M since Dec 31, 2024
- Debt securities +$143.6M since Dec 31, 2024
- Quarterly net income +20% year-over-year
- Quarter net interest income before provision +$0.8M
- Shareholders' equity +$14.0M since Dec 31, 2024
- Book value per share increased to $15.00
- Completed private placement raising $7.8M on Apr 2, 2025
Negative
- Nine-month return on average equity down from 18.1% to 15.7%
- Quarter noninterest income fell from $0.5M to $0.4M
- Quarter mortgage loan fee income down 80.4% year-over-year
- Salaries and benefits increased 11.6% for the quarter
- Occupancy and equipment expenses increased 23.0% for the quarter
- Regulatory assessments increased 45.3% for the quarter
- Commonwealth franchise tax and similar items increased 51.1% for the quarter
News Market Reaction – OAKV
In the Oct 21 session, OAKV declined 0.08%, reflecting a mild negative market reaction.
Data tracked by StockTitan Argus on the day of publication.
AI-generated analysis. How Rhea-AI works. Not financial advice.
WARRENTON, VA / ACCESS Newswire / October 16, 2025 / Oak View Bankshares, Inc. (the "Company") (OTCID:OAKV), parent company of Oak View National Bank (the "Bank"), reported net income of
Basic and diluted earnings per share were
Michael Ewing, CEO and Chairman of the Board, said, "We are proud of our third quarter and year-to-date results. We are humbled to have the #1 deposit market share for community banks in the markets we serve. Your trust is our most precious resource - and we are fiercely committed to earning it every day." Mr. Ewing continued "The hard work of your talented team and the support of our communities are the reasons for our success. As always, our strong performance reflects our commitment to striking the optimal balance among safety and soundness, profitability, and growth. Your Company's future is bright."
Selected Highlights:
Return on average assets was
0.9% and return on average equity was15.1% for the quarter ended September 30, 2025, compared to0.9% and16.2% , respectively, for the quarter ended September 30, 2024. Return on average assets was0.9% and return on average equity was15.7% for the nine months ended September 30, 2025, compared to1.0% and18.1% , respectively, for the nine months ended September 30, 2024.
Total assets were
$842.2 million on September 30, 2025, compared to$694.4 million on December 31, 2024, an increase of$147.7 million .
Total loans were
$341.8 million on September 30, 2025, compared to$321.0 million on December 31, 2024, an increase of$20.8 million .
The total amortized cost of debt securities was
$441.3 million on September 30, 2025, compared to$297.8 million on December 31, 2024, an increase of$143.6 million .
Total deposits were
$707.2 million on September 30, 2025, compared to$588.8 million on December 31, 2024, an increase of$118.4 million .
Regulatory capital remains strong with ratios exceeding the "well capitalized" thresholds in all categories.
Asset quality continues to be outstanding.
Liquidity remains strong with cash, unencumbered securities available for sale, and available secured and unsecured borrowing capacity totaling
$546.5 million as of September 30, 2025, compared to$505.3 million as of December 31, 2024.
Net Interest Income
The net interest margin was
The net interest margin was
Noninterest Income
Noninterest income was
Contributing to the changes in noninterest income for the quarters and nine months ended September 30, 2025, and 2024, were:
Net gains on sales of available for sale securities were immaterial for the quarters ended September 30, 2025, and 2024 and
$0.1 million and$0.5 million for the nine months ended September 30, 2025, and 2024, respectively. Noninterest income, excluding gains on sales of securities, was$1.4 million and$1.2 million , an increase of20.5% , for the nine months ended September 30, 2025, and 2024, respectively. Proceeds from the sale of these securities were redeployed into assets with more attractive risk and return characteristics.Interchange fee income increased
30.0% and15.3% for the quarter and nine months ended September 30, 2025, compared to the same respective periods in 2024. The increase is the result of higher volume in transactions for these periods.Mortgage loan fee income decreased
80.4% for the quarter ended September 30, 2025, compared to the quarter ended September 30, 2024. Mortgage loan fee income increased56.6% for the nine months ended September 30, 2025, compared to the nine months ended September 30, 2024. The changes in mortgage loan fee income are the result of changes in loan origination volume for these periods.
Noninterest Expense
Noninterest expense was
Contributing to the changes in noninterest expense for the quarters and nine months ended September 30, 2025, and 2024, were:
Salaries and employee benefits increased by
11.6% and14.2% for the quarter and nine months ended September 30, 2025, compared to the same respective periods in 2024. These increases are the result of an increase in staffing levels as well as overall increases in employee salaries and benefits.Occupancy and equipment expenses increased by
23.0% and23.3% for the quarter and nine months ended September 30, 2025, compared to the same respective periods in 2024. These increases are primarily due to the relocation of one branch to a newly constructed facility in April 2025 and the addition of a de novo branch in September 2024.Data processing increased by
13.7% and12.6% for the quarter and nine months ended September 30, 2025, compared to the same respective periods in 2024. Data processing expenses are driven by the evolving nature of changes in technology and the related licensing and servicing costs.Advertising and marketing expenses remained relatively flat for the quarter ended September 30, 2025, compared to quarter ended September 30, 2024, and increased
57.0% for the nine months ended September 30, 2025, compared to September 30, 2024. These increases are primarily due to the relocation of one branch to a newly constructed facility in April 2025 and the increased market efforts in our communities.Regulatory assessments increased
45.3% and15.8% for the quarter and nine months ended September 30, 2025, compared to the same respective periods in 2024. These increases are attributable to the overall growth the Company has experienced during the reported periods.Tax, other, which represents the Commonwealth of Virginia Franchise Tax increased
51.1% and33.7% for the quarter and nine months ended September 30, 2025, compared to the same respective periods in 2024. This increase is attributed to the increase in shareholders' equity the Company has experienced during the reported reports.
Liquidity
Liquidity remains strong with
The Company's deposits proved to be stable with core deposits, which are defined as total deposits excluding brokered deposits, of
Asset Quality
The allowance for credit losses related to the loan portfolio was
The provision for credit losses for the quarter ended September 30, 2025, and 2024 was
Shareholders' Equity & Regulatory Capital
Shareholders' equity was
Book value per share was
Net accumulated other comprehensive losses were
About Oak View Bankshares, Inc. and Oak View National Bank
Oak View Bankshares, Inc. is the parent bank holding company for Oak View National Bank, a locally owned and managed community bank serving Fauquier, Culpeper, Rappahannock, and surrounding Counties. For more information about Oak View Bankshares, Inc. and Oak View National Bank, please visit our website at www.oakviewbank.com. Member FDIC.
For additional information, contact Tammy Frazier, Executive Vice President & Chief Financial Officer, Oak View Bankshares, Inc., at 540-359-7155.
Cautionary Note Regarding Forward-Looking Statements
Any statements in this release about expectations, beliefs, plans, objectives, assumptions or future events or performance are not historical facts and are forward-looking statements. These statements are often, but not always, made through the use of words or phrases such as "may," "should," "could," "would," "predict," "potential," "believe," "likely," "expect," "anticipate," "seek," "estimate," "intend," "plan," "project" and similar expressions. Accordingly, these statements involve estimates, assumptions, and uncertainties, and actual results may differ materially from those expressed in such statements. The following factors could cause the Company's actual results to differ materially from those projected in the forward-looking statements made in this document: changes in assumptions underlying the establishment of allowances for credit losses, and other estimates; the risks of changes in interest rates on levels, composition and costs of deposits, loan demand, and the values and liquidity of loan collateral, securities, and interest sensitive assets and liabilities; the effects of future economic, business and market conditions; legislative and regulatory changes, including changes in banking, securities, and tax laws and regulations and their application by our regulators; the Company's ability to maintain adequate liquidity by retaining deposit customers and secondary funding sources, especially if the Company's or banking industry's reputation becomes damaged; computer systems and infrastructure may be vulnerable to attacks by hackers or breached due to employee error, malfeasance, or other disruptions despite security measures implemented by the Company; risks inherent in making loans, such as repayment risks and fluctuating collateral values; governmental monetary and fiscal policies; changes in accounting policies, rules and practices; competition with other banks and financial institutions, and companies outside of the banking industry, including companies that have substantially greater access to capital and other resources; demand, development and acceptance of new products and services; problems with technology utilized by the Company; changing trends in customer profiles and behavior; success of acquisitions and operating initiatives, changes in business strategy or development of plans, and management of growth; reliance on senior management, including the ability to attract and retain key personnel; and inadequate design or circumvention of disclosure controls and procedures or internal controls. These factors could cause actual results or outcomes to differ materially from those expressed in any forward-looking statements made by the Company, and you should not place undue reliance on any such forward-looking statements. Any forward-looking statement speaks only as of the date on which it is made and the Company does not undertake any obligation to update any forward-looking statement or statements to reflect events or circumstances after the date on which such statement is made or to reflect the occurrence of unanticipated events. New factors emerge from time to time, and it is not possible for the Company to predict which will arise. In addition, the Company cannot assess the impact of each factor on the Company's business or the extent to which any factor, or combination of factors, may cause actual results to differ materially from those contained in any forward-looking statements.
SOURCE: Oak View Bankshares, Inc.
View the original press release on ACCESS Newswire