
Omai Gold Announces Preliminary Economic Assessment for Its Omai Project, Guyana
Omai Gold (OTCQB: OMGGF) reported a positive Preliminary Economic Assessment for its 100%-owned Omai Project in Guyana, combining the Wenot open pit and Gilt underground deposits.
Sentiment and the balance of points
Rhea-AI Sentiment reads the wording of the document, how positive or negative its language is on a 1 to 5 scale. The balance of points shown with the takes weighs what the document actually discloses, so the two can disagree, for example when a trial that missed its main goal is described in upbeat language.
Rhea-AI Summary
Omai Gold (OTCQB: OMGGF) reported a positive Preliminary Economic Assessment for its 100%-owned Omai Project in Guyana, combining the Wenot open pit and Gilt underground deposits. The study outlines an 18-year mine life with total payable gold production of 6.33 million ounces, averaging 351,488 oz/year and peaking at 435,667 oz.
At a base case gold price of $3,600/oz, the project shows an after-tax NPV5% of $4.0 billion, a 24% IRR, and a 4.1-year payback. Initial capital is estimated at $1.427 billion, with sustaining and growth capital of $928 million, for total life-of-mine capex of $2.396 billion. Average cash operating costs are projected at $1,501/oz and AISC at $1,608/oz, with average head grade of 1.35 g/t Au and 93% process recovery. Sensitivity analysis indicates after-tax NPV5% rising to $5.5 billion and IRR to 30% at $4,200/oz gold. The PEA is preliminary, relies on both Indicated and Inferred Mineral Resources, and does not declare Mineral Reserves.
Positive
- After-tax NPV5% $4.0B and 24% IRR at $3,600/oz gold
- 6.33 Moz payable gold over 18 years, averaging 351,488 oz/year
- $8.094B projected cumulative after-tax free cash flow over life of mine
- Payback 4.1 years at $3,600/oz, improving to 3.4 years at $4,200/oz
- Large resource base: 2.495 Moz Indicated and 5.465 Moz Inferred (April 2026 MRE)
- Competitive scale plant with 25,000 tpd throughput and 93% process recovery
Negative
- High initial capex of $1.427B plus $928M sustaining and growth capital
- Cash costs $1,501/oz and AISC $1,608/oz may limit margins at lower gold prices
- High strip ratio of 5.9:1 for the Wenot open pit over life of mine
- PEA-level study relies on Inferred Mineral Resources and has no Mineral Reserves declared
News Explained
The disclosure is a preliminary economic study, not yet a construction or production decision: the company identifies a feasibility study, a potential production decision, and construction as future steps, and says there is no certainty the PEA will be realized.
Details
News Market Reaction – OMGGF
On Aug 19, the day this news came out, OMGGF closed 0.84% above the previous close.
Data tracked by StockTitan Argus for the Aug 19 session.
AI-generated analysis. How Rhea-AI works. Not financial advice.




(All dollar amounts are in United States dollars, unless otherwise stated)
Highlights of Omai Project Preliminary Economic Assessment
- 6.327 million ounces of gold ("Au") projected life-of-mine ("LOM") payable production over 18 years
$4.0 billion after-tax net present value at a5% discount rate at base case$3,600 /oz gold, increasing to$5.5 billion at$4,200 /oz gold24% after-tax internal rate of return at$3,600 /oz gold, increasing to30% at$4,200 /oz gold$1.427 billion initial capital and sustaining and growth capital of$928 million over LOM- 4.1 year payback at
$3,600 /oz gold, decreasing to 3.4 years at$4,200 /oz Au $1,501 /oz gold average cash operating costs and all-in sustaining costs ("AISC")1 of$1,608 /oz$8.093 billion cumulative after-tax cash flows2 over 18 years- 351,488 oz Au per year projected average production over LOM, with peak year gold production reaching 435,667 ounces
- 1.35 g/t Au average head grade and
93% process recovery - 5.9:1 average strip ratio for the open pit LOM
Toronto, Ontario--(Newsfile Corp. - August 19, 2026) - Omai Gold Mines Corp. (TSXV: OMG) (OTCQB: OMGGF) ("Omai Gold" or the "Company") is pleased to announce positive results from its Preliminary Economic Assessment (the "PEA") for its
Elaine Ellingham, President and CEO comments: "We are very pleased to deliver this PEA, which reinforces the potential for Omai to become a very large-scale mining operation with a clear path to bringing significant economic benefits to the people of Guyana. This project's proposed initial
This economic study encompasses both the large Wenot superpit and the adjacent underground Gilt deposit, demonstrating potential for total gold production of 6,327,000 oz over an 18 year mine life. This PEA serves as an important milestone and provides a base from which we intend to advance the project on multiple fronts towards a feasibility study. As a past-producer, Omai has many benefits giving it a leg up to re-development, including highway access, a cleared site, an on-site airstrip, a tailings facility, known metallurgy, and the unique confidence that comes from a historical record of economic gold extraction.
A very significant advancement for the project occurred less than one year ago, in August 2025. At that time, we announced our fourth Mineral Resource Estimate ("MRE") for Omai, reporting an impressive
At the same time, drilling has continued with five rigs and an additional 77 drill holes have already been completed at Wenot that are not included in the MRE that forms the basis of this PEA. This leaves room for further growth and optimization. The Omai Gold team has consistently delivered for our stakeholders and with this PEA complete, we will continue to advance on a number of fronts towards our next ambitious milestones."
PEA Overview
The Omai Gold Project PEA envisions a combined open pit mine at the Wenot shear-hosted gold deposit and an underground mine at the adjacent intrusion-hosted Gilt gold deposit. Onsite milling and processing is planned with capacity at 25,000 tonnes per day ("tpd") for the mined material. Annual gold production averages 351,488 ounces of gold per year over an 18-year mine life, with peak year production of 435,667 ounces. Total combined production from the two deposits is estimated at 6,326,775 ounces of payable gold. Initial capital ("Capex") in the PEA is
At the Wenot open pit, approximately two years of pre-production are followed by 18 years of commercial production, using conventional truck-and-shovel bulk mining methods. The open pit operation is expected to extract 134.1 million tonnes ("Mt") at 1.08 g/t Au containing 4.641 million ounces ("Moz") of gold over the mine life.
Development of the Gilt underground mine will commence in Year 1 of plant operations, with underground feed available from Year 3, ramping toward a target production rate of 4,000 tonnes per day ("tpd"). The underground mine is expected to extract approximately 22.6 Mt averaging 2.98 g/t Au, containing 2.164 Moz of gold, using primarily drift-and-fill mining with cemented paste backfill. Production from the two mines will be processed through a 25,000 tpd carbon-in-leach ("CIL") gold plant, giving an annual throughput of 9,125,000 tonnes at full production.
Financial and operating metrics from the PEA are presented in Table 1, sensitivity of the financial metrics to the gold price is shown in Table 2, and cumulative cash flows and annual gold production are shown in Figure 1:
The PEA is preliminary in nature and includes inferred mineral resources that are considered too speculative geologically to have the economic considerations applied to them that would enable them to be categorized as mineral reserves, and there is no certainty that the PEA will be realized. Mineral resources ("Mineral Resources") that are not mineral reserves ("Mineral Reserves") do not have demonstrated economic viability.
Table 1. Financial and Operating Metrics from the PEA1,2,3
| 2026 Omai Gold Project Preliminary Economic Assessment (PEA) Highlights | ||
| Production | units | Value |
| Mine life | years | 18.0 |
| Total gold production | oz | 6,326,775 |
| Average annual gold production | oz | 351,488 |
| Total mineralization mined | kt | 156,670 |
| Total waste mined | kt | 788,434 |
| Total material mined | kt | 945,104 |
| Total waste-to-mineralization (Wenot) | ratio | 5.88 |
| Average gold grade | g/t | 1.35 |
| Average gold grade - Wenot ( | g/t | 1.08 |
| Average gold grade - Gilt (with mine dilution) | g/t | 2.98 |
| Gold Process Recovery | % | |
| Average Process Plant throughput | Tpd | 25,000 |
| Operating Costs | ||
| Mining cost (Total Material) | US$/t | |
| Mining cost (Mineralization) | US$/t | |
| Processing Cost | US$/t | |
| G&A cost | US$/t | |
| Total cost processed | US$/t | |
| Total cash cost (per ounce sold) | US$/oz | |
| Mine-site all-in-sustaining cost (per ounce sold) | US$/oz | |
| Capital Costs | ||
| Initial capital expenditure (Initial Capex) | US$ billion | |
| Growth Capital (underground mining) | US$ million | |
| Sustaining capital expenditures | US$ million | |
| Net reclamation costs (cost less salvage value) | US$ million | |
| Total capital expenditure - life of mine | US$ billion | |
| Base Case Economic Analysis: | ||
| IRR (after-tax) | % | 24.0 |
| NPV @ | USD billion | |
| Payback (years) | Years | 4.1 |
Table 2. Analysis of Sensitivity to Gold Price4,5
| Base Case | ||||||||
| Gold Price | US$/oz | 3,000 | 3,300 | 3,600 | 3,900 | 4,200 | 4,500 | 5,000 |
| After Tax NPV | US$ '000 | 2,444,932 | 3,206,175 | 3,966,422 | 4,726,593 | 5,484,923 | 6,243,253 | 7,507,136 |
| Payback | Years | 5.3 | 4.6 | 4.1 | 3.7 | 3.4 | 3.1 | 2.8 |
| After-Tax IRR | % | |||||||
| EBITDA (LOM) | US$ Millions | 9,748 | 11,504 | 13,259 | 15,015 | 16,770 | 18,526 | 21,452 |
| Free Cash Flow (LOM) | US$ Millions | 5,460 | 6,777 | 8,094 | 9.411 | 10,728 | 12,044 | 14,239 |
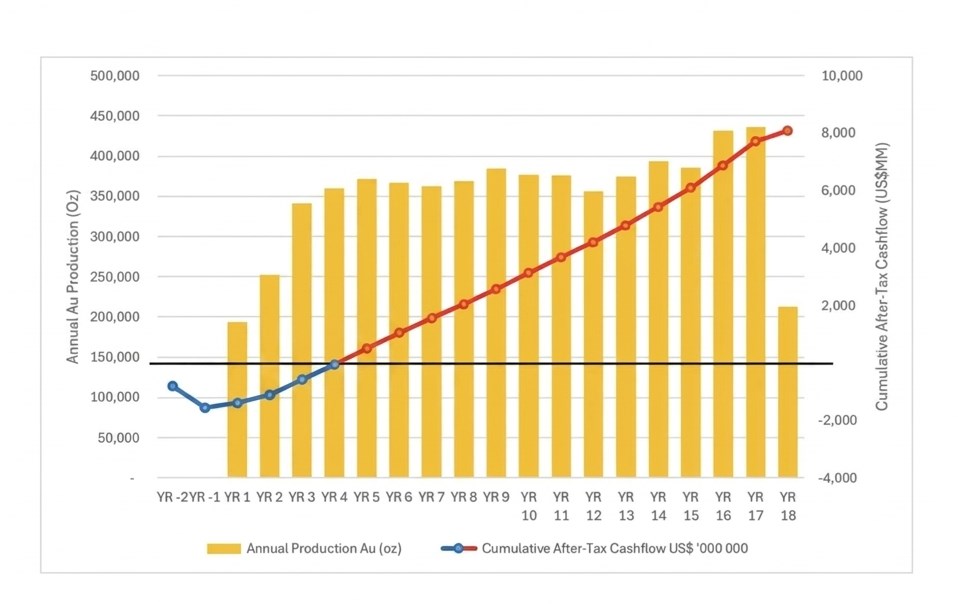
Figure 1. Cumulative Cash Flows and Annual Gold Production
To view an enhanced version of this graphic, please visit:
https://images.newsfilecorp.com/files/8712/310402_eb3797a68466e877_001full.jpg
Property Description, Location and Access
The Omai Gold Project is located approximately 165 km south of Guyana's capital city of Georgetown. Omai is connected to the two major towns of Georgetown and Linden by a newly paved highway extending to within 10km of the property Figure 2. A well-maintained dirt road extends to the east side of the Essequibo River where a pontoon barge crosses the Essequibo River to arrive on the Eastern Flats portion of the Omai Gold Property. The Omai Property is also accessible by air in 35 minutes from Georgetown to a 1,000m airstrip located on the Omai property.
The closest communities include Mile 58 and Linden. Mile 58 is a small village located about 25 km by road towards Georgetown with a population of less than 300. Linden, located 85 km from Omai, is the second largest city in Guyana with a population of approximately 42,000, and is a long-established mining community with active open pit bauxite mining.
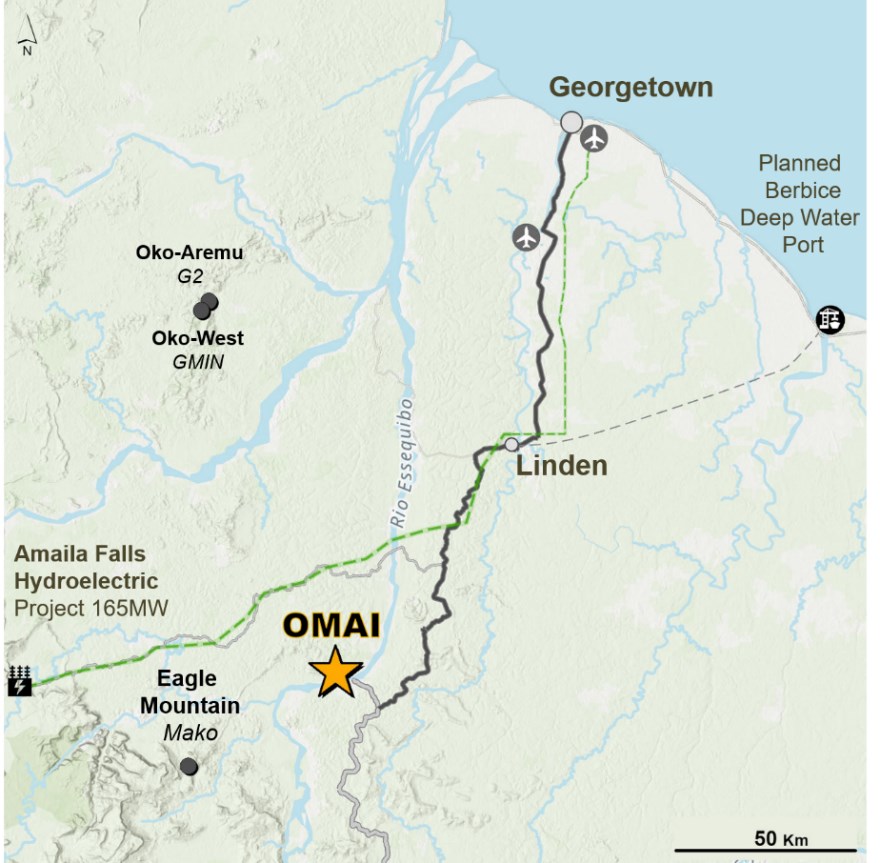
Figure 2. Project Location Map
To view an enhanced version of this graphic, please visit:
https://images.newsfilecorp.com/files/8712/310402_eb3797a68466e877_002full.jpg
Mineral Resource Estimate
This PEA is based on the Mineral Resource Estimate ("MRE") announced April 14, 20266, for the Omai Property, comprised of 2.495 Moz Au averaging 2.04 g/t Au (in 38.1 Mt) in the Indicated category and a further 5.465 Moz Au averaging 1.59 g/t Au (in 106.6 Mt) in the Inferred category. This includes both the Wenot shear-hosted deposit (open pit) and the adjacent Gilt intrusion-hosted deposit (underground).
The Wenot deposit comprises 1.453 Moz averaging 1.59 g/t Au (28.4 Mt) in the Indicated category and a further 4.00 Moz averaging 1.35 g/t Au (92.4 Mt) in the Inferred category. The Gilt deposit hosts an Indicated MRE of 1.04 Moz of gold averaging 3.33 g/t Au (9.7 Mt) and Inferred of 1.47 Moz of gold averaging 3.22 g/t Au (14.2 Mt).
Table 3. April 2026 Mineral Resource Estimate
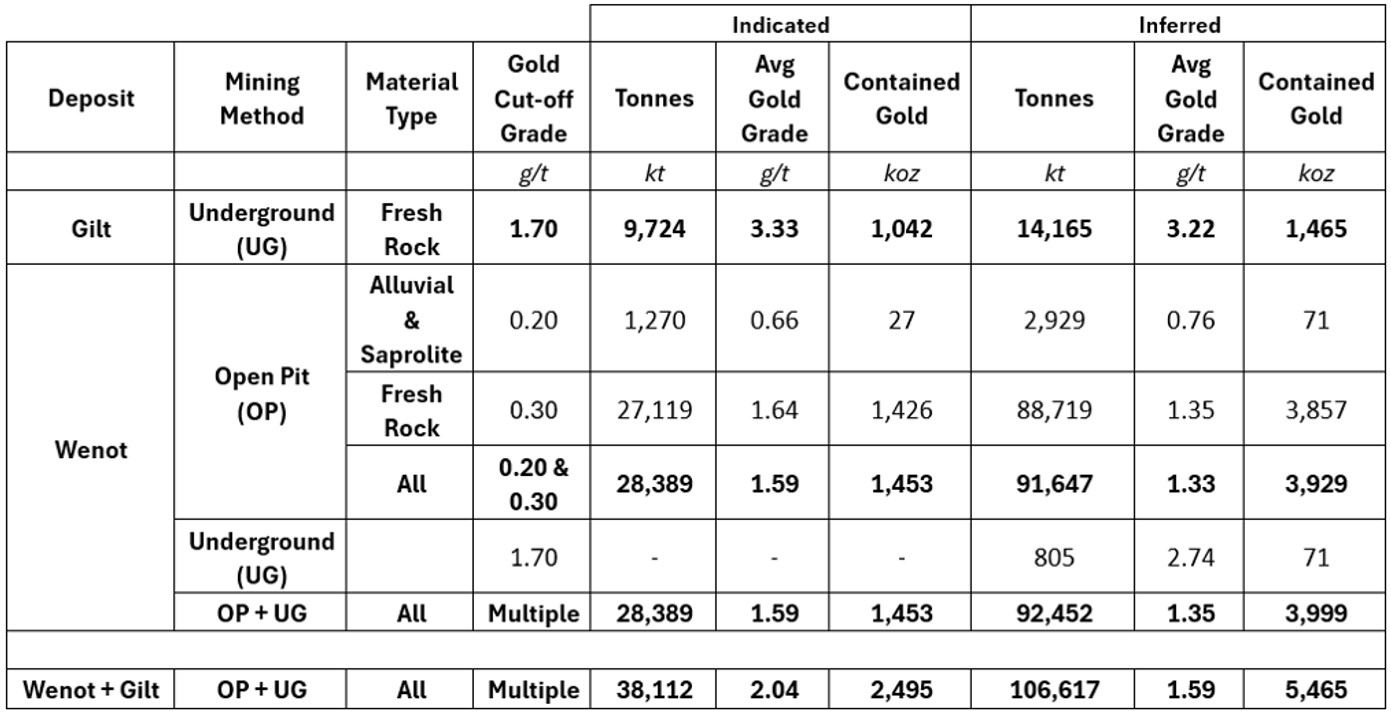
To view an enhanced version of this graphic, please visit:
https://images.newsfilecorp.com/files/8712/310402_omaitable3.jpg
Notes to Accompany the April 2026 Mineral Resource Estimate:
- The effective date of this Mineral Resource is April 7, 2026.
- The Mineral Resources were estimated in accordance with the Canadian Institute of Mining, Metallurgy and Petroleum (CIM), Standards on Mineral Resources and Reserves Definitions (2014) and Best Practices Guidelines (2019).
- Rock density averages 2.69 t/m3 for Wenot and 2.92 t/m3 for Gilt.
- Open pit resources have been constrained to a conceptual pit shell using Whittle software and underground blocks were constrained by an underground shape optimizer using Deswik (DSO) software.
- A gold price of US
$3,000 /oz was used. - Process gold recoveries for Wenot are assumed to be
90% for Alluvium/Saprolite and92% for Transition/Fresh Rock and for Gilt are assumed to be92% . - Open pit operating costs were assumed to be
$2.40 /t for soft rock material mining,$3.00 /t for fresh rock mining,$8.93 /t for Alluvium/Saprolite processing, and$14.62 /t for Fresh Rock processing. A cost of$3.25 /t was used for G&A. All costs are assumed to be US$. - Mineral Resources are reported at cut-off grades of 0.20 g/t Au for soft rock, 0.30 g/t Au for hard rock within the open pit, and 1.70 g/t Au for underground shapes.
- The Wenot pit assumed an overall slope angles of 30° for soft rock and 50° for the fresh rock. Wenot resources assume the recovery of a crown pillar below the pit shell.
- Mineral Resources that are not Mineral Reserves do not have demonstrated economic viability.
- The estimate of Mineral Resources may be materially affected by environmental, permitting, legal, title, taxation, socio-political, marketing, or other relevant issues.
- Numbers have been rounded to the nearest thousand tonnes and ounces. Differences in totals may occur due to rounding.
- The cut-off date of the supporting geological database is March 12, 2026.
- The Wenot Mineral Resource Estimate incorporates 24,484 composites from 699 diamond drill holes totalling 36,133 m of core within the mineralized wireframes. The Gilt Mineral Resource Estimate incorporates 6,125 composites from 50 diamond drill holes, totalling 6,091 m of core within the mineralized wireframes.
- Composite gold grades were assessed separately for Wenot and Gilt and were capped at values between 11.5 g/t and 40 g/t gold.
- Grade interpolation methods were Ordinary Kriging for Wenot and Inverse Distance Cubed (ID3) for Gilt.
- Rock density was applied using average values of lithological units based on 209 measurements of Wenot drill core and 190 measurements of Gilt drill core.
- The Mineral Resource has been classified in the Indicated and Inferred categories, using reference drilling spacing of 40-70 m for Indicated and up to 100 m of extrapolation distance for Inferred.
- Mr. Alan J. San Martin, P.Eng. from SLR Consulting (Canada) Ltd., is the Qualified Person (QP) for this Mineral Resource Estimate.
Production Profile
This Omai PEA supports a combined open pit and underground mining scenario for production averaging 351,488 ounces of gold per year over an 18-year mine life, with peak year production of 435,667 ounces. Total combined production from the two deposits is estimated at 6,326,775 ounces of payable gold with an average head grade over the life of the mine of 1.35 g/t Au shown in Figure 3. Production in the first two years achieves 25,000 tpd using the lower grade stockpiles that are built up during the construction / pre-strip period. This material is replaced by higher grade production from underground from year 3 onwards.
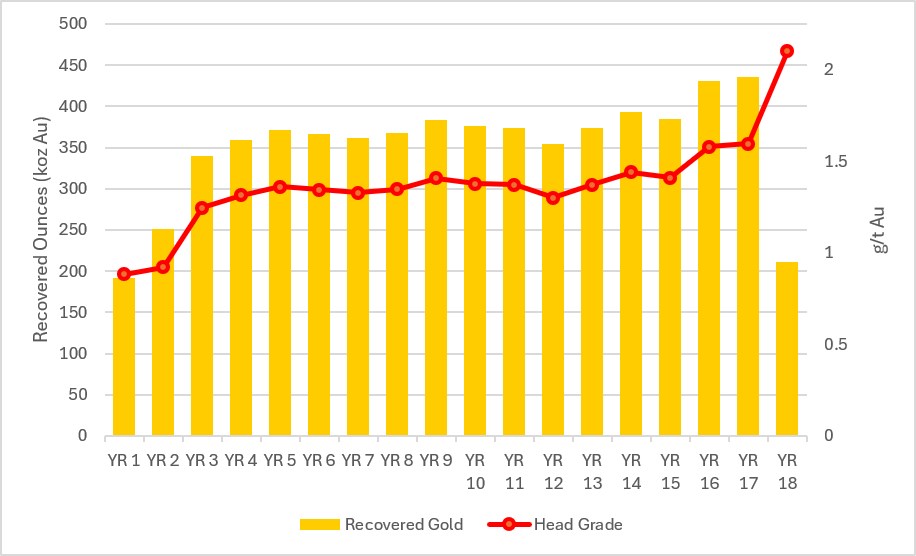
Figure 3. Combined O/P and U/G Recovered Gold Ounces and Head Grade
To view an enhanced version of this graphic, please visit:
https://images.newsfilecorp.com/files/8712/310402_eb3797a68466e877_004full.jpg
Mining
Open Pit Mining
Wenot is a previously mined, near-surface gold deposit, well-suited to conventional open pit truck-and-shovel mining methods. Owner-operated mining is assumed. The PEA mine plan contemplates approximately two years of pre-production followed by 18 years of commercial production.
The ultimate "superpit" is approximately 2.4 km long, 1.1 km wide, and 550 m deep, with mining progressing through three phases to achieve the final pit limits. The mine plan is based on a conventional bulk mining approach using large-scale equipment, including four 20 m³ hydraulic shovels, three 25 m³ wheel loaders, and seventy-four 135 t haul trucks, over the life of the mine.
Total material movement from the open pit over the mine life is estimated at 922.5 Mt, including mineralized material and waste, with an average LOM strip ratio of 5.9:1. Strategic and focused drilling over the past couple years has led to the identification of additional and expanded gold zones within the Wenot deposit, that resulting in a lower strip ratio than anticipated.
The average mining rate is approximately 126 ktpd, peaking at 175 ktpd. The open pit production schedule is designed to provide consistent feed to the processing plant at an annualized rate of 9.125 Mt, equivalent to 25,000 tpd, in coordination with planned underground production and while prioritizing higher-grade feed where practical.
Pit optimization and mine planning were conducted using conventional industry-standard methods to define the mineable quantities at a gold price of
Underground Mining
The PEA envisions the Gilt deposit to be mined using underground mining methods. The deposit is a series of horizontal lenses of mineralized rock stacked vertically within an intrusive stock and extending into the surrounding volcanic rocks. The lenses vary in thickness from 1.0 m to greater than 20.0 m. The Gilt underground deposit is separated from the upper past-producing open pit by a late diabase dyke that dips to the south at approximately 24 degrees.
Based on the type of deposit, drift-and-fill mining was selected as the preferred mining method. Alternative mining methods, including longhole open stoping will be evaluated in greater detail in future studies. The deposit has sufficient strike length to support primary, secondary, and tertiary development in the stoping areas.
The mine plan provides access via twin ramps from surface that will be used for personnel and material movement. Ventilation will be provided by two vent raises for exhaust, using the ramp as the intake. Development and production material handling was assumed to be done using a railveyor system, and haul trucks. Production will be drilled using face drills (Jumbos). Cemented paste fill will be the backfill method.
The target mining rate from the underground is 4,000 tpd. Underground development will commence in Year 1 of plant operations, and production will commence in Year 3. A total of 22.6 Mt grading 2.98 g/t Au containing 2.164 Moz Au will be extracted from the underground mine, for 2.012 Moz Au recovered.
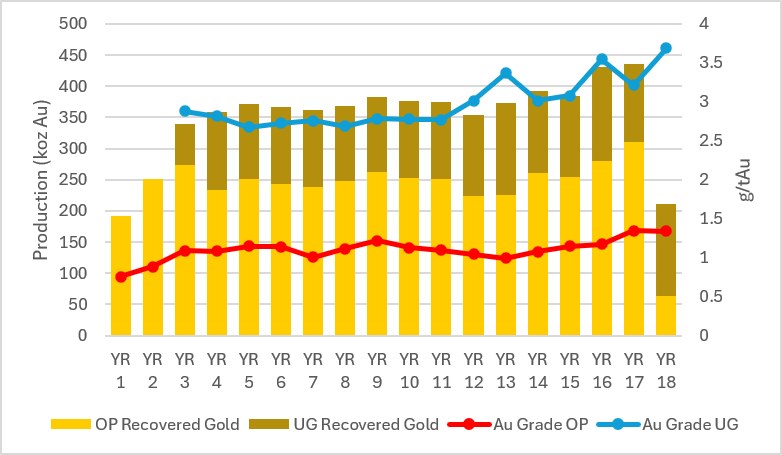
Figure 4. Recovered Gold and Gold Grades from OP and UG
To view an enhanced version of this graphic, please visit:
https://images.newsfilecorp.com/files/8712/310402_eb3797a68466e877_005full.jpg
Processing
The PEA anticipates a conventional 25,000 tpd processing facility based on a standard metallurgical flowsheet, consisting of grinding, gravity separation, and carbon-in-leach ("CIL") followed by detox to produce gold dore.
Primary crushing would be via a gyratory crusher followed by a Semi Autogenous Grinding (SAG) and Ball Mill (BM) circuit with gravity concentration. Tailings will be treated and used either as an ingredient for paste fill or sent to a tailings storage facility. The processing plant is expected to operate for 18 years in the current mine plan. Average gold recovery is estimated at
Power
A total of 60 MW of installed capacity is planned for the initial phase of the Project, with an additional 14MW of capacity required to support the underground mine and other associated systems. The Project's base case scenario assumes all power is generated on-site using heavy fuel oil (HFO) generators.
The proposed Amaila Falls hydropower project lies approximately 80 km west of the Omai property, with the proposed transmission line to run within 20 km of the Omai site. The Government of Guyana recently closed a tender process and development awaits funding. A 300 MW gas-to-energy plant is under construction near Georgetown. A second phase of the development envisions a future compressed natural gas plant (CNG). Timelines for these projects may not initially meet Omai's timelines. Alternative power supply options will be monitored and considered in future studies.
Operating Costs
LOM operating costs are estimated at
Table 4. Operating Costs1,3
| Operating Cost Table | |||
| LOM (US$ million) | Unit Costs (US$/t processed) | Unit Costs (US$/oz Au) | |
| Mining Costs - OP | 3,026 | 22.57 | 701 |
| Mining Costs - UG | 1,825 | 80.82 | 907 |
| Combined Mining Costs | 4,851 | 30.96 | 767 |
| Processing Cost | 2,251 | 14.37 | 356 |
| G&A Cost | 723 | 4.25 | 105 |
| Total Site Costs | 7,825 | 49.58 | 1,228 |
| Dore Transport & Refining | 44 | 0.28 | 7 |
| Royalties | 1,456 | 10.74 | 266 |
| Total Operating Costs | 9,325 | 60.60 | 1,501 |
| Sustaining Capital | 636 | 4.06 | 100 |
| Closure and Reclamation | 41 | 0.26 | 6 |
| All in Sustaining Costs (AISC) | 10,000 | 64.92 | 1,608 |
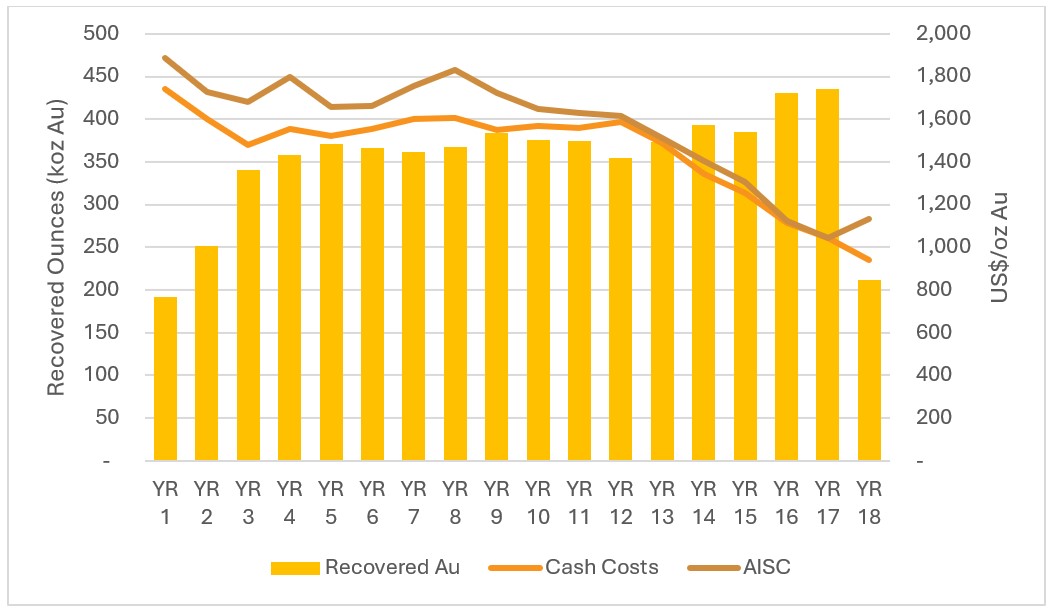
Figure 5. Annual Gold Production and Operating Cost Per Ounce (Cash Costs and AISC)
To view an enhanced version of this graphic, please visit:
https://images.newsfilecorp.com/files/8712/310402_omaifig5.jpg
Capital Costs
The initial capital costs are estimated at
The main components of the
Table 5. Capital Costs
| Capital Costs Table | |
| Initial Capital Costs | Amount (US$ millions) |
| Direct Costs | |
| OP Mining | 275 |
| Process Plant | 394 |
| Infrastructure | 177 |
| Total Direct Costs | 845 |
| Indirect Costs | 296 |
| Total Direct and Indirect Costs | 1,141 |
| Contingency | 285 |
| Total Initial Capital | 1,427 |
| Growth Capital - UG Mining | 293 |
| Sustaining (Op + UG) | 636 |
| Reclamation and closure | 41 |
| Total Capital Costs | 2,396 |
On-Site Infrastructure
Infrastructure for the PEA comprises a 25,000 tpd process plant, power plant, assay laboratory, and a 500-person permanent camp to support mining operations. Additional facilities will include administrative offices, warehouses, maintenance shops, and medical and environmental services.
Relocation of the current airstrip will be required due to proximity to the Wenot pit. Costing includes support for fuel storage and airstrip relocation.
Tailings and Water Management
Tailings will be deposited in four locations over the LOM. During the initial years of operation, the previously mined-out Fennel pit (at the Gilt deposit) will be used to store tailings. A portion of Fennel pit will be maintained for water management. The existing tailings storage facility referred to as TSF2, which was used at the end of previous mining activities, was evaluated and deemed suitable for use as an initial TSF. Capacity remains for two, five-metre raises that augment the existing dams, consistent with the original design. Later in the LOM, this facility will be expanded in accordance with geotechnical, water catchment, and environmental criteria to form TSF3. The location of this expansion has already been identified. The design will consider water management strategies for both the operational and closure phases. Ongoing technical studies and field investigations will inform future refinement of location and design. Some tailings will also be converted into paste backfill for use at the Gilt underground.
The water management system envisioned for the PEA separates contact water from non-contact water. Non-contact water is redirected away from site infrastructure using diversion channels. Contact water, primarily from the pit and water storage facility will be collected in a central pond and treated as required prior to discharge and usage.
Workforce
The workforce for the mine is expected to be sourced primarily locally. Local populations have extensive experience with and knowledge of open pit mining. The peak direct workforce during operations is anticipated to be approximately 900 personnel, including open pit and underground mining, processing plant, and associated site facilities personnel. During construction, indicative estimates show that the workforce could total from 1,500 to 2,000 personnel.
Next Steps
The Omai project continues to be advanced as expeditiously as possible with the following activities planned or underway:
Geological work includes:
- Ongoing 50,000m drill program with five drills working
- Infill drilling of the Wenot open pit Mineral Resource to upgrade the large Inferred mineral resource and also expand the MRE
- Recent completion of a 1400m long hole demonstrating the down dip extension of the Gilt intrusion that hosts the Gilt deposit, with assays pending
- Further drilling to test the Camp Zone as well as the east and west extension areas of the Wenot deposit
- Preparations to update the MRE prior to year end, incorporating current drilling plus 77 drill holes already completed since the April 2026 MRE, with many assays still pending
Engineering & permitting work includes:
- Equipment for de-watering is arriving in country with site support infrastructure near completion; de-watering expected to commence shortly
- Next phase of metallurgical work is underway, with large-diameter core samples from Gilt being processed for comminution test work to further refine the processing plant flowsheet
- Refinement of the plant site location followed by condemnation drilling, and geotechnical and hydrogeological data collection programs
- Steps towards environmental permitting continue
- Continued engagement with communities and government
Technical Report
The effective date of the PEA is July 31st , 2026, and an NI 43-101 technical report relating to the PEA will be filed on SEDAR+ (www.sedarplus.ca) within 45 days of this news release.
Qualified Persons
The preliminary economic assessment was prepared by SLR Consulting (Canada) Ltd. (SLR). The technical content in this press release has been reviewed by the following qualified persons (QP): David M. Robson, P.Eng., Goran Andric, P.Eng., Jeff Sepp, P.Eng., Linda Dufour, P.Eng., Stephan Theben, Dipl.-Ing. SME RM, and Alan J. San Martin, P.Geo.
Elaine Ellingham, P.Geo., is a Qualified Person (QP) under National Instrument 43-101 "Standards of Disclosure for Mineral Projects" and has reviewed and approved the technical information contained in this news release. Ms. Ellingham is a director and officer of the Company and is not considered to be independent for the purposes of National Instrument 43-101.
CONFERENCE CALL DETAILS
The Company will host a conference call to discuss the results at 2:15 pm ET / 11:15 am Pacific Time on Wednesday August 19, 2026.
To join Omai Gold's "Preliminary Economic Assessment Call & Webinar", join the webinar at:
https://www.c-meeting.com/web3/joinTo/34Q4YNR8YNRRUM/hY_gH6T1ZDNM4C1oHYzeZA or
Participate by Telephone:
Canada/USA Toll Free: 1-877-270-2148 or International Toll: +1-647-265-7649. Participants should dial in 5-10 min prior and ask to be joined into the Omai Gold Mines call.
A webinar replay will be available for three months.
ABOUT OMAI GOLD
Omai Gold Mines Corp. is a Canadian gold exploration and development company focused on rapidly expanding the two orogenic gold deposits at its
In April 2026, the Company announced an updated NI 43-101 Mineral Resource Estimate7 (MRE) which included expansions to both the Wenot Deposit and Gilt Deposit. Most significantly, the Wenot Indicated MRE increased
Five diamond drills are working on a 50,000m drilling program for 2026: at Wenot the focus is to further test the limits of the deposit, including both east and west, and to work to convert the large Inferred MRE to Indicated. Additional drilling will continue to explore certain known gold occurrences for possible near-surface higher-grade satellite deposits. The Omai Gold Mine produced over 3.7 million ounces of gold from 1993 to 20058, ceasing operations when gold was below US
For further information, please see our website www.omaigoldmines.com or contact:
Elaine Ellingham, P.Geo.
President & CEO
elaine@omaigoldmines.com
+1.416.473.5351
Neither the TSX Venture Exchange nor its Regulation Services Provider (as that term is defined in the policies of the TSX Venture Exchange) accepts responsibility for the adequacy or accuracy of this release.
Non-GAAP Financial Measures
Certain financial measures referred to in this news release are not measures recognized under IFRS and are referred to as non-GAAP financial measures or ratios. These measures have no standardized meaning under IFRS and may not be comparable to similar measures presented by other companies. The definitions established and calculations performed by Omai Gold are based on management's reasonable judgment and are consistently applied. These measures are intended to provide additional information and should not be considered in isolation or as a substitute for measures prepared in accordance with IFRS.
The non-GAAP financial measures used in this news release and common to the gold mining industry are all-in sustaining cost per ounce of gold sold, and free cash flow. All-in sustaining cost per ounce of gold sold and free cash flow are non-GAAP financial measures or ratios and have no standardized meaning under IFRS Accounting Standards ("IFRS") and may not be comparable to similar measures used by other issuers. As the Omai Project is not in production, the Company does not have historical non-GAAP financial measures nor historical comparable measures under IFRS, and therefore the foregoing prospective non-GAAP financial measures or ratios may not be reconciled to the nearest comparable measures under IFRS.
Cash operating cost ($ per oz sold) is calculated by dividing total cash costs by LOM volume of gold ounces projected to be produced on a payable basis. AISC ($ per oz sold) is calculated by dividing AISC by LOM volume of gold ounces projected to be produced on a payable basis. EBITDA represents earnings before interest, income taxes and depreciation, depletion and amortization.
Cautionary Note Regarding Forward-Looking Statements
This press release contains statements that constitute "forward-looking information" (collectively, "forward-looking statements") within the meaning of the applicable Canadian securities legislation. Forward-looking statements contained in this press release include, without limitation, statements regarding the results, conclusions, projections, assumptions and economic and operating parameters of the PEA for the Omai Gold Project, including projected LOM, throughput, capital and operating costs, metal recoveries, payable production, NPV, IRR, annual EBITDA, cash costs, AISC and payback period and sensitivities thereto; statements regarding metal price assumptions; statements related to projected costs and Capex; timing of filing of the technical report for the 2026 PEA; statements related to potential social and economic benefits to the local community and Guyana as a result of development of the Omai Gold Project; statements relating to the Omai Gold Project as a profitable project for the Company; statements related to the Company's plans for power, water and tailings at the Omai Gold Project; statements relating to exploration, drilling and mineralization on the Company's Omai Gold Project; the interpretation of the results and benefits of the drilling program; future drilling and the timing and expected benefits thereof; potential resource expansion; assay results; the interpretation of drilling and assay results, the extent of mineralization and the discovery of zones of high-grade gold mineralization; future exploration and the focus and timing of same; the merits of the Omai Gold Project; future press releases by the Company; and funding of the ongoing drilling program. Although the Company believes that such statements are reasonable, it can give no assurance that such expectations will prove to be correct. Forward-looking statements are statements that are not historical facts; they are generally, but not always, identified by the words "expects", "plans", "anticipates", "believes", "interpreted", "intends", "estimates", "projects", "aims", "suggests", "indicate", "often", "target", "future", "likely", "encouraging", "pending", "potential", "goal", "objective", "opportunity", "prospective", "possibly", "preliminary", and similar expressions, or that events or conditions "will", "would", "may", "can", "could" or "should" occur, or are those statements, which, by their nature, refer to future events. In making the forward-looking statements contained in this press release, the Company has made certain assumptions, including, without limitation, assumptions regarding the accuracy of the MRE underlying the 2026 PEA; the validity of the technical, economic and operating assumptions used in the 2026 PEA (including assumed metal prices, exchange rates, recoveries, Capex and operating costs, mining and processing methods, throughput, ramp-up profile, ownership of legal title, capacity to store tailings, mine life and tax and royalty regimes); the availability of financing on acceptable terms to fund further development; the timely receipt of required permits and regulatory approvals; the absence of material adverse changes in commodity prices, capital markets and the regulatory and political environment; and the continued availability of qualified personnel and key contractors.
The Company cautions that forward-looking statements are based on the beliefs, estimates and opinions of the Company's management on the date the statements are made, and they involve a number of risks and uncertainties. Consequently, there can be no assurances that such statements will prove to be accurate and actual results and future events could differ materially from those anticipated in such statements. Such factors include, but are not limited to: the inherently preliminary nature of a preliminary economic assessment, including its reliance on inferred mineral resources that are considered too speculative geologically to have economic considerations applied to them and that may not ultimately be upgraded to higher-confidence categories or to mineral reserves; the risk that mineral resources are not mineral reserves and do not have demonstrated economic viability; risks that the assumptions underlying the PEA, including capital and operating cost estimates, metal recoveries and metal prices, availability of water and power, prove to be inaccurate; sensitivity of project economics to changes in commodity prices, exchange rates, capital costs and operating costs; the risk that further studies (including pre-feasibility and feasibility studies) yield results that differ materially from the PEA, or that mineral reserves are not ultimately established; the Company's ability to obtain financing on acceptable terms or at all; delay or failure to obtain required permits, regulatory approvals or surface rights required to advance the Omai Gold Project; environmental, social, taxation, title, legal, political, market, infrastructure and other risks affecting the development of the Omai Gold Project; risks relating to exploration and development of mineral properties generally; and general business, economic, competitive, political and social uncertainties. Except to the extent required by applicable securities laws and the policies of the TSX Venture Exchange, the Company undertakes no obligation to update these forward-looking statements if management's beliefs, estimates or opinions, or other factors, should change. The reader is urged to refer to the Company's most recent Management's discussion and Analysis, publicly available through the Canadian Securities Administrators' System for Electronic Document Analysis and Retrieval (SEDAR+) at www.sedarplus.ca for a more complete discussion of such risk factors and their potential effects.
Cautionary Note Regarding Mineral Resource Estimates
Until mineral deposits are actually mined and processed, Mineral Resources must be considered as estimates only. Mineral Resource Estimates that are not Mineral Reserves have not demonstrated economic viability. The estimation of Mineral Resources is inherently uncertain, involves subjective judgement about many relevant factors and may be materially affected by, among other things, environmental, permitting, legal, title, taxation, socio-political, marketing, or other relevant risks, uncertainties, contingencies and other factors described in the Company's public disclosure available on SEDAR+ at www.sedarplus.ca. Inferred Mineral Resource in the MRE have a lower level of confidence than that applied to an Indicated Mineral Resource and must not be converted to a Mineral Reserve. It is reasonably expected that the majority of the Inferred Mineral Resource could be upgraded to an Indicated Mineral Resource with continued exploration. The accuracy of any Mineral Resource Estimates is a function of the quantity and quality of available data, and of the assumptions made and judgments used in engineering and geological interpretation, which may prove to be unreliable and depend, to a certain extent, upon the analysis of drilling results and statistical inferences that may ultimately prove to be inaccurate. Mineral Resource Estimates may have to be re-estimated based on, among other things: (i) fluctuations in mineral prices; (ii) results of drilling, and development; (iii) results of future test mining and other testing; (iv) metallurgical testing and other studies; (v) results of geological and structural modeling including block model design; (vi) proposed mining operations, including dilution; (vii) the evaluation of future mine plans subsequent to the date of any estimates; and (viii) the possible failure to receive required permits, licenses and other approvals. It cannot be assumed that all or any part of a "Inferred" or "Indicated" Mineral Resource Estimate will ever be upgraded to a higher category. The MRE disclosed in this news release were reported using Canadian Institute of Mining, Metallurgy and Petroleum Definition Standards for Mineral Resources and Mineral Reserves in accordance with National Instrument 43-101- Standards of Disclosure for Mineral Projects of the Canadian Securities Administrators.
1 AISC is the sum of operating costs, off-site costs, royalty payments, and sustaining capital costs, divided by payable gold ounces produced. Refer to the "Non-GAAP Financial Measures" section of this news release.
2 Cumulative after-tax cash flows are defined as gross revenues less royalty payments, pre-production capital costs, operating costs, sustaining and growth capital costs, taxes, and reclamation and closure costs.
3 Average cash operating cost per ounce is calculated inclusive of open pit and underground mining costs; treatment, transport and refining costs; processing and surface costs; and G&A and other costs. These metrics are calculated on a payable gold ounce basis.
4 EBITDA is defined as earnings before interest, income taxes and depreciation, depletion and amortization. Free cash flow is defined as gross revenues less royalty payments, pre-production capital costs, operating costs, sustaining and growth capital costs, taxes, and reclamation and closure costs.
5 Sensitivities are applied only to the financial model; pit selection, cut-off grade and processing schedules remain based on a
6 See news release dated April 14, 2026 available on www.sedarplus.ca and on the Company's website at www.omaigoldmines.com.
7 Omai Gold Mines news release titled "Omai Gold Increases Indicated Mineral Resources to 2.5 Moz Au at2.04 g/t Au (38.1 Mt) and Inferred to 5.5 Moz Au at 1.59 g/t Au (106.6 Mt) with Expansion of Wenot and Gilt Deposits" dated April 14, 2026.
8 Past production at the Omai Mine (1993-2005) is summarized in several Cambior Inc. documents available on www.sedarplus.ca, including March 31, 2006 AIF and news release August 3, 2006.

To view the source version of this press release, please visit https://www.newsfilecorp.com/release/310402
FAQ
AI-generated questions and answers. How Rhea-AI works. Not financial advice.