STOCK TITAN

Primerica Household Budget Index™: Middle-Income Households'; Purchasing Power Reaches Break-Even Level

Rhea-AI Impact
(Low)
Rhea-AI Sentiment
(Neutral)
Tags
Rhea-AI Summary
Primerica, Inc. (NYSE: PRI) announced the release of the Primerica Household Budget Index™ (HBI™), showing a 100.5% average purchasing power for middle-income households in November 2023, up from 99.1% in October and 93.7% a year ago.
Positive
  • Middle-income households saw a 7.4% increase in purchasing power compared to a year ago
  • Steady gains in purchasing power were recorded between 2014 and 2020, with a peak of 105.1% in November 2020
  • The HBI™ data showed modest improvements in spending power in November 2023
Negative
  • Middle-income households experienced an average cumulative budget deficit of nearly $2,500 since 2021 due to increased costs of necessity items
  • The index reached a post-pandemic low of 86.7% in June 2022 due to increasing inflation

The recent uptick in the Primerica Household Budget Index (HBI) to 100.5% signals a marginal improvement in the purchasing power of middle-income households. This increase suggests that wage growth is potentially starting to align with or exceed the cost of living, which has been a significant concern for this demographic. The fact that the HBI has surpassed its baseline for the first time since the pandemic indicates a positive trend in economic recovery for middle-income families.

However, the historical context provided by the HBI reveals that the financial position of these households is still not as robust as it could have been without the pandemic's impact. The cumulative budget deficit and the increase in credit card debt due to inflation outpacing income growth are critical factors to consider. These financial strains may have long-term implications for consumer spending, savings rates and credit health, potentially affecting broader economic conditions.

The incremental rise in the HBI reflects a potential easing of inflationary pressures, particularly with the noted decrease in gasoline and food prices. For investors, this development can be interpreted as a sign of stabilizing consumer confidence, which may translate into steady consumer spending—a key driver of economic growth. Companies operating in the consumer goods and services sectors might expect a more favorable demand environment.

Furthermore, the historical data provided by the HBI, including the peak in November 2020 and the subsequent decline, offers valuable insights into consumer financial health trends. This information can aid in forecasting future consumer behavior patterns, which is crucial for businesses in planning their inventory, pricing strategies and marketing campaigns. It is also pertinent for investors monitoring sectors sensitive to consumer spending, such as retail, automotive and housing.

The HBI serves as a barometer for the financial health of middle-income households, a segment that constitutes a significant portion of the consumer market. The observed improvements in the HBI suggest that middle-income households might be approaching a position where discretionary spending could see a resurgence. This prospect is particularly relevant for businesses that target this demographic with non-essential goods and services.

Despite the positive movement, the index highlights the lingering effects of the pandemic on household finances. Companies should remain cognizant of the varying recovery rates among consumers. Marketing strategies and product offerings may need to be tailored to accommodate a consumer base that is still managing the repercussions of the pandemic, such as increased debt levels and depleted savings. Tailoring financial products and services to assist consumers in debt management and savings could be an area of growth.

Spending power improvements a positive sign, yet financial recovery still underway

DULUTH, Ga.--(BUSINESS WIRE)-- 
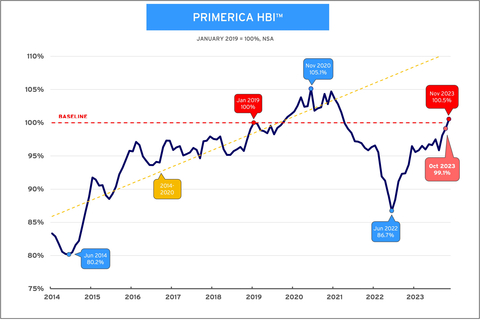
Primerica, Inc. (NYSE: PRI), a leading provider of financial services in the United States and Canada, announced today the release of the Primerica Household Budget Index™ (HBI™), a monthly index illustrating the purchasing power of middle-income households with incomes between $30,000 and $130,000. In November 2023, the average purchasing power for middle-income households was 100.5%, up from 99.1% in October. A year ago, the index stood at 93.7%.

This press release features multimedia. View the full release here: https://www.businesswire.com/news/home/20231228104840/en/

Primerica Household Budget Index™ (HBI™) - In November 2023, the average purchasing power for middle-income households was <percent>100.5%</percent>, up from <percent>99.1%</percent> in October. A year ago, the index stood at <percent>93.7%</percent>. (Graphic: Business Wire)

Primerica Household Budget Index™ (HBI™) - In November 2023, the average purchasing power for middle-income households was 100.5%, up from 99.1% in October. A year ago, the index stood at 93.7%. (Graphic: Business Wire)

“During November, a significant decrease in gasoline prices and a small decrease in food prices, accompanied by continued strength in household incomes, allowed middle-income families to stem the loss of purchasing power they have experienced for several consecutive months,” said Glenn J. Williams, CEO of Primerica. “These families have consistently indicated that the cost of living is weighing on their financial security.”

In November, HBI™ data showed middle-income households saw modest improvements in spending power. However, since 2021, driven by the increased costs of necessity items, households experienced an average cumulative budget deficit of nearly $2,500.

“So much has happened since January 2019, and for the index to finally come back to the baseline value is a welcome outcome,” said Amy Crews Cutts, Ph.D., CBE®, economic consultant to Primerica. “But it doesn’t mean that all is grand. Had the pandemic never happened, the HBI™ would likely be approximately 10% higher than it is now, there would be more savings accumulation for middle-income households, and middle-income families would not be carrying all the new credit card debt they incurred when inflation was roaring well ahead of earned income.”

HBI™ HISTORICAL BACKGROUND


The index baseline is set at January 2019 and can be thought of as when middle-income households set a budget based on their earned income at that time. Between 2014 and 2020, the HBI™ results recorded steady gains in purchasing power for middle-income families, with a peak of 105.1% in November 2020. This means that relative to January 2019, households were in a stronger financial position to pay their monthly bills because wage growth outpaced the cost of everyday goods. Increasing inflation then caused the index to plummet. In June 2022, it reached a post-pandemic low of 86.7%.


Since May of 2021, when the HBI™ dipped below 100% for the first time since the pandemic, the average middle-income household has cumulatively spent around $2,425 more than budget on basic necessities. In line with this, if the pandemic and ensuing inflation would not have been a factor, the HBI™ today would be closer to 110%.

For more information on the Primerica Household Budget Index™, visit www.householdbudgetindex.com.

About the Primerica Household Budget Index™ (HBI™)

The Primerica Household Budget Index™ (HBI™) is constructed monthly on behalf of Primerica by its chief economic consultant Amy Crews Cutts, PhD, CBE®. The index measures the purchasing power of middle-income families with household incomes from $30,000 to $130,000 and is developed using data from the U.S. Bureau of Labor Statistics, the US Bureau of the Census, and the Federal Reserve Bank of Kansas City. The index looks at the cost of necessities including food, gas, utilities, and health care and earned income to track differences in inflation and wage growth.

The HBI™ is presented as a percentage. If the index is above 100%, the purchasing power of middle-income families is stronger than in the baseline period and they may have extra money left over at the end of the month that can be applied to things like entertainment, extra savings, or debt reduction. If it is under 100%, households may have to reduce overall spending to levels below budget, reduce their savings or increase debt to cover expenses. The HBI™ uses January 2019 as its baseline. This point in time reflects a recent “normal” economic time prior to the COVID-19 pandemic.

Periodically, prior HBI™ values may be revised due to revisions in the CPI series and Consumer Expenditure Survey releases by the U.S. Bureau of Labor Statistics (BLS). Beginning with the October 2023 release of the HBI™ data, health insurance costs will no longer be included in the calculation of the HBI™ data as part of the healthcare component because of some newly acknowledged methodology that has been used by the BLS to calculate the health insurance CPI. The health insurance CPI, as calculated by BLS, does not measure consumer costs of health insurance such as the cost of premiums paid or a combination of premiums and deductibles, but rather premium values retained by health insurers we do not believe it accurately reflects consumer experiences. The healthcare component will continue to include medical services, prescription drugs and equipment. Prior published values have been adjusted to reflect this change.

About Primerica, Inc.

Primerica, Inc., headquartered in Duluth, GA, is a leading provider of financial products and services to middle-income households in North America. Independent licensed representatives educate Primerica clients about how to better prepare for a more secure financial future by assessing their needs and providing appropriate solutions through term life insurance, which we underwrite, and mutual funds, annuities and other financial products, which we distribute primarily on behalf of third parties. We insured over 5.7 million lives and had over 2.8 million client investment accounts on December 31, 2022. Primerica, through its insurance company subsidiaries, was the #3 issuer of Term Life insurance coverage in the United States and Canada in 2022. Primerica stock is included in the S&P MidCap 400 and the Russell 1000 stock indices and is traded on The New York Stock Exchange under the symbol “PRI”.

Public Relations

Gana Ahn, 678-431-9266

gana.ahn@primerica.com

Investor Relations

Nicole Russell, 470-564-6663

nicole.russell@primerica.com

Source: Primerica, Inc.

The Primerica ticker symbol on the New York Stock Exchange is PRI.

The average purchasing power for middle-income households in November 2023 was 100.5%, up from 99.1% in October and 93.7% a year ago.

The index baseline is set at January 2019, recording steady gains in purchasing power for middle-income families between 2014 and 2020, with a peak of 105.1% in November 2020.

For more information on the Primerica Household Budget Index™, visit www.householdbudgetindex.com.
Primerica Inc

NYSE:PRI

PRI Rankings

PRI Latest News

PRI Stock Data

Direct Life Insurance Carriers
Finance and Insurance
Link
Finance, Life/Health Insurance, Finance and Insurance, Direct Life Insurance Carriers
US
Duluth

About PRI

primerica’s roots date back to 1977 when the company embarked on a revolutionary crusade to transform the life insurance industry. primerica’s “buy term and invest the difference” philosophy encourages middle-income families to purchase affordable term life insurance so they can have more money to invest in their family’s future. today, primerica has expanded its crusade to address the number one financial disease facing families today: debt. primerica offers solutions to help families eliminate crippling debt from their household finances and save more of their hard-earned money for the future. primerica • serves 6 million clients in the u.s., canada, and puerto rico • more than 100,000 licensed representatives • more than 24,000 licensed mutual fund representatives — the largest sales force in north america • securities clients have nearly $25 billion in assets under management through primerica • placed in force more than $90 billion in life insurance in 2008 • an average of