STOCK TITAN

DAT Truckload Volume Index: March spot rates drop on modest volumes

Rhea-AI Impact
(Low)
Rhea-AI Sentiment
(Neutral)
Tags
Rhea-AI Summary
DAT Truckload Volume Index: March spot rates drop on modest volumes. Spot truckload rates continued to slide in March as demand for trucking services moved toward typical seasonal levels. Van and reefer rates fell, while flatbed rates rose slightly. Contract rates made gains, with the margin between spot and contract rates increasing.
Positive
  • The DAT Truckload Volume Index (TVI) increased modestly for all three equipment types compared to February: Van TVI: 260, up 4.0%, Refrigerated TVI: 200, up 2.6%, Flatbed TVI: 242, up 4.4%.
  • National average spot van and reefer rates fell for the third straight month, with van rate averaging $2.01 per mile (down 6 cents from February) and reefer rate at $2.35 per mile (down 8 cents). Flatbed rate rose slightly to $2.50 per mile.
  • Line-haul rates for vans, reefers, and flatbeds also saw changes, with van rate at $1.55 per mile (down 5 cents from February), reefer rate at $1.85 per mile (down 7 cents), and flatbed rate at $1.95 per mile (up 2 cents).
  • Contract rates for van and reefer freight declined, with benchmark contract rates at $2.48 and $2.86 per mile, respectively. Flatbed rate gained to $3.18 per mile. The margin between spot and contract rates increased for all three equipment types, indicating more pricing power for motor carriers.
Negative
  • None.

The recent report by DAT Freight & Analytics showcases a nuanced picture of the truckload industry. What stands out is the contrast between spot and contract rates. Spot rates are somewhat of a real-time indicator of supply and demand in the freight market, so their decline across vans and reefers suggests a softening in immediate demand or an increase in available capacity. However, this should be contextualized within typical seasonal patterns, which can result in fluctuations. The modest increment in the Truckload Volume Index (TVI) for all equipment types is positive, though expected, given the additional shipping days in March. What investors should pay attention to is the widening margin between spot and contract rates, implying a shift in pricing power away from carriers in the spot market. This may impact profit margins for companies operating in this space. The data suggests a short-term challenge for spot market-focused operators but could signal longer-term contractual stability for those with diversified portfolios, balancing spot and contract freight.

From an operational perspective, the decline in spot rates accompanied by moderate volume gains is quite revealing about current market conditions. Typically, increasing volumes would suggest higher spot rates, yet the inverse relationship here indicates an efficiency or oversupply tilt in the market. Keep an eye on fuel surcharges; they're a significant portion of the line-haul rates and can deeply affect profit margins. For companies involved in reefer and van logistics, the dip in rates might be concerning if it reflects a trend rather than a seasonal adjustment. For flatbeds, the slight increase in rates despite a year-over-year drop suggests resilience, perhaps due to ongoing construction projects or industrial demand. Strategically, companies that have hedged their exposure by locking in contract rates may find themselves better insulated against market volatility. The trucking industry's dynamics are important indicators of broader economic health, so investors should track these shifts closely, as they could be precursors to wider economic trends.

BEAVERTON, Ore.--(BUSINESS WIRE)-- Spot truckload rates continued to slide in March as demand for trucking services moved toward typical seasonal levels, reported DAT Freight & Analytics, which operates the DAT One online freight marketplace and DAT iQ data analytics service.

(Graphic: DAT Freight & Analytics)

(Graphic: DAT Freight & Analytics)

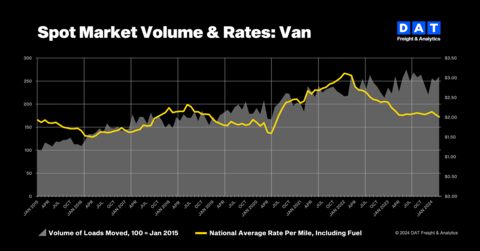
The DAT Truckload Volume Index (TVI), an indicator of loads moved in a month, increased modestly for all three equipment types compared to February:

  • Van TVI: 260, up 4.0%
  • Refrigerated TVI: 200, up 2.6%
  • Flatbed TVI: 242, up 4.4%

Volumes typically increase from February to March, which had two more shipping days this year. “The decline in van and reefer spot rates coincided with the demand for truckload services picking up marginally toward the end of the month,” said Ken Adamo, Chief of Analytics, DAT Freight & Analytics. “There were no big swings or signs that spot-market volumes or capacity will change beyond what we expect from produce, construction materials, and summer retail goods starting to move.”

Van and reefer rates fell

The national average spot van and reefer rates fell for the third straight month.

  • The van rate averaged $2.01 per mile, down 6 cents compared to February and 15 cents lower year over year.
  • The reefer rate fell 8 cents to $2.35 a mile, down 15 cents year over year.
  • The flatbed rate rose 1 cent to $2.50 a mile, down 21 cents year over year.

Line-haul rates subtract an amount equal to an average fuel surcharge (46 cents per mile for vans, 50 cents for reefers, and 55 cents for flatbeds). The line-haul van rate averaged $1.55 per mile, down 5 cents compared to February, and the average reefer rate was $1.85 a mile, down 7 cents month over month. The average line-haul flatbed rate was $1.95, up 2 cents month over month.

Contract rates made gains

Rates for contracted truckload freight declined for van and reefer freight. The DAT iQ benchmark contract van and reefer rates dipped 3 cents to $2.48 and $2.86 a mile, respectively. The flatbed rate gained 4 cents to $3.18.

The margin between spot and contract rates increased for all three equipment types. It was 47 cents for van freight, 51 cents for reefers, and 68 cents for flatbeds. A lower spread typically indicates more pricing power for motor carriers.

About the DAT Truckload Volume Index

The DAT Truckload Volume Index reflects the change in the number of loads with a pickup date during that month. A baseline of 100 equals the number of loads moved in January 2015, as recorded in DAT RateView, a truckload pricing database and analysis tool with rates paid on an average of 3 million loads per month.

DAT benchmark spot rates are derived from invoice data for hauls of 250 miles or more with a pickup date during the month reported. Line-haul rates subtract an amount equal to an average fuel surcharge.

About DAT Freight & Analytics

DAT Freight & Analytics operates the largest truckload freight marketplace in North America. Shippers, transportation brokers, carriers, news organizations, and industry analysts rely on DAT for trends and data insights based on more than 400 million freight matches and a database of $150 billion in annual market transactions.

Founded in 1978, DAT is a business unit of Roper Technologies (Nasdaq: ROP), a constituent of the Nasdaq 100, S&P 500, and Fortune 1000.

Annabel Reeves

Corporate Communications, DAT Freight & Analytics

PR@dat.com / 503-501-0143

Stephen Petit

SiefkesPetit Communications

425-443-8976

Source: DAT Freight & Analytics

The Van TVI for March was 260, up 4.0% compared to February.

The national average spot van rate in March was $2.01 per mile, down 6 cents from February.

The line-haul reefer rate in March was $1.85 per mile, down 7 cents from February.

Contract rates for flatbed freight gained 4 cents to $3.18 per mile.

The margin between spot and contract rates for reefers increased to 51 cents in March.

A lower spread typically indicates more pricing power for motor carriers.
Roper Technologies Inc

NASDAQ:ROP

ROP Rankings

ROP Latest News

ROP Stock Data

Instruments and Related Products Manufacturing for Measuring, Displaying, and Controlling Industrial Process Variables
Manufacturing
Link
Electronic Equipment/Instruments, Manufacturing, Electronic Technology, Producer Manufacturing, Instruments and Related Products Manufacturing for Measuring, Displaying, and Controlling Industrial Process Variables , Industrial Conglomerates
US
Sarasota

About ROP

roper technologies is a constituent of the s&p 500, fortune 1000, and the russell 1000 indices. roper designs and develops software (both software-as-a-service and licensed), and engineered products and solutions for healthcare, transportation, food, energy, water, education and academic research markets worldwide. additional information about roper is available on the company’s website at www.ropertech.com.