
Séché Environnement: Consolidated results at December 31, 2021




Confirmed strong business in main regions
Significant increase in operating profitability
Doubling in net income
Reinforced financial robustness
Roadmap through to 2025
Organic growth: contributed revenue close to
Profitability: EBITDA between
Flexibility: leverage < 3x EBITDA mid-cycle if acquisitions
CHANGÉ,
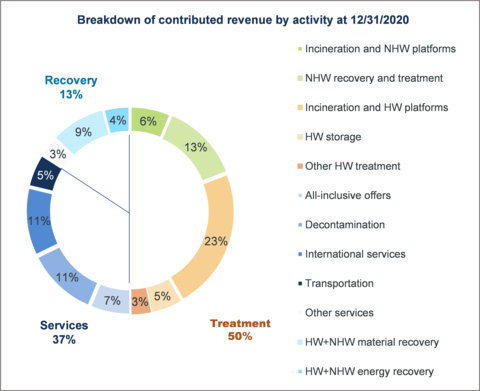
APPENDIX 5 - NEW BREAKDOWN OF BUSINESS ACTIVITIES FORMER PRESENTATION (Photo: Séché Environnement)
Séché Environnement (Paris:SCHP):
Main objectives met or exceeded one year ahead of schedule
Commercial performance:
Contributed revenue:
Operational performance:
EBITDA:
COI:
Profit performance:
Net Income
Financial performance:
Free operational cash flow:
Financial leverage ratio: 2.7x, -0.4x
Dividend proposed:
Outlook for 2022
Growth in contributed revenue:
-
Scope effect stemming from the integration of Séché Assainissement on
January 1, 2022 and 12-month contribution from Spill Tech
-
Organic growth based on H2 2021 trends, with market effects remaining positive in
France and a continued improvement internationally
EBITDA margin (EBITDA / contributed revenue) confirmed for at least the level reached in 2021
CAPEX: similar to 2021 given development investments
Financial leverage ratio stable at 2.7x EBITDA ex. acquisitions
At the Board of Directors meeting held on
“Séché Environnement’s excellent commercial, operational, financial and non-financial performances in fiscal 2021 once again demonstrate the quality of its positioning and the relevance of its growth strategy in the circular economy and decarbonized economy sectors.
These performances were generated by its internal and external growth strategy, policy on industrial efficiency and cost reduction, controlled investments and financial agility.
They are also a result of the constant commitment of the women and men that make up this Company. I would like to thank each of them on behalf of our Board.
Séché Environnement moved ahead with its external growth transactions in 2021. It did so internationally, with the acquisition of Spill Tech, a South African environmental emergency specialist, and in
Séché Environnement is benefiting from the lasting effects of its profitable growth strategy and in 2021 posted strong increase across all its business activities in its main scopes and an even stronger increase in operational margins.
Net income was twice as high as in 2020.
Our Group continued to improve its cash flow and financial flexibility through sold cash management. It also shored up its balance sheet by substantially lengthening the maturity of its financial debt for an improved cost, thanks to the successful issue of its first environmental impact bond.
A year ahead of schedule, it has met or even exceeded most of the objectives set in 2019 for 2022.
These performances are sustainable.
Working in sustainably buoyant and opportunity-rich markets and harnessing financial flexibility and strong cash flow, our Group is confident about its short- and long-term outlook.
For 2025, it is targeting contributed revenue, at constant scope, of nearly
Also for 2025, fully in line with the Paris Agreement on the climate and consistent with its ambitious Climate for 2030 strategy, Séché Environnement will reduce its greenhouse gas emissions by
Selected financial data
Consolidated data in €m
As of December |
2019 restated* |
2020 restated* |
2021 |
Gross change |
Contributed Revenue |
687.8 |
641.7 |
735.8 |
+ |
EBITDA |
135.4 |
137.0 |
170.3 |
+ |
% of contributed revenue |
|
|
|
|
Current Operating Income |
47.8 |
47.5 |
71.5 |
+ |
% of contributed revenue |
|
|
|
|
Net financial Income |
(17.5) |
(20.4) |
(24.1) |
+ |
Income tax |
(10.4) |
(8.4) |
(14.1) |
+ |
Share of Income of Associates |
ns |
(1.5) |
(0.9) |
|
Share of non-controlling interests |
(1.0) |
(0.1) |
(1.2) |
|
Group net income |
17.8 |
13.8 |
28.4 |
+ |
% du CA |
2, |
2, |
3, |
|
Earnings per share |
2.27 |
1.77 |
3.64 |
+ |
|
|
|
|
|
Dividend per share (€ per share) |
0.95 |
0.95 |
1.00 |
+ |
|
|
|
|
|
Recurrent operating cashflow1 |
113.2 |
110.9 |
139.9 |
+ |
Net Capex paid |
69.0 |
64.2 |
87.4 |
+ |
Free operating cashflow2 |
48.7 |
61.6 |
77.4 |
+ |
Cash and cash equivalents |
92.3 |
105.3 |
172.2 |
+ |
Net financial debt (IFRS) |
456.2 |
450.3 |
474.9 |
+ |
|
|
|
|
|
Financial leverage ratio |
3.1x |
3.1x |
2.7x |
-0.4x |
* Contributed revenue has been calculated ex. TGAP since 2021. Contributed revenue in 2019 and 2020 was recalculated to enable the comparison of data.
Summary of activity, income, and financial situation at
In fiscal 2021, Séché Environnement pursued its profitable growth momentum in buoyant markets while maintaining an opportunistic external growth strategy both internationally and in
In
This solid commercial momentum was driven by the implementation of an industrial efficiency policy that promotes the full availability of recovery and treatment tools and, with the effects of the savings plan, improves the organization's performance. Séché acquired Osis-IDF’s centers, a sanitation company in Ile-de-
The International business confirmed its return to growth in the main regions in which the Group operates, particularly in
The Group posted a significant increase in operating margins, and net income attributable to company shareholders more than doubled in relation to 2020.
Over the period, the Group controlled its net debt while maintaining an active growth investment policy, particularly in international markets.
The Group seized opportunities having emerged at the end of the year on debt markets to refinance its senior banking debt through 2023 as well as a number of bonds with the same maturity through a seven-year bond issue featuring ESG impact criteria and with a substantially reduced rate.
Underpinned by solid cash generation and improved financial flexibility, and with a considerably strengthened liquidity position and extended debt maturity, Séché Environnement is confirming its ability to actively pursue its development strategy in
Solid organic growth in main scopes
At
At constant scope, contributed revenue stood at
In 2021, Séché Environnement confirmed strong business growth in
-
In
France (72% of contributed revenue), business activity rose substantially, by9.3% to€531.7m . The Group benefited from high volumes and good price trends in its circular economy and hazard management businesses, while the Services activities confirmed their return to dynamic growth after a 2020 year hampered by the impacts of the health crisis;
-
Internationally (
28% of contributed revenue), revenue came out at€204.1m , up31.6% as reported, including a 10-month contribution of Spill Tech amounting to€34.0m .
At constant scope and exchange rates, growth in this scope was +8.8% .Europe (Mecomer),South Africa (Interwaste ) and the rest of the World (Solarca) confirmed dynamic growth, whileLatin America reached a level after the deterioration in 2020.
Operating income improved considerably relative to 2020 and 2019 alike:
-
EBITDA was
€170.3m , or23.1% of contributed revenue. It increased24.3% compared with 2020 and25.8% compared with 2019.
It includes a scope effect related to the integration of Spill Tech onMarch 1, 2021 , for€10.2m or30.0% of the subsidiary’s revenue.
At constant scope, EBITDA increased16.9% versusJune 30, 2020 . It came to22.8% of contributed revenue (versus21.3% in 2020 and19.7% in 2019).-
In
France , the Group benefited from the strong availability of its facilities, strengthened by the effects of its industrial efficiency policy, which enabled it to process increased volumes and take advantage of favorable price effects and mix effects. -
Internationally, the Group benefited from an improved trend in its businesses relative to last year, along with a particularly low cost base in regions where business remained less brisk, such as
Latin America .
-
In
-
Current operating income (COI) amounted to
€71.5m , or9.7% of contributed revenue.
COI increased50.5% compared with 2020. It includes Spill Tech's contribution of€8.6m (25.3% of the subsidiary’s revenue).
At constant scope, COI rose strongly compared with 2020, by32.4% , and compared with 2019 (+31.6% ).
Current operating profitability was9.0% of contributed revenue (7.3% in 2020 and6.9% in 2019). This major improvement mainly reflects the favorable trend in gross operating profitability in a context of controlled depreciation expenses in line with the selective investment policy;
-
Operating income came out at
€68.7m , or9.3% of contributed revenue, for a55.2% increase compared with 2020.
At constant scope, operating income totaled€60.1m , up36.0% relative to 2020 and28.7% to 2019. The trend in 2021 was driven mainly by the increase in COI.
Financial income stood at -
The trend reflects the slight decrease in the cost of gross debt (
After recognition of income tax for -
Industrial investments (ex. IFRIC 12) reached
Free operating cash flow stood at
Cash and cash equivalents totaled
Net financial debt (IFRS) was under control at
The dividend was
Recent events and outlook
Integration of Séché Assainissement (formerly Osis-IDF centers)
The eight Osis-IDF centers, the acquisition of which was announced in the third quarter of 20216 and which are now wholly-owned by Séché Environnement, were included in the consolidation scope from
The scope of the acquired activities generated revenue of approximately
Roadmap through to 2025
Drawing on its sustained growth momentum at the heart of the growing markets of the circular economy and the fight against climate change, Séché Environnement is benefiting from the lasting effects of its industrial efficiency policy.
The Group is confident in its commercial, operational and financial outlook in the short and medium term.
Outlook for 2022
Séché Environnement is basing its assumptions on a return to normal in the health situation in
In 2022, the Group will benefit from the consolidation of Séché Assainissement from
After delivering a strong performance in 2021 partly due the favorable comparison basis of H1 2021, Séché Environnement expects to continue its organic growth on trends comparable to H2 2021:
-
In
France , in its industrial and local-authority markets alike, the Group should benefit from the momentum of its activities relating to the circular economy and decarbonization. These markets are boosted by the implementation of favorable regulations and the strong level of industrial production, which is contributing to positive trends in volumes and prices.
-
Internationally, Séché Environnement is expected to continue to grow in buoyant markets. In
Italy , Mecomer should benefit from the gradual start-up of its new capacity, whileInterwaste and Spill Tech inSouth Africa should maintain a solid growth rate. Solarca has a very large order book (around€20m ), bolstering the positive outlook for this subsidiary in 2022. Latin American business is expected to trend more positively.
From an operational standpoint, Séché Environnement will continue its industrial efficiency policy, based on heightened selectivity in its investments, improving the use conditions of its facilities and optimizing its logistics structure. In addition, it will maintain its productivity efforts through its cost-cutting plan.
Gross and current operating margin should therefore at least remain at the levels seen in 2021 (excluding acquisitions).
Industrial investments are expected to remain robust, close to 2021 levels, due to planned international development investments, particularly in
The financial leverage ratio is expected to remain at the level recorded in 2021.
Roadmap to 2025
For 2025, Séché Environnement aims to achieve contributed revenue of close to
After making sustained development investments in 2022, the Group expects to return to its standard capex of around
The Group is maintaining its target of free operating cash flow generation of more than
In terms of its non-financial performance and under its 2030 climate strategy, which is aligned with the objectives of the 2017 Paris Agreement, the Group will reduce its own greenhouse gas emissions by
Results Presentation Webcast
Connection to the home page of Séché Environnement's website
In French: https://www.groupe-seche.com/fr
In English: https://www.groupe-seche.com/en
Upcoming Events
Q1 2022 Revenue:
Annual General Meeting of Shareholders:
About Séché Environnement
Séché Environnement is the leader in the treatment and recovery of all types of waste including the most complex and hazardous waste, and decontamination, protecting the environment and health. Séché Environnement is a family-owned French industrial group that has supported industrial and regional ecology for over 35 years with innovative technology developed by its R&D team. It delivers its unique expertise on the ground in local regions, with more than 100 sites around the world, including around 40 industrial sites in
Séché Environnement has been listed on Eurolist by Euronext (Compartment B) since
FINANCIAL NFORMATIONS FINANCIERES AT
(Extracts from the Report of the Board)
Comments on activity and results at
At
Reported consolidated revenue includes non-contributed revenue of
As at |
2020 |
2021 |
IFRIC 12 investments |
0.6 |
8.7 |
TGAP8 |
30.8 |
45.6 |
Non contributed Revenue |
31.4 |
54.3 |
Reported data in €m
Net of non-contributed revenue, contributed revenue totaled
At constant scope, contributed revenue amounted to
Breakdown by geographical scope
As at |
2020 |
2021 |
Gross change |
||
|
In €m |
% |
In €m |
% |
% |
Subsidiaries in |
486.6 |
|
531.7 |
|
+ |
o/w scope effect |
- |
- |
- |
- |
|
International subsidiaries |
155.1 |
|
204.1 |
|
+ |
o/w scope effect |
13.6 |
- |
34.0 |
- |
|
Total contributed revenue |
641.7 |
|
735.8 |
|
+ |
Consolidated data at current exchange rates. At constant exchange rates, contributed revenue at |
|||||
The first half of 2021 confirmed a high level of activity in
-
In
France , contributed revenue rose a considerable9.3% to€531.7m , versus€486.6m atDecember 31, 2020 .
Séché Environnement benefited from industrial markets supported by the high level of industrial production and local authorities contracts driven by the implementation of regulations related to the circular economy.
These bullish markets and strong sales momentum enabled the Group to report favorable volume and price effects, while Services activities also performed well (Large Account services, Environmental Services).
Activities related to the circular economy and hazard containment drove growth.
Revenue earned inFrance accounted for72.3% of contributed revenue atFriday, December 31, 2021 (versus75.8% one year earlier);
-
Internationally, revenue totaled
€204.1m versus€155.1 million atDecember 31, 2020 , for a31.6% increase as reported.
International revenue includes a scope effect of€34.0m , resulting from the contribution of Spill Tech, integrated onMarch 1, 2021 . It also recorded foreign exchange gains of +€1.2m , mainly due to an appreciation of the South African rand against the euro.
At constant scope and exchange rates, international revenue growth was +8.8% over the period, illustrating the return to growth in most geographical regions:-
Europe (revenue:€70.4m , up7.5% ) recorded a significant upturn in Mecomer’s activities (hazardous waste treatment inItaly ) and a good performance by Valls Quimica (chemicals recovery inSpain ) and UTM (industrial gas recovery inGermany ); -
South Africa (revenue:€67.2m , up14.5% at current exchange rates and +9.3% at constant exchange rates):Interwaste confirmed its return to normative activity levels in markets driven by the needs of major industrial clients in terms of environmental solutions at the highest international standards; -
Latin America (revenue:€14.3m , -9.3% at current exchange rates and -1.6% at constant exchange rates) stabilized in 2021 and showed some signs of recovery at the end of the year; -
Solarca in the Rest of the World (revenue:
€18.2m , up20.8% ) recorded stronger levels of activity, but the subsidiary is still being affected by restrictions on international travel in some parts of the world.
-
Revenue earned by international subsidiaries accounted for
Breakdown by activity
As at |
2020 |
2021 |
Gross change |
||
|
In €m |
% |
In €m |
% |
|
Services |
248.8 |
|
301.4 |
|
+ |
o/w scope effect |
0.1 |
- |
34.0 |
- |
- |
Circular economy, decarbonization |
218.9 |
|
243.1 |
|
+ |
o/w scope effect |
13.4 |
- |
- |
- |
- |
Hazard management |
174.0 |
|
191.3 |
|
+ |
o/w scope effect |
0.1 |
- |
- |
- |
- |
Total contributed revenue |
641.7 |
|
735.8 |
|
+ |
Consolidated data at current exchange rates. |
|||||
All activities contributed in a balanced manner to growth, with services also benefiting from the contribution of the newly consolidated Spill Tech.
Service activities recorded contributed revenue of
At constant scope and exchange rates, Services business rose a considerable
-
In
France (revenue:€174.0m , up3.8% ), the contribution of Key Accounts Services, and notably "all-inclusive offers" that meet the growing needs of clients in terms of outsourcing their sustainable development issues, and the good performance of Environmental Services (decontamination, emergency interventions);
-
Internationally (revenue:
€93.4m , +14.9% ), renewed growth for Solarca and the strong performance ofInterwaste inSouth Africa .
Service activities accounted for
Circular economy and decarbonization activities generated revenue of
-
In
France (revenue:€176.3m , up13.2% ), the good trend in material recovery and recycling businesses driven by the implementation of regulations related to the circular economy, and energy recovery activities supported, among other aspects, by the ramp up of the Osiris contract.
-
Internationally (revenue:
€66.8m , up5.8% as reported and +6.2% at constant exchange rates), strong trends in the solvent regeneration business inSpain (Valls Quimica)
Activities related to the circular economy and decarbonization accounted for
Hazard management activities generated revenue of
-
In
France , hazard management activities increased significantly, +11.1% to€181.4m .
They benefited from positive volume and price effects in line with strong trends in HW activities; with revenue of€9.9m , these activities posted a decline of -7.2% compared with 2020 as reported, but an increase of +2.6% at constant exchange rates.
-
Internationally, with revenue of
€9.9m , these activities posted a decline of -7.2% compared with 2020 as reported, but an increase of +2.6% at constant exchange rates.
This change reflects the modest performance of final waste management activities inLatin America .
Hazard management activities accounted for
Breakdown by division
As at |
2020 |
2021 |
Gross change |
||
|
In €m |
% |
In €m |
% |
|
Hazardous waste division |
405.2 |
|
483.9 |
|
+ |
o/w scope effect |
13,6 |
- |
34,0 |
- |
- |
Non Hazardous waste division |
236.5 |
|
251.9 |
|
+ |
o/w scope effect |
- |
- |
- |
- |
- |
Total contributed revenue |
641.7 |
|
735.8 |
|
+ |
Consolidated data at current exchange rates. |
|||||
The Hazardous waste division, which accounts for
At constant scope and exchange rates, the HW division’s revenue was up
-
In
France , the division brought in€333.3m in revenue, up11.7% from€298.4m in 2020.
Over the period, this division’s circular economy activities were underpinned by the good level of activity in the recycling and low-carbon energy generation businesses, with the launch of the Osiris contract. In addition, its hazard containment activities were driven by positive trends on industrial markets, both in terms of volumes and prices.
Services activities, in particular environmental services, returned to strong growth after being disrupted by the pandemic in 2020;
-
Internationally, the division's revenue totaled
€150.6m atDecember 31, 2021 (versus€106.8m a year earlier), for an increase of41.0% .
At constant scope and exchange rates, growth came out at +10.4% year on year, illustrating the good performance of most markets over the period, with the exception ofLatin America , which remained more sluggish.
The Non-Hazardous waste division, which accounted for
-
In
France , the division brought in€198.4m in revenue, up5.4% compared with 2020
This division was driven by its activities in the circular economy, boosted by the implementation of incentivizing regulations and ever tougher restrictions on waste exports, which are facilitating the sector’s good performance in terms of volumes and prices;
-
Internationally, this division’s revenue totaled
€53.6m , an increase of10.9% as reported and +5.5% at constant exchange rates. This growth reflects contrasting trends between Interwaste’s buoyant sales momentum inSouth Africa and the weaker performance inLatin America .
EBITDA
At
This increase includes a scope effect linked to the consolidation of Spill Tech over ten months, representing +
At constant scope, EBITDA totaled
The increase in EBITDA at constant scope (+
-
Volume effects and positive mix effects for +
€42.7m , mainly benefiting from treatment activities related to commercial momentum and the effects of the industrial efficiency policy;
-
Price effects of +
€22.6m , in line with the high level of treatment facilities inFrance ;
Partially offset by trends in:
-
Variable operating expenses (+
€31.2m ), in line with the increase in activity;
-
Fixed operating expenses (+
€8.2m ) of which staff expenses partly related to the strong recovery in Services activities (particularly Environmental Services - Decontamination);
-
Various expenses (insurance premiums, communication expenses …), for +
€2.8m , the period benefiting however from the decrease of certain expenses such as taxes of production.
Breakdown of EBITDA by geographical area
As at |
2020 |
2021 |
||||
In €m |
Consolidated |
|
Internnal |
Consolidated |
|
Internnal |
Revenue |
641.7 |
486.6 |
155.1 |
735.8 |
531.7 |
204.1 |
EBITDA |
137.0 |
111.3 |
25.7 |
170.3 |
132.4 |
37.9 |
% revenue |
|
|
|
23, |
24, |
18, |
Consolidated data at current exchange rates |
||||||
For each geographic scope, the main changes were:
-
In
France , EBITDA totaled€132.4m , or24.9% of contributed revenue (versus€111.4m , i.e.22.9% of contributed revenue a year earlier).
This increase is mainly attributable to:-
Favorable commercial effects in terms of volumes, waste mix and prices, in line with the good market trends in
France and the improvement in the utilization rate of facilities resulting from the industrial efficiency policy; - Controlled operating expenses, linked in particular to optimization of the logistics organization and the cost-cutting plan;
-
A
€1.5m increase in various expenses such as insurance premiums or communication expenses.
-
Favorable commercial effects in terms of volumes, waste mix and prices, in line with the good market trends in
-
Internationally, EBITDA totaled
€37.9m , or18.6% of contributed revenue. The figures include a scope effect of€10.2m related to the integration of Spill Tech.
At constant scope, EBITDA reached€27.7m , or16.4% of contributed revenue (versus€25.6m , i.e.16.5% of revenue in 2020).
This change is mainly attributable to:-
The improvement in activity levels compared to 2020 (volume and mix effects), particularly in
South Africa and at Solarca; -
Offset in part by the increase in certain operating costs in
Europe and decreased business inLatin America (particularlyPeru ) despite measures taken to reduce operating expenses.
-
The improvement in activity levels compared to 2020 (volume and mix effects), particularly in
Current operating income
At
It includes a scope effect related to the integration of Spill Tech for
At constant scope, COI rose sharply (+
Breakdown of COI by geographical perimeter
As at |
2020 |
2021 |
||||
In €m |
Consolidated |
|
Internnal |
Consolidated |
|
Internnal |
Revenue |
641.7 |
486.6 |
155.1 |
735.8 |
531.7 |
204.1 |
COI |
47.5 |
41.0 |
6.5 |
71.5 |
54.7 |
16.8 |
% Revenue |
|
|
|
|
|
|
Consolidated data at current exchange rates |
||||||
For each geographic scope, the main changes were:
-
In
France , current operating income totaled€54.7m , or10.3% of contributed revenue (versus€41.0m , or8.4% of contributed revenue one year earlier).
This good performance reflects the increase in the contribution of EBITDA inFrance (+€21.1m ) minus, in particular, the increase in depreciation charges related to the final waste storage business lines and the start of new facilities.
-
Internationally, COI totaled
€16.8m , or8.2% of revenue.
Restated for the scope effect of€8.6m related to the consolidation of Spill Tech, COI at constant scope and exchange rates amounted to€8.2m or4.8% of revenue (vs.€6.5m , or4.2% of contributed revenue in 2020).
This performance essentially reflects the improvement in international EBITDA at constant scope (+€2.0m ).
Operating income
Operating income reached
This positive trend mainly reflects the increase in COI.
This figure also included goodwill impairment totaling -
Net financial income
At
-
An increase in the cost of net debt, to -
€18.2m versus -€17.1m a year ago, following the increase in gross financial debt, with a slightly lower cost of borrowing than in the previous year, of2.76% (vs.2.79% in 2020);
-
The recognition in “Other financial income and expenses” of -
€4.4 million representing early repayment penalties on the senior bank debt maturing in 2023 and certain euro-PPs with the same maturity.
Income tax
At
-
France , -€9.7m , vs. -€7.5m a year earlier.
-
Internationally, -
€4.4m , vs. -€0.9m a year earlier, of which -€2.3m related to the Spill Tech scope.
The effective tax rate was
Share of income of associates
The share of net income of affiliates primarily comprised the Group’s share of the income of Gerep and Sogad and amounted to -
Consolidated net income
At
After booking the minority interest share in that income, comprising a loss of -
Net earnings per share amounted to
Comments on cash flow and the financial situation as at
Cash flows
Summary of the consolidated statement of cash flows
In €m as at |
2020 |
2021 |
Cashflows from operating activities |
121.4 |
142.3 |
Cashflows from investing activities |
(73.2) |
(117.6) |
Cashflows from financing activities |
(30.0) |
41.6 |
Change in cashflows of continuing operations |
18.1 |
66.2 |
Change in cashflows from discontinued operations |
ns |
- |
Change in cashflows |
18.1 |
66.2 |
During the period, the change in cash and cash equivalents rose from +
The change of +
- The increase in flows generated by operating activities: +20.9m
-
Changes in flows related to investment transactions: -
€44.4m
-
An increase in flows related to financing transactions:
€71.6m
Cash flows from operating activities
In fiscal 2021, the Group generated
This trend reflects the combined effect of:
-
The
€31.8m increase in cash flows before tax and financial expenses to€153.1m (vs.€121.3m a year earlier);
-
The -
€0.6m decline in the working capital requirement, which stood at +€11.3m at the end of 2020. This item includes a scope effect related to the consolidation of Spill Tech, for€4.3m . It also incorporates a transfer of receivables of€23.8m vs.€24.2m in 2020;
-
Net taxes paid in the amount of -
€10.1m versus -€11.2m in 2020.
Cashflows from investing activities
In €m as at December |
2020 |
2021 |
Net industrial capex recorded |
63.0 |
92.4 |
Net financial capex recorded |
0.0 |
1.2 |
Total net capex recorded |
63.0 |
93.8 |
Net industrial capex paid |
64.2 |
87.4 |
Net financial capex paid |
(0.0) |
0.8 |
Acquisition of subsidiaries – Net cashflows |
9.0 |
29,4 |
Total net capex paid |
73.2 |
117.6 |
In fiscal 2021, recorded industrial investments amounted to
-
Recurrent investments totaling
€50.4m , representing6.8% of contributed revenue (versus€43.2m in 2020, i.e.6.7% of contributed revenue).
-
Development investments totaling
€42.0m , or5.7% of contributed revenue (versus€19.8m in 2020, i.e.3.1% of contributed revenue). These mainly concern growth investments inItaly (Mecomer) and the ERP project.
Industrial investments can be broken down as follows:
-
€14.0m in category 2 “public service delegation” expenses (versus€9.8m in 2020;
-
€18.7m for energy storage and production facilities (versus€13.9m in 2020;
-
€7.6m for thermal treatment systems, platforms and other treatments (versus€6.7m in 2020;
-
€3.9m for materials recovery tools (versus€0.9m in 2020;
-
€20.0m for eco-services tools, including the vehicle fleet (versus€11.4m in 2020;
-
€16.9m for holding activities relating to information systems, regulatory investments and development investments in subsidiaries (versus€10.7m in 2020.
-
€11.3m in miscellaneous recurring investments (versus€9.8m in 2020).
Cash flows from financing activities
Total net cash relating to financing activities amounted to +
-
Flows from new borrowings:
€380.3m vs.€64.4m a year earlier. This line includes a€80m Euro PP issue inMarch 2021 and a€300m senior bond issue inNovember 2021
-
Flows from loan repayments: -
€293.8m vs. -€51.0m in 2020. These flows mainly include the early repayment of the senior bank loan maturing in 2023 and of certain euro-PP bonds
-
Interest expense: -
€15.3m vs. -€15.1m in 2020
-
Flows from dividends paid to minority interests: -
€1.1m vs. -€0.9m in 2020
-
Cash flows without gain of control: -
€2.1m vs. -€4.1m in 2020, partially representing the impact of the acquisition of an additional5% interest in Solarca
-
Change in shareholder’s equity:
€0.2m
-
Repayment of lease liabilities for -
€19.2m , including interest on leases for€2.0 million , vs. -€16.2m including interest for€1.9m a year earlier.
Debt and funding structure
Change in financial debt
In €m as at December |
2020 |
2021 |
Bank loans |
241.5 |
139.1 |
Non recourse bank loans |
29.6 |
27.0 |
Bonds |
229.3 |
425.3 |
Lease liabilities |
45.0 |
45.7 |
Miscellaneous debt |
3.1 |
2.3 |
Short-term banks borrowings |
7.1 |
7.7 |
Gross financial debt |
555.5 |
647.1 |
Cash balance |
(105.3) |
(172.2) |
Net financial debt |
450.2 |
474.9 |
o/w due in less than one year (1) |
(37.5) |
(108.1) |
o/w due in more than one year |
487.7 |
583.0 |
(1) Cash and cash equivalents are considered as less than one year |
||
Gross financial debt stood at
-
Bank debt, excluding non-recourse debt, which fell
€102.4m following the early repayment of the senior bank loan;
-
Bond debt: +
€196.0m , reflecting the balance of new issues (made in March and November) and early repayments on certain Euro PP bonds at the end of the year;
At
Net financial debt (IFRS) is under control at
Over the period, it changed as follows:
In €m |
|
|
Net financial debt at opening |
456.2 |
450.3 |
Scope effect |
- |
3.1 |
Cashflows from operating activities |
(121.3) |
(142.3) |
Net industrial capex paid |
64.2 |
87.4 |
Net financial capex paid |
9.0 |
30.2 |
Dividends |
8.3 |
8.5 |
Net interests paid (o/w interests on leases) |
17.0 |
17.3 |
Cash and cash equivalent without gain of control |
4.0 |
2.0 |
Others |
0.2 |
(0.2) |
Non cash change |
12.7 |
18.7 |
Net financial debt at closing |
450.3 |
474.9 |
Net financial investments paid include:
-
€23.9m : the fair value of the consideration transferred fromSpill Tech Group including transaction fees), as the acquired financial debt amounts to a non-cash change in net debt – scope effect – for€3.1m (excluding lease liabilities);
- For the balance: mainly the payment of the last earnout on the acquisition of Mecomer group.
The financial leverage ratio came out at 2.7x EBITDA (versus 3.3x a year earlier), illustrating significantly improved financial flexibility.
APPENDIX 1
CONSOLIDATED CASHFLOW STATEMENT
(In thousands of euros) |
|
|
|
309,079 |
324,156 |
Intangible fixed assets from under concession arrangements |
41,419 |
36,846 |
Other intangible fixed assets |
39,156 |
41,901 |
Property, plant, equipment |
313,768 |
344,847 |
Investments in associates |
180 |
50 |
Non-current financial assets |
7,209 |
11,054 |
Non-current derivatives - assets |
- |
- |
Non-current operating financial assets |
35,930 |
29,516 |
Deferred tax – assets |
23,438 |
21,447 |
Non-currents assets |
770,179 |
809,816 |
Inventories |
15,009 |
17,321 |
Trade and other receivables |
171,023 |
186,035 |
Current financial assets |
974 |
3,218 |
Current derivatives - assets |
- |
- |
Current operating financial assets |
32,103 |
36,220 |
Cash and cash equivalents |
105,265 |
172,201 |
Current assets |
324,374 |
414,996 |
Assets held for sale |
- |
- |
TOTAL ASSETS |
1,094,554 |
1,224,812 |
(in thousands of euros) |
|
|
Share capital |
1,572 |
1,572 |
Additional paid capital |
74,061 |
74,061 |
Reserves |
163,479 |
165,452 |
Net income |
13,815 |
28,384 |
Shareholder’s equity (share of the Group) |
252,927 |
269,469 |
Minority interests |
4,302 |
5,426 |
Total shareholder’s equity |
257,230 |
274,895 |
Non-current financial debt |
457,847 |
552,173 |
Non-current rental debt |
29,882 |
30,833 |
Non-current derivatives - liabilities |
0 |
0 |
Employee benefit |
16,497 |
17,178 |
Non-current provisions |
22,185 |
24,314 |
Non-current operating financial liabilities |
2,377 |
4,722 |
Deferred tax – liabilities |
6,076 |
5,383 |
Non-current liabilities |
534,865 |
634,603 |
Current financial debt |
52,647 |
49,102 |
Current rental debt |
15,161 |
14,977 |
Current derivatives - liabilities |
75 |
- |
Current provisions |
1,756 |
1,810 |
Trade payables |
115,150 |
137,343 |
Other current liabilities |
116,229 |
111,161 |
Tax liabilities |
1,440 |
922 |
Current liabilities |
302,459 |
315,314 |
Liabilities held for sale |
- |
- |
TOTAL LIABILITIES AND SHAREHOLDER’S EQUITY |
1,094,554 |
1,224812 |
APPENDIX 2
CONSOLIDATED INCOME STATEMENT
(in thousands of euros) |
|
|
Revenue |
673,076 |
790,117 |
Oher business income |
780 |
1,207 |
Income from ordinary activities |
673,856 |
791,324 |
Purchases used for operational purposes |
(85,007) |
(97,760) |
External expenses |
(240,026) |
(280,042) |
Taxes and duties |
(47,663) |
(59,021) |
Employee expenses |
(164,154) |
(184,218) |
EBITDA |
137,007 |
170,282 |
Expenses for rehabilitation and/or maintenance of sites under concession arrangements |
(12,488) |
(10,692) |
Depreciation & amortization, impairment and provisions |
(76,840) |
(86,624) |
Other operating items |
(144) |
(1,469) |
Current operating income |
47,535 |
71,496 |
Other non-current items |
(3,292) |
(2,813) |
Operating income |
44,243 |
68,684 |
Cost of net financial debt |
(17,020) |
(18,184) |
Other financial income and expenses |
(3,419) |
(5,941) |
Financial income |
(20,439) |
(24,126) |
Share of income in associates |
(1,477) |
(908) |
Income tax |
(8,404) |
(14,051) |
Net income |
13,923 |
29,599 |
o/w attribuable to minority interest |
(107) |
(1,215) |
o/w Group share |
13,815 |
28,384 |
Non-diluted per share (in euros) |
1,77 |
3,64 |
Diluted per share (in euros) |
1,77 |
3,64 |
|
|
APPENDIX 3
CONSOLIDATED CASHFLOW STATEMENT
(in thousand of euros) |
|
|
Net Income |
13,923 |
29,599 |
Share of income of associates |
1,477 |
908 |
Dividends from joint venture and associates |
- |
- |
Depreciation & amortization, impairment and provisions |
76,210 |
87,181 |
Income from disposals |
829 |
676 |
Deferred tax |
201 |
2,235 |
Other income and expenses |
3,904 |
4,018 |
Cashflows |
96,544 |
124,616 |
Income tax |
8,204 |
11,816 |
Cost of gross financial debt |
16,532 |
16,626 |
Cashflows before taxes and financial expenses |
121,279 |
153,058 |
Change in WCR |
11,310 |
(645) |
Tax paid |
(11,233) |
(10,147) |
Net cashflows from operating activities |
121,356 |
142,266 |
Investments in property, plant, equipment and intangible assets |
(66,392) |
(89,565) |
Disposals of property, plant, equipment and intangible assets |
2,171 |
2,119 |
Increase in loans and financial receivables |
(543) |
(1,207) |
Decrease in loans and financial receivables |
473 |
380 |
Takeover of subsidiaries net of cash and cash equivalents |
(9,003) |
(29,335) |
Loss of control of subsidiaries net of cash and cash equivalents |
52 |
1 |
Net cashflows from investing activities |
(73,242) |
(117,608) |
(in thousands of euros) |
|
|
Dividends paid to equity holders of the parent |
(7,412) |
(7,410) |
Dividends paid to holders of minority interests |
(861) |
(1,078) |
Capital increase or decrease by controlling company |
407 |
- |
Cash and cash equivalents without loss/gain of control |
(4,066) |
(2,077) |
Change in shareholder’s equity |
(168) |
202 |
New loans and financial debt |
64,431 |
380,261 |
Repayment of loans and financial debt |
(51,013) |
(293,842) |
Interest paid |
(15,115) |
(15,296) |
Repayment of lease liabilities and associated expenses |
(16,245) |
(19,185) |
Net cashflows from financing activities |
(30,043) |
41,575 |
Total cashflow of the period for continuing activities |
18,072 |
66,233 |
Net cashflow from discontinued activities |
(1) |
- |
TOTAL CASHFLOWS FOR THE PERIOD |
18,071 |
66,233 |
Cash and cash equivalents at the beginning of the year |
80,741 |
98,184 |
Cash and cash equivalents at the end of the year |
98,184 |
164,520 |
Effects of changes in foreign exchange rates |
631 |
(103) |
(1) o/w: |
|
|
Cash and cash equivalents |
105,265 |
172,201 |
Short term banks borrowings (current financial debt) |
(7,081) |
(7,682) |
APPENDIX 4
DEFINITION OF CONTRIBUTES REVENUE
New presentation of contributed revenue
In €m |
|
|
||
As at |
2019 |
2020 |
2021 |
|
Reported Revenue |
704.4 |
673.1 |
790.1 |
|
IFRIC 12 Revenue |
- |
0.6 |
8.7 |
|
Compensation |
16.6 |
- |
- |
|
TGAP |
30.9 |
30.8 |
45.6 |
|
Contributed Revenue |
656.9 |
641.7 |
735.8 |
|
Definitions
IFRIC 12 revenue: investments made for disposed assets, recognized as revenue and intangible assets or in financial assets in accordance with the IFRIC 12 interpretation.
Compensation: diversion compensation paid to Sénerval (net of variable cost savings on non incinerated tonnage) in 2019 to cover the costs incurred to ensure the continuity of services to local authorities during asbestos removal at the Eurométropole
TGAP:
It is slated to change between 2021 and 2025, in both very significant and very differentiated manners, leading to the recognition of:
- Non-economic revenue resulting from a significant increase in the amount of tax collected, particularly within the NHW division;
- Widely varying changes across operations, not representative of their economic developments, in particular in the treatment businesses (incineration and storage of final waste).
APPENDIX 6
APPLICATION OF REGULATION EU 2020/852
(“GREEN TAXONOMY”)
The European Taxonomy classifies economic activities with a favorable impact on the environment. The aim is to direct investment towards “green” businesses.
Business activities classified as sustainable meet at least one of the following six objectives:
- No. 1: climate change reduction
- No. 2: climate change adaptation
- No. 3: sustainable use and protection of water and sea resources
- No. 4: transition to a circular economy
- No. 5: pollution control
- No. 6: protection and restoration of biodiversity and ecosystems
The business activity must make a substantial contribution to one or more of the six objectives without doing no significant harm to the other objectives (the “DNSH” principle).
An initial delegated act (Act 1) on the climate (first two objectives) of the European Taxonomy was adopted on
The Platform for Sustainable Finance proposed criteria for a second delegated act (Act 2) in
The entities concerned by this new obligation publish the share of their revenue, the share of their CAPEX and the share of their OPEX relating to activities eligible for the Taxonomy.
Séché Environnement has classified its activities according to their eligibility for Act 1 and the criteria proposed for Act 2.
The sole obligation is the publication of information on the eligibility of economic activities for Act 1.
In a spirit of transparency, the Group is thus preparing ahead of time for the classification of all its activities according to their eligibility for the two delegated acts.
Eligible share |
2021 |
||
Act 1 |
Act 2 |
Total |
|
Contributed revenue |
|
|
|
OPEX |
|
|
|
CAPEX |
|
|
|
Based on Act 1 of the Taxonomy, the following Group activities are eligible:
- The collection and transport of non-hazardous waste sorted at source
- The recovery of from non-hazardous waste
- Other low-carbon manufacturing technologies (mainly the production of basic organic chemical products)
- The generation of photovoltaic electricity
Based on the proposed criteria for Act 2 of the Taxonomy, the following Group activities are eligible:
- The collection and transport of hazardous waste
- The treatment of hazardous waste for material recovery
- The treatment of hazardous waste for pollution prevention and control
- Decontamination to prevent and control pollution
- Environmental emergency services
- Urban wastewater treatment
- Other renewable and recovered energies, notably from hazardous waste
It should be noted that service activities (
This considerable share of business activities, operating expenses and industrial investments eligible for the Taxonomy illustrates the Group’s strong positioning in businesses related to the ecological transition.
1 Earnings before interest, tax, depreciation and amortization plus dividends received from subsidiaries and the balance of other operating income and expenses and cash, less site maintenance and restoration expenses, major maintenance expenses under concession arrangements ("public service delegations") and investments in concessions (IFRIC 12).
2 Free cash before non-recurring industrial investments, financial investments, dividend and debt repayments.
3 Contributed revenue is reported revenue, less IFRIC 12 revenue (amount of investments in concessions, recognized as revenue and activated in intangible assets or in financial assets in accordance with the recommendations of the IFRIC 12 interpretation) and less the General Tax on Polluting Activities (TGAP).
4 See press release of
5 Cash and cash equivalents + facilities + RCF
6 See press release of
7 EBITDA / contributed revenue
8
View source version on businesswire.com: https://www.businesswire.com/news/home/20220307005582/en/
SÉCHÉ ENVIRONNEMENT
Analyst / Investor Relations
Head of Investor Relations
m.andersen@groupe-seche.com
+33 (0)1 53 21 53 60
Media Relations
Head of Communications
c.descotes@groupe-seche.com
+33 (0)1 53 21 53 53
Source: Séché Environnement