STOCK TITAN

Canadian Oil Sands Greenhouse Gas Intensity Continues a 17-year Decline -- Down Nearly One-third Since 2009, S&P Global Energy Analysis Finds

(Neutral)
(Neutral)
Tags

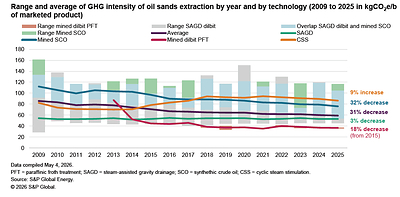
S&P Global (NYSE:SPGI) reports that Canadian oil sands greenhouse gas intensity fell for the 13th consecutive year. Benchmark average intensity declined 2% in 2025 to 59 kgCO2e per barrel, down 31% (about 27 kgCO2e/bbl) since 2009.

Operational optimizations, technologies like CCUS and boiler upgrades, and higher shares of lower-intensity SAGD and mined dilbit supported the trend. However, absolute emissions still rose 2% from 2024 to 2025, driven by a 150,000 b/d increase in production.

Loading...
Loading translation...

Positive

  • None.

Negative

  • None.

News Market Reaction – SPGI

+0.55%
+0.55% Session close to close

In the Jun 24 session, SPGI gained 0.55%, reflecting a mild positive market reaction.

Data tracked by StockTitan Argus on the day of publication.

Market Context

This announcement underscores SPGI’s role in energy-transition analytics, documenting a 31% drop in ...
Analysis

This announcement underscores SPGI’s role in energy-transition analytics, documenting a 31% drop in oil sands GHG intensity but higher absolute emissions. Investors may watch how such datasets support climate-risk products, while low short interest and insider buying shape positioning risks.

Key Figures

GHG intensity 2025: 59 kgCO2e/bbl Annual intensity change: 2% decline Long-term intensity decline: 31% reduction +4 more
7 metrics
GHG intensity 2025 59 kgCO2e/bbl Benchmark average oil sands emissions intensity in 2025
Annual intensity change 2% decline Change in benchmark GHG intensity from 2024 to 2025
Long-term intensity decline 31% reduction Drop in average oil sands GHG intensity since 2009
Per-barrel reduction 27 kgCO2e/b Decrease in emissions per barrel of marketable product since 2009
Years of decline 13 consecutive years Streak of annual GHG intensity declines in oil sands production
Production increase 150,000 b/d Rise in overall oil sands production between 2024 and 2025
Absolute emissions change 2% increase Change in total oil sands emissions from 2024 to 2025

Historical Context

5 past events · Latest: Jun 22 (Positive)
Pattern 5 events
Date Event Sentiment 24h Move Catalyst
Jun 22 Dividend declaration Positive -1.8% Announced third quarter 2026 cash dividend and reiterated long dividend history.
Jun 22 Workplace recognition Positive -0.8% CARFAX named a Top Workplace in both U.S. hub cities based on employee feedback.
Jun 18 Safety recall data Negative -2.3% CARFAX highlighted sharp increase in ‘Park Outside’ recalls affecting millions of vehicles.
Jun 12 ESG dataset launch Positive +1.4% Launch of UN Global Compact Screening Dataset covering thousands of companies for ESG risks.
Jun 11 Index inclusion Positive +1.4% Announcement that First Advantage will join the S&P SmallCap 600 index.

24h Move is the share-price change in the day after each event; other market factors may also have contributed.

Pattern Detected

Recent SPGI headlines, including product launches and index changes, have produced mixed but often positive price reactions, while even favorable corporate or dividend updates sometimes see short-term selling.

Key Terms

greenhouse gas intensity, carbon dioxide equivalent, steam-assisted gravity drainage, carbon capture, utilization and storage
4 terms
greenhouse gas intensity technical
"The greenhouse gas intensity of Canadian oil sands production has declined for a 13th straight year"
Greenhouse gas intensity measures how much planet-warming pollution a company or activity emits for each unit of output — for example per dollar of revenue, per ton of product, or per megawatt-hour of energy produced. It tells investors how emission‑efficient a business is, much like miles-per-gallon shows a car’s fuel efficiency, and helps assess regulatory, cost and reputational risks as markets and rules increasingly favor lower emissions.
carbon dioxide equivalent technical
"to 59 kilograms of "carbon dioxide equivalent" per barrel (kgCO2e/bbl) in 2025"
Carbon dioxide equivalent (CO2e) is a single number that expresses the total climate impact of different greenhouse gases by converting each into the amount of carbon dioxide that would cause the same warming. Think of it as converting various emissions into one common currency so they can be compared and summed. Investors care because CO2e lets them compare company footprints, assess regulatory and transition risk, track progress on emissions targets, and estimate potential future costs or reputational effects.
steam-assisted gravity drainage technical
"Meanwhile greater volumes of steam-assisted gravity drainage (SAGD) and Mined dilibit"
A steam-assisted gravity drainage (SAGD) process is an oil extraction method that injects high‑pressure steam into deep, heavy crude or bitumen deposits through a horizontal well to heat and thin the oil, allowing it to flow by gravity into a lower horizontal production well for pumping. For investors, SAGD matters because it determines how much oil can be recovered, how fast production ramps up, and the project’s operating costs, energy requirements and environmental footprint—key factors for revenue, capital planning and regulatory risk.
carbon capture, utilization and storage technical
"such as the completion of the Quest Carbon Capture, Utilization and Storage (CCUS) project in 2015"
A set of technologies that capture carbon dioxide from industrial sources or the air, then either reuse it in products or permanently store it underground. Think of it like a sponge that soaks up unwanted emissions, with options to recycle what’s captured or lock it away; for investors it matters because it can lower regulatory and climate-related risks, create new revenue streams or costs, and requires large, long-term capital and policy support that affects company value.

AI-generated analysis. How Rhea-AI works. Not financial advice.

See more from StockTitan in Google Search and AI answers. Adds StockTitan as a preferred source · opens Google
Add on Google

CALGARY, AB, June 24, 2026 /PRNewswire/ -- The greenhouse gas intensity of Canadian oil sands production has declined for a 13th straight year, according to a new analysis by S&P Global Energy. Since 2009, annual emissions intensity has declined every year but one (2012).

Source: S&P Global Energy

The annual S&P Global Energy analysis finds that the benchmark average GHG intensity of oil sands production declined 2% to 59 kilograms of "carbon dioxide equivalent" per barrel (kgCO2e/bbl) in 2025, the most recent calendar year available.

Since 2009, the average GHG intensity of oil sands production has declined by 31%, or nearly 27 kgCO2e/b of marketable product. 

"The downward trajectory of oil sands emissions intensity is now a well-established, multi-decade trend," said Kevin Birn, Vice President, Head of Carbon Research, S&P Global Energy. "Ongoing optimization efforts to maximize output from existing facilities, which are much more capital efficient compared to new projects, has been a critical factor, and this is expected to continue."

Improvements in mining operations experienced the greatest gains, which came from improved fleet optimization, better waste-heat integration, improved predictive maintenance and shorter maintenance turnaround periods, the analysis finds.

Integrated mines have also been where the larger step-out technologies have been tested and deployed, such as the completion of the Quest Carbon Capture, Utilization and Storage (CCUS) project in 2015 and Suncor's coke boiler replacement in 2024. Meanwhile greater volumes of steam-assisted gravity drainage (SAGD) and Mined dilibit—operations on average less intensive than integrated mines—diluted and reduced the overall industry average.

While GHG intensity continues to decline, absolute emissions from oil sands have continued to rise, but at a slower rate. Between 2024-2025, absolute emissions rose 2% on account of a 150,000 b/d rise in overall production.

"As oil sands output has increased, emissions have been spread over more units pushing intensity lower, even as it also pushed absolute emissions higher, but at a slowing rate," Birn said. "With growing speculation that oil sands production growth may accelerate, absolute emissions growth should also be expected to rise without the application of CCUS. However, the learnings over the past two decades may mean these barrels still come at even lower intensity."

Media Contacts:

Jeff Marn
S&P Global Energy
+1 202 463 8213
jeff.marn@spglobal.com

About S&P Global Energy

At S&P Global Energy, our comprehensive view of global energy and commodities markets enables our customers to make superior decisions and create long-term, sustainable value. Our four core capabilities are: Platts for pricing and news; CERA for research and advisory; Horizons for energy expansion and sustainability solutions; and Events for industry collaboration.

S&P Global Energy is a division of S&P Global (NYSE: SPGI). S&P Global enables businesses, governments, and individuals with trusted data, expertise, and technology to make decisions with conviction. We are Advancing Essential Intelligence through world-leading benchmarks, data, and insights that customers need in order to plan confidently, act decisively, and thrive in a rapidly changing global landscape. Learn more at www.spglobal.com/energy.

S&P Global Energy

Cision View original content to download multimedia:https://www.prnewswire.com/news-releases/canadian-oil-sands-greenhouse-gas-intensity-continues-a-17-year-decline--down-nearly-one-third-since-2009-sp-global-energy-analysis-finds-302809420.html

SOURCE S&P Global Energy

FAQ

What did S&P Global (SPGI) report about Canadian oil sands GHG intensity in 2025?

S&P Global reported that Canadian oil sands GHG intensity fell 2% in 2025 to 59 kgCO2e per barrel. According to S&P Global, this marked the 13th straight annual decline and extended a long-term trend of lower emissions per barrel since 2009.

How much has Canadian oil sands greenhouse gas intensity decreased since 2009 according to S&P Global?

According to S&P Global, Canadian oil sands GHG intensity has fallen about 31% since 2009. The benchmark average dropped by nearly 27 kgCO2e per barrel of marketable product, reflecting ongoing optimization, technology deployment, and a growing share of lower-intensity production methods across the sector.

What is the current benchmark GHG intensity level for Canadian oil sands production?

The benchmark GHG intensity for Canadian oil sands production is 59 kgCO2e per barrel for 2025. According to S&P Global, this represents a 2% decline from 2024 and continues a multi-year pattern of reduced emissions per barrel despite rising overall oil sands output.

Did absolute Canadian oil sands emissions rise or fall between 2024 and 2025?

Absolute Canadian oil sands emissions rose 2% between 2024 and 2025. According to S&P Global, the increase was linked to a 150,000 barrels-per-day rise in overall production, even as emissions intensity per barrel continued to decline across the industry.

Which technologies and optimizations are lowering Canadian oil sands GHG intensity?

Technologies and optimizations include fleet optimization, better waste-heat integration, predictive maintenance, and shorter turnarounds. According to S&P Global, step-out projects like the Quest CCUS facility and Suncor’s coke boiler replacement also contributed, alongside greater use of lower-intensity SAGD and mined dilbit operations.

How do rising Canadian oil sands volumes affect emissions intensity and absolute emissions?

Rising oil sands volumes spread emissions over more barrels, lowering intensity while raising absolute emissions. According to S&P Global, higher output has pushed intensity down but absolute emissions up, with growth potentially faster without wider CCUS use and continued efficiency gains.