TRX Gold Reports Second Quarter 2026 Results
Rhea-AI Summary
TRX Gold (TSX: TRX / NYSE American: TRX) reported a record Q2 2026 with 7,453 oz poured and 7,314 oz sold at an average realized price of $4,655/oz, generating $34.1M revenue, $21.1M gross profit (≈62% margin) and $20.2M adjusted EBITDA (≈59% margin).
The company held $26.0M cash, >$12M undrawn revolver, a ROM stockpile of 20,147 oz (~$107.5M fair value), and is advancing a 3,500+ tpd SAG/ball mill expansion with an updated PEA expected in Q4 2026.
Positive
- Record quarterly production — 7,453 ounces poured
- Record revenue — $34.1 million in Q2 2026
- Strong profitability — $21.1 million gross profit (≈62% margin)
- High adjusted EBITDA — $20.2 million in Q2 2026
- Improved liquidity — $26.0 million cash and >$12.0 million undrawn revolver
- Large ROM stockpile — 20,147 contained ounces (~$107.5 million)
Negative
- Reported net loss — $(13.8) million for the quarter
- Processing cost increase — $25.99/ton vs $15.90/ton prior year quarter
- Higher strip ratio — 14.4 w:o vs 8.5 prior year quarter
News Market Reaction – TRX
On the day this news was published, TRX declined 7.01%, reflecting a notable negative market reaction. Argus tracked a peak move of +3.2% during that session. Argus tracked a trough of -6.1% from its starting point during tracking. Our momentum scanner triggered 5 alerts that day, indicating moderate trading interest and price volatility. This price movement removed approximately $36M from the company's valuation, bringing the market cap to $482.08M at that time.
Data tracked by StockTitan Argus on the day of publication.
Key Figures
Previous Earnings Reports
| Date | Event | Sentiment | 24h Move | Catalyst |
|---|---|---|---|---|
| Jan 15 | Q1 2026 earnings | Positive | +8.6% | Record Q1 2026 production, revenue of $25.1M and strong EBITDA margins. |
| Oct 08 | Prelim Q4 2025 | Positive | +27.0% | Preliminary Q4 2025 record production, higher prices and stronger liquidity. |
| Jul 15 | Q3 2025 earnings | Positive | +0.1% | Q3 2025 revenue of $12.5M and record realized gold price of $3,114/oz. |
| Apr 15 | Q2 2025 earnings | Positive | +13.7% | Q2 2025 revenue of $9.1M with lower mining and processing costs. |
| Jan 15 | Q1 2025 earnings | Positive | -4.4% | Q1 2025 growth in ounces, revenue and margins but shares fell post-release. |
24h Move is the share-price change in the day after each event; other market factors may also have contributed.
Earnings releases have generally produced positive share-price reactions, with four of the last five earnings-type events trading higher the next day.
Over the past five earnings-related updates from Jan 2025 to Jan 2026, TRX Gold repeatedly reported rising production, higher realized gold prices and improving margins. Revenues climbed from $12.5M per quarter in early 2025 to $25.1M in Q1 2026, while working capital and ROM stockpiles expanded. Each release reinforced the Buckreef PEA framework of 62,000 oz average annual production over a long mine life. Today’s Q2 2026 results continue that pattern of record operational and financial performance.
Key Terms
preliminary economic assessment technical
semi autogenous grind technical
sag mill technical
adsorption, desorption and recovery technical
induced polarisation technical
AI-generated analysis. How Rhea-AI works. Not financial advice.
Another Record Quarter with Continued Production Growth Ahead
TORONTO, April 15, 2026 (GLOBE NEWSWIRE) -- TRX Gold Corporation (TSX: TRX) (NYSE American: TRX) (the “Company” or “TRX Gold”) reported its results for the second quarter of 2026 (“Q2 2026”) for the three and six months ended February 28, 2026. Financial results are available on the Company’s website at www.TRXgold.com. Unless otherwise noted, all references to currency in this press release refer to US dollars.
TRX Gold’s CEO, Stephen Mullowney commented: “We yet again delivered a record quarter, with 7,453 ounces of gold poured and 7,314 ounces sold during Q2 2026. With an average realized price of
Key highlights for Q2 2026 and Year to Date in 2026 include:
- Reported Record Quarterly Production, Revenue, and Adjusted EBITDA: During Q2 2026, Buckreef Gold poured a record 7,453 ounces of gold and sold 7,314 ounces of gold at a record average realized price (net)1 of
$4,655 per ounce, recognizing record revenue of$34.1 million , record gross profit of$21.1 million , gross profit margin of62% , record adjusted net income1 of$11.7 million , operating cash flow of$8.9 million and record adjusted EBITDA1 of$20.2 million , all of which reflect increases compared to the prior year comparative period. The record quarterly results demonstrate the Company’s ability to increase production while maintaining a low cost operation, which has provided leverage to record gold prices during Q2 2026. - Continued to Deliver Strong Financial Performance Year to Date in 2026: Year to date, the Company poured 14,050 ounces of gold and recognized revenue of
$59.2 million , gross profit of$35.3 million , adjusted net income1 of$19.4 million , operating cash flow of$12.9 million and adjusted EBITDA1 of$33.5 million . Revenue, gross profit, adjusted net income, and adjusted EBITDA1 were all half year records for the Company.
- Robust Recovery Rates Achieved: As reported last week, recovery rates between
89% -92% were achieved from additional metallurgical test work, which is in line with prior studies and above the88% recovery rate assumed in the PEA. The test work provided a more comprehensive understanding of optimal grind size for flotation and achievable mine feed from the mine plan, which has led the Company to specify a Semi Autogenous Grind (“SAG”) / Ball mill combination of 3,500+ tpd, which is above the PEA processing plant size assumption of 3,000 tpd. Tendering for the SAG mill has commenced with orders expected to be placed in Q3 2026 and an initial estimated completion date of calendar Q2 2027. - Advancing Existing Processing Plant Upgrades and Increased Expansion: The existing processing plant is currently undergoing significant upgrades and will be available to continue operating in conjunction with the new 3,500+ tpd SAG mill processing plant, providing a significant upgrade in processing capacity versus the 3,000 tpd assumed in the PEA. Notable upgrades to the existing processing plant include a pre-leach thickener, upgraded agitators & interstage screens, Aachen reactor, oxygen plant, Adsorption, Desorption and Recovery (“ADR”) plant, new gold room, apron feeder, belt magnet, and new tertiary crusher. These upgrades are currently in progress and are expected to be completed by calendar Q4 2026.
- Strategic Mine Planning to Expand Further: During Q2 2026, the Company initiated a revision of the life-of-mine plan as a result of the expected increase in processing capacity and the increase in gold price well above the PEA reserve estimate assumption of US
$1,900 /oz. Preliminary analysis indicates the potential for an expanded third cutback at the Main Pit, which could extend open-pit operations, defer commencement of underground mining and enhance total recoverable ounces at Buckreef Gold. This is expected to improve the overall economics of the project. The Company is also evaluating the potential for an earlier start to underground mining at the Stamford Bridge orebody, alongside accelerating mining of the expanded Eastern Porphyry pit. The increase in throughput from the expanded processing capacity is expected to increase average annual gold production in excess of the 62,000 ounces of gold originally anticipated in the May 2025 PEA. The Company has hired P&E Mining Consultants Inc. to update the PEA, which is expected to be completed in Q4 2026. - Working Capital Significantly Strengthened: In Q2 2026, the Company continued to increase its working capital position through increased production, organically generated cashflow, improved liquidity and an increase in stockpile inventory. The ROM and crushed ore stockpile has grown to an estimated 20,147 ounces of contained gold as at February 28, 2026 (representing a fair market value of approximately
$107.5 million at current market prices), as the Company continued to access higher grade ore blocks in the pit and processed a higher proportion of high grade mined material. As a result, the Company’s current ratio has improved to a ratio of approximately 2.4 at February 28, 2026. - Advancing Exploration Plans with Drilling to Commence: During Q2 2026, the Company processed all of the detailed ground magnetic data collected from the 810 line-kilometer ground magnetic survey that commenced in Q1 2026. This high-resolution geophysical survey mapped subsurface magnetic variations across the tenement area and resulted in the identification of ten exploration targets. The Company initiated a Gradient Array Resistivity and Induced Polarisation survey to identify the areas of highest potential and prioritize drilling campaigns. Concurrently, the Company commissioned its first drill rig with the goal of upgrading the Mineral Resource at the Eastern Porphyry.
- Strong Health, Safety, and Environmental Track Record: The Company achieved zero lost time injuries and there were no reportable environmental incidents during Q2 2026.
Selected Operating and Financial Data
Select operating and financial information from the operation for the three and six months ended February 28, 2026, follows below:
| Select Operating and Financial Data | ||||||||||||||
| Unit | Three months ended February 28, 2026 | Three months ended February 28, 2025 | Six months ended February 28, 2026 | Six months ended February 28, 2025 | ||||||||||
| Operating Data | ||||||||||||||
| Ore Mined | k tonnes | 140 | 109 | 368 | 217 | |||||||||
| Waste Mined | k tonnes | 2,028 | 927 | 3,157 | 1,742 | |||||||||
| Total Mined | k tonnes | 2,169 | 1,035 | 3,525 | 1,959 | |||||||||
| Strip Ratio | w:o | 14.4 | 8.5 | 8.6 | 8.0 | |||||||||
| Mining Rate | tpd | 24,096 | 11,501 | 19,474 | 10,822 | |||||||||
| Mining Cost | US$/t | $ | 4.45 | $ | 3.90 | $ | 4.57 | $ | 3.94 | |||||
| Plant Ore Milled | k tonnes | 140 | 113 | 281 | 268 | |||||||||
| Head Grade | g/t | 1.94 | 1.12 | 1.91 | 1.22 | |||||||||
| Plant Utilization | % | 89 | 83 | 90 | 86 | |||||||||
| Plant Recovery Rate | % | 84 | 74 | 80 | 73 | |||||||||
| Processing Cost | US$/t | $ | 25.99 | $ | 15.90 | $ | 22.87 | $ | 14.00 | |||||
| Plant Mill Throughput | tpd | 1,560 | 1,259 | 1,550 | 1,480 | |||||||||
| Gold Ounces Poured | oz | 7,453 | 3,004 | 14,050 | 7,845 | |||||||||
| Gold Ounces Sold | oz | 7,314 | 3,401 | 13,806 | 8,241 | |||||||||
| Financial Data | ||||||||||||||
| Revenue1 | $ ('000s) | 34,072 | 9,107 | 59,189 | 21,635 | |||||||||
| Gross Profit | $ ('000s) | 21,052 | 2,144 | 35,267 | 6,978 | |||||||||
| Net (loss) income | $ ('000s) | (13,777 | ) | (1,941 | ) | (14,273 | ) | 196 | ||||||
| Adjusted net income (loss)2 | $ ('000s) | 11,655 | (111 | ) | 19,387 | 1,761 | ||||||||
| Adjusted EBITDA2 | $ ('000s) | 20,245 | 941 | 33,456 | 5,359 | |||||||||
| Operating Cash Flow | $ ('000s) | 8,847 | 2,022 | 12,867 | 4,403 | |||||||||
| Working capital5 | $ ('000s) | 32,102 | (2,184 | ) | 32,102 | (2,184 | ) | |||||||
| Average Realized Price (gross)2 | $/oz | 4,659 | 2,678 | 4,287 | 2,625 | |||||||||
| Average Realized Price (net)2,3,4 | $/oz | 4,655 | 2,739 | 4,281 | 2,676 | |||||||||
| Cash Cost2 | $/oz | 1,506 | 1,765 | 1,507 | 1,541 | |||||||||
| 1 Revenue includes immaterial amounts from the sale of by-product silver and copper. | ||||||||||||||
| 2 Refer to the "Non-IFRS Performance Measures" section. | ||||||||||||||
| 3 Net of revenue and ounces of gold sold related to OCIM gold prepaid purchase agreement. | ||||||||||||||
| 4 Net of interest related to Auramet gold prepaid purchase agreement. | ||||||||||||||
| 5 Working capital for the three and six months ended February 28, 2025 are adjusted for derivative liabilities which will only be settled by issuing equity of the Company and for the current portion of deferred revenue (non-cash) related to the Auramet prepaid gold purchase agreement. | ||||||||||||||
Figure 1: Buckreef Gold Open Pit Main Zone Aerial View
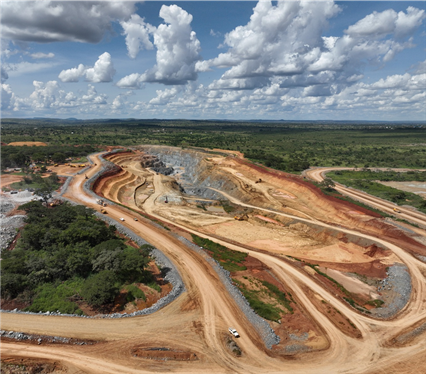
Figure 2: Buckreef Gold Crushing and Conveyor Circuit
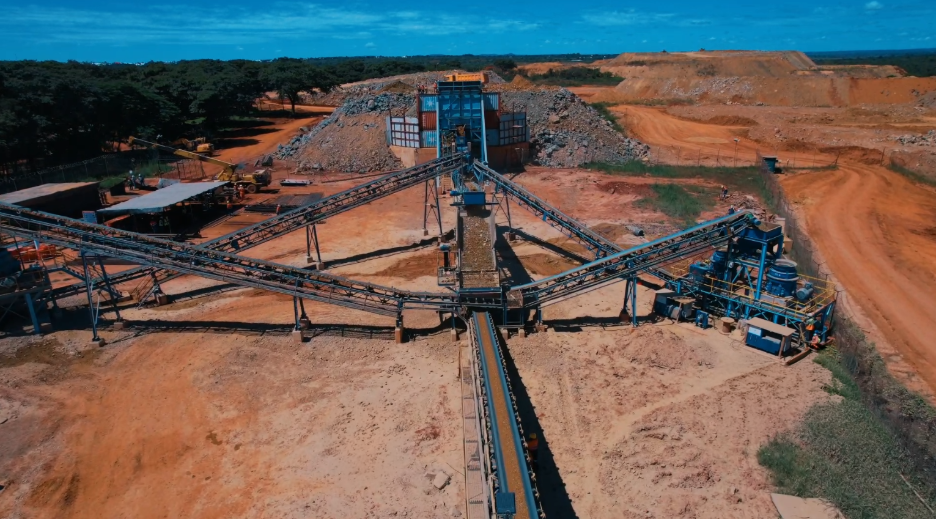
Figure 3: Buckreef Gold Ore Moving Through Crushing Circuit
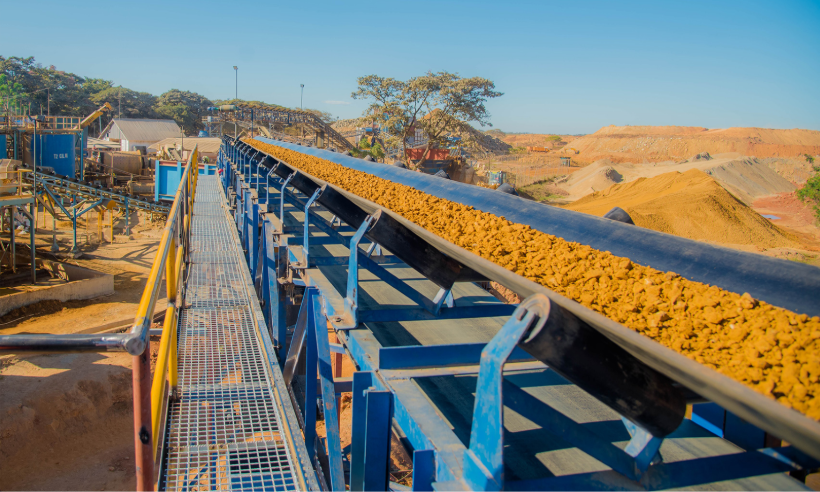
Figure 4: Buckreef Gold’s 1,000 tpd ball mill
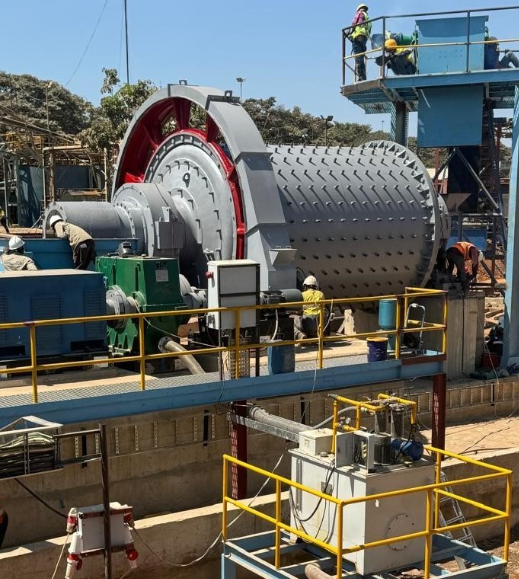
Figure 5: Buckreef Gold Stage One Drilling
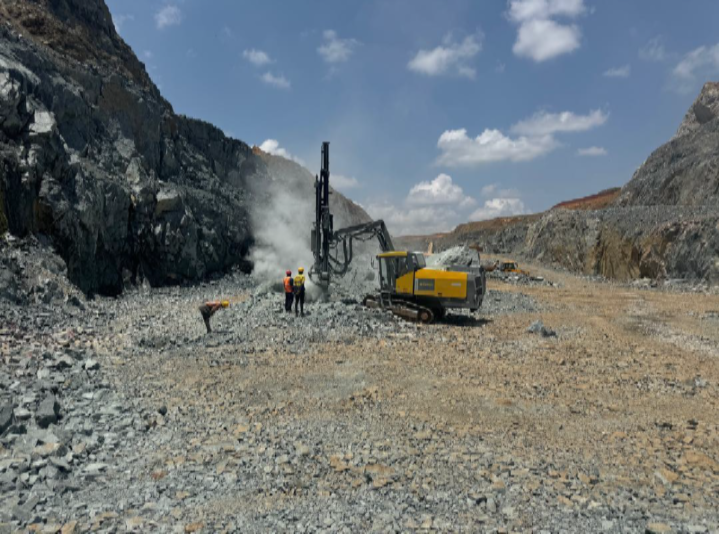
Figure 6: Stage 2 Expansion at Buckreef Gold
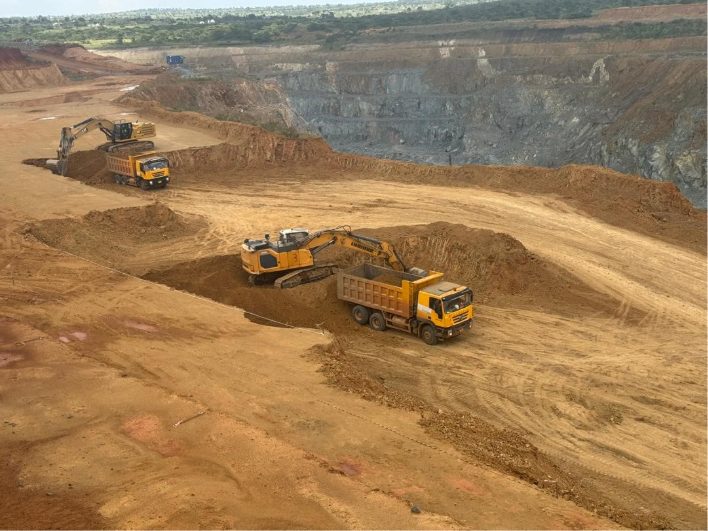
Figure 7: Revised Process Flowsheet for the Upgraded and Expanded Plant
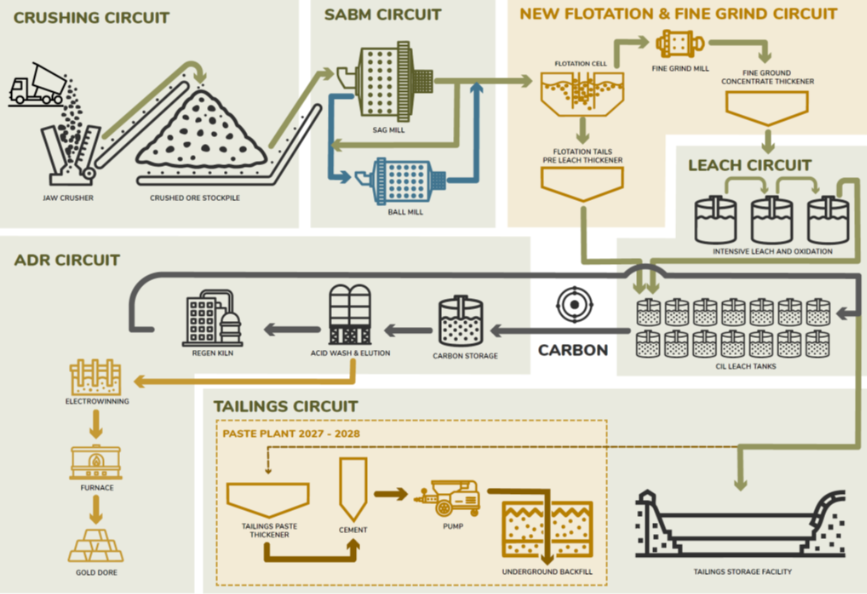
Figure 8: Installation of New Belt Magnet
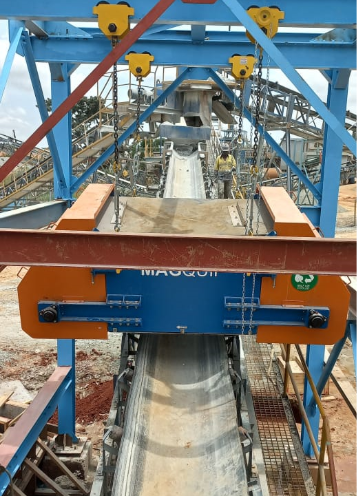
Figure 9: Pre-Leach Thickener Erection in Progress
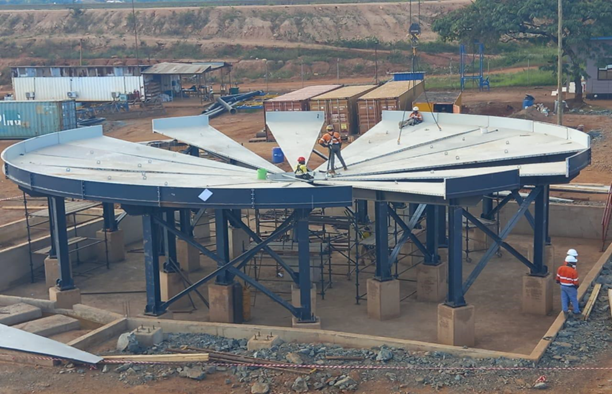
Figure 10: Aachen ® Reactor Installed and Commissioned to Improve Processing Efficiency
Q2 2026 Results Conference Call and Webcast Details
When: Wednesday, April 15th at 9:00 AM EDT
Webcast link:
https://www.renmarkfinancial.com/live-registration/second-quarter-2026-results-virtual-conference-call-tsx-trx-nyse-american-trx-iyRLSBi2dF
Conference call numbers:
Canada/USA TF: 1-833-752-3900
International Toll: +1-647-849-3080
A replay will be made available for 30 days following the call on the Company’s website.
About TRX Gold Corporation
TRX Gold is a high margin and growing gold company advancing the Buckreef Gold Project in Tanzania. Buckreef Gold includes an established open pit operation and 2,000 tonnes per day process plant with upside potential demonstrated in the May 2025 Preliminary Economic Assessment (the “PEA”). The PEA outlines average gold production of 62,000 oz per annum over 17.6 years at 3,000 tonnes per day of throughput capacity, and a US
Qualified Person
Mr. Richard Boffey, BE Mining (Hons) F AusIMM, Chief Operating Officer of TRX Gold Corporation, is the Company’s in-house Qualified Person under National Instrument 43-101 “Standards of Disclosure for Mineral Projects” (“NI 43-101”) and has reviewed and assumes responsibility for the scientific and technical content in this press release.
For investor or shareholder inquiries, please contact:
Investors:
Investor Relations
IR@TRXgold.com
+1-437-224-5241
+1 844 GOLD TRX (844-465-3879)
www.TRXgold.com
Non-IFRS Performance Measures
The Company has included certain non-IFRS measures in this news release. The following non-IFRS measures should be read in conjunction with the Company’s Unaudited Interim Condensed Consolidated Financial Statements for the three and six months ended February 28, 2026 filed on SEDAR+ and with the Securities and Exchange Commission (“SEC”), as well as the Company's audited consolidated financial statements included in the Company’s Annual Report on Form 40-F and Annual Information Form for the year ended August 31, 2025. The financial statements and related notes of TRX Gold have been prepared in accordance with International Financial Reporting Standards (“IFRS”). Additional information has been filed electronically on SEDAR+ and with the SEC and is available online under the Company’s profile at www.sedarplus.ca and the Company’s filings with the SEC at www.sec.gov and on our website at www.TRXgold.com.
Adjusted EBITDA
Adjusted EBITDA is a non-IFRS performance measure and does not constitute a measure recognized by IFRS and does not have a standardized meaning defined by IFRS. Adjusted EBITDA may not be comparable to information in other gold producers’ reports and filings. Adjusted EBITDA is presented as a supplemental measure of the Company’s performance and ability to service its obligations. EBITDA is frequently used by securities analysts, investors and other interested parties in the evaluation of companies in the industry, many of which present Adjusted EBITDA when reporting their results. Issuers present Adjusted EBITDA because investors, analysts and rating agencies consider it useful in measuring the ability of those issuers to meet their obligations. Adjusted EBITDA represents net income before interest, income taxes, and depreciation and also eliminates the impact of a number of items that are not considered indicative of ongoing operating performance.
The following table provides a reconciliation of net (loss) income and comprehensive (loss) income to Adjusted EBITDA per the Unaudited Interim Condensed Consolidated Financial Statements for the three and six months ended February 28, 2026.
| Three Months Ended | Three Months Ended | Six Months Ended | Three Months Ended | ||||||
| February 28, 2026 | February 28, 2025 | February 28, 2026 | February 28, 2025 | ||||||
| Net (loss) income and comprehensive (loss) income per financial statements | (13,777 | ) | (1,941 | ) | (14,273 | ) | 196 | ||
| Add: | |||||||||
| Depreciation | 2,003 | 580 | 3,112 | 1,486 | |||||
| Interest, net and other expense | 205 | 1,320 | 539 | 1,641 | |||||
| Non-recurring severance and legal expenses | - | 406 | - | 430 | |||||
| Income tax expense | 6,342 | 142 | 11,370 | 1,835 | |||||
| Change in fair value of derivative financial instruments | 23,521 | (839 | ) | 30,521 | (1,658 | ) | |||
| Share-based payment expense | 1,951 | 1,273 | 2,187 | 1,429 | |||||
| Adjusted EBITDA | 20,245 | 941 | 33,456 | 5,359 | |||||
Average realized price per ounce gold sold
Average realized price per ounce of gold sold is a non-IFRS measure and does not constitute a measure recognized by IFRS and does not have a standardized meaning defined by IFRS. Average realized price per ounce of gold sold is calculated by dividing revenue by ounces of gold sold. It may not be comparable to information in other gold producers’ reports and filings.
The following table provides a reconciliation of average realized price per ounce of gold sold to revenue per the Unaudited Interim Condensed Consolidated Financial Statements for the three and six months ended February 28, 2026.
| Three Months Ended | Three Months Ended | Six Months Ended | Three Months Ended | ||||||||||
| February 28, 2026 | February 28, 2025 | February 28, 2026 | February 28, 2025 | ||||||||||
| Revenue per financial statements | $ | 34,072 | $ | 9,107 | $ | 59,189 | $ | 21,635 | |||||
| Interest recognized from Auramet prepaid gold purchase agreement | (28 | ) | - | (87 | ) | - | |||||||
| Revenue recognized from OCIM prepaid gold purchase agreement | - | (1,403 | ) | - | (2,319 | ) | |||||||
| Revenue from gold sales | 34,044 | 7,704 | 59,102 | 19,316 | |||||||||
| Ounces of gold sold | 7,314 | 3,401 | 13,806 | 8,241 | |||||||||
| Ounces of gold sold from OCIM prepaid gold purchase agreement | - | (588 | ) | - | (1,023 | ) | |||||||
| Ounces from gold sales (net of OCIM prepaid gold purchase agreement) | 7,314 | 2,813 | 13,806 | 7,218 | |||||||||
| Average Realized Price (gross) | $ | 4,659 | $ | 2,678 | $ | 4,287 | $ | 2,625 | |||||
| Average Realized Price (net) | $ | 4,655 | $ | 2,739 | $ | 4,281 | $ | 2,676 | |||||
Cash cost per ounce of gold sold
Cash cost per ounce of gold sold is a non-IFRS performance measure and does not constitute a measure recognized by IFRS and does not have a standardized meaning defined by IFRS. Cash cost per ounce may not be comparable to information in other gold producers’ reports and filings. The following table provides a reconciliation of total cash cost per ounce of gold sold to cost of goods sold per the financial statements for the three and six months ended February 28, 2026.
| Three Months Ended | Three Months Ended | Six Months Ended | Three Months Ended | ||||||||||
| February 28, 2026 | February 28, 2025 | February 28, 2026 | February 28, 2025 | ||||||||||
| Cost of sales per financial statements | $ | 13,020 | $ | 6,963 | $ | 23,922 | $ | 14,657 | |||||
| Less: | |||||||||||||
| Depreciation | $ | (2,003 | ) | $ | (580 | ) | $ | (3,112 | ) | $ | (1,486 | ) | |
| Costs related to settlement of OCIM gold purchase agreement | $ | - | $ | (1,125 | ) | $ | - | $ | (1,125 | ) | |||
| Total cash cost | $ | 11,017 | $ | 5,258 | $ | 20,810 | $ | 12,046 | |||||
| Ounces of gold sold | 7,314 | 3,401 | 13,806 | 8,241 | |||||||||
| Less: | |||||||||||||
| Ounces related to settlement of OCIM gold purchase agreement | - | (422 | ) | - | (422 | ) | |||||||
| Total ounces of gold sold net of OCIM gold purchase agreement settlement | 7,314 | 2,979 | 13,806 | 7,819 | |||||||||
| Cash Cost per Ounce of Gold Sold | $ | 1,506 | $ | 1,765 | $ | 1,507 | $ | 1,541 | |||||
Adjusted Net Income
Adjusted Net Income is a non-IFRS performance measure and does not constitute a measure recognized by IFRS and does not have a standardized meaning defined by IFRS. Adjusted Net Income may not be comparable to information in other gold producers’ reports and filings. Adjusted Net Income is presented as a supplemental measure of the Company’s performance. Adjusted Net Income is frequently used by securities analysts, investors and other interested parties in the evaluation of companies in the industry, many of which present Adjusted Net Income when reporting their results.
Management uses this measure internally to evaluate the underlying operating performance for the reporting periods presented. Management believes that Adjusted Net Income is a useful measure of performance because the items excluded from Net Income do not reflect the underlying operating performance of the core mining business and are not necessarily indicative of future operating results.
The Company presents Adjusted Net Income to enable investors, analysts and rating agencies to better understand the underlying operating performance of the core mining business through the eyes of management. Adjusted Net Income is a non-IFRS financial measure which excludes the following from net income (loss): foreign exchange losses (gains), interest and other expense, change in fair value of derivative instruments, and share-based expenses, which are not considered indicative of the Company’s underlying operating results for the reporting periods presented or for future operating performance.
The following table provides a reconciliation of net (loss) income and comprehensive (loss) income to Adjusted Net Income per the financial statements for the three and six months ended February 28, 2026.
| Three Months Ended | Three Months Ended | Six Months Ended | Three Months Ended | ||||||
| February 28, 2026 | February 28, 2025 | February 28, 2026 | February 28, 2025 | ||||||
| Net (loss) income and comprehensive (loss)income per financial statements | (13,777 | ) | (1,941 | ) | (14,273 | ) | 196 | ||
| Add: | |||||||||
| Foreign exchange (gains) losses | (245 | ) | 76 | 413 | 153 | ||||
| Interest, net and other expense | 205 | 1,320 | 539 | 1,641 | |||||
| Change in fair value of derivative financial instruments | 23,521 | (839 | ) | 30,521 | (1,658 | ) | |||
| Share-based payment expense | 1,951 | 1,273 | 2,187 | 1,429 | |||||
| Adjusted Net Income (Loss) | 11,655 | (111 | ) | 19,387 | 1,761 | ||||
The Company has included “Adjusted EBITDA”, “average realized price per ounce of gold sold”, “cash cost per ounce of gold sold” and “Adjusted Net Income” and as non-IFRS performance measures throughout this news release as TRX Gold believes that these generally accepted industry performance measures provide a useful indication of the Company’s operational performance. The Company believes that certain investors use this information to evaluate the Company’s performance and ability to generate cash flow. Accordingly, they are intended to provide additional information and should not be considered in isolation or as a substitute for measures of performance prepared in accordance with IFRS.
Forward-Looking and Cautionary Statements
This press release contains certain forward-looking statements as defined in the applicable securities laws. All statements, other than statements of historical facts, are forward-looking statements. Forward-looking statements are frequently, but not always, identified by words such as “expects”, “anticipates”, “believes”, “hopes”, “intends”, “estimated”, “potential”, “possible” and similar expressions, or statements that events, conditions or results “will”, “may”, “could” or “should” occur or be achieved. Forward-looking statements relate to future events or future performance and reflect TRX Gold management’s expectations or beliefs regarding future events and include, but are not limited to, statements with respect to anticipated gold production, anticipated capital and exploration expenditures, continued operating cash flow, expansion of its process plant, estimation of mineral resources, ability to develop value creating activities, recoveries, subsequent project testing, success, scope and viability of mining operations, and the timing and amount of estimated future production.
Although TRX Gold believes the expectations expressed in such forward-looking statements are based on reasonable assumptions, such statements are not guarantees of future performance. The actual achievements of TRX Gold or other future events or conditions may differ materially from those reflected in the forward-looking statements due to a variety of risks, uncertainties and other factors. These risks, uncertainties and factors include general business, legal, economic, competitive, political, regulatory and social uncertainties; actual results of exploration activities and economic evaluations; fluctuations in currency exchange rates; changes in costs; future prices of gold and other minerals; mining method, production profile and mine plan; delays in exploration, development and construction activities; changes in government legislation and regulation; the ability to obtain financing on acceptable terms and in a timely manner or at all; contests over title to properties; employee relations and shortages of skilled personnel and contractors; the speculative nature of, and the risks involved in, the exploration, development and mining business. These risks are set forth in reports that TRX Gold files with the SEC and the various Canadian securities authorities. You can review and obtain copies of these filings from the SEC's website at http://www.sec.gov/edgar.shtml and the Company’s profile on the System for Electronic Document Analysis and Retrieval (“SEDAR+”) at www.sedarplus.ca.
The disclosure contained in this press release of a scientific or technical nature relating to the Company’s Buckreef Project has been summarized or extracted from the technical report prepared in accordance with NI 43-101 – Standards of Disclosure for Mineral Projects on the Buckreef Gold Project (“Buckreef Gold”) titled Preliminary Economic Assessment and Updated Mineral Resource Estimate of the Buckreef Gold Mine Project, Tanzania (“PEA”) with an effective date of April 15, 2025. The PEA was prepared in accordance with NI 43-101 guidelines by P&E Mining Consultants Inc. (“P&E”). Input to this PEA was also provided by D.E.N.M. Engineering Ltd. (“D.E.N.M.”). The information contained herein is subject to all of the assumptions, qualifications and procedures set out in, and is qualified in its entirety by reference to the full text of, the PEA and reference should be made to the full details of the PEA which has been filed with the applicable regulatory authorities and is available on the Company’s profile at www.sedarplus.ca.
The information contained in this press release is as of the date of the press release and TRX Gold assumes no duty to update such information.
1 Refer to “Non-IFRS Performance Measures” section.
2 Base case NPV5% of US
Photos accompanying this announcement are available at:
https://www.globenewswire.com/NewsRoom/AttachmentNg/a591604b-4755-4684-b337-abe21a8c84f0
https://www.globenewswire.com/NewsRoom/AttachmentNg/16348d78-38a8-494a-9102-2ddeb8f0462a
https://www.globenewswire.com/NewsRoom/AttachmentNg/c802316e-b55d-44d7-82fc-51bb39040b9e
https://www.globenewswire.com/NewsRoom/AttachmentNg/96b69285-4f7b-4cbe-9ede-8796bfdeef9f
https://www.globenewswire.com/NewsRoom/AttachmentNg/6b448f01-9370-416b-98aa-0f91537df025
https://www.globenewswire.com/NewsRoom/AttachmentNg/faec7841-a78c-4e6e-827e-37b0576aa4ac
https://www.globenewswire.com/NewsRoom/AttachmentNg/fd8c420a-ca7e-4b7a-8270-76aef92b4cca
https://www.globenewswire.com/NewsRoom/AttachmentNg/042f52f4-4fb9-4227-8786-77ff01cf4384
https://www.globenewswire.com/NewsRoom/AttachmentNg/ea7c4a6d-afb7-46ae-9cdf-4ff6ad0db697
https://www.globenewswire.com/NewsRoom/AttachmentNg/08342610-fcf8-418c-a845-65c5d8742e33
