
Wesdome Reports Strong Second Quarter 2026 Results and Reaffirms Full-Year Production and Cost Guidance
Wesdome Gold Mines (OTCQX: WDOFF) reported Q2 2026 revenue of $266.8 million, up 28% year-over-year, on consolidated gold production of 43,824 ounces, a 2% increase.
Sentiment and the balance of points
Rhea-AI Sentiment reads the wording of the document, how positive or negative its language is on a 1 to 5 scale. The balance of points shown with the takes weighs what the document actually discloses, so the two can disagree, for example when a trial that missed its main goal is described in upbeat language.
Rhea-AI Summary
Wesdome Gold Mines (OTCQX: WDOFF) reported Q2 2026 revenue of $266.8 million, up 28% year-over-year, on consolidated gold production of 43,824 ounces, a 2% increase. Cash costs rose 45% to US$1,342/oz and all-in sustaining costs increased 15% to US$1,763/oz versus Q2 2025.
Gross profit grew 22% to $161.2 million, EBITDA rose 23% to $169.7 million, and net income was $94.0 million, or $0.64 per share. Free cash flow was $42 million, down from $52.9 million, amid higher taxes and capital spending. Liquidity totaled $746 million, including $391 million in cash and an undrawn US$250 million credit facility. Wesdome declared a quarterly dividend of $0.0306 per share and expanded its share buyback up to 9.0 million shares. Updated technical reports outlined 1.4 million ounces of proven and probable reserves and 8‑year reserve-based mine plans at Eagle River and Kiena.
Positive
- Revenue +28% YoY to $266.8 million in Q2 2026
- Net income $94.0 million, EPS $0.64 vs $0.55 in Q2 2025
- EBITDA +23% YoY to $169.7 million in Q2 2026
- Operating cash margin increased to $184.4 million from $149.4 million
- Liquidity $746 million, including $391 million cash and undrawn US$250 million facility
- Capital returns: dividend $0.0306 per share and buybacks up to 9.0 million shares
- Reserves 1.4 million oz P&P with 8-year mine plans at Eagle River and Kiena
Negative
- Cash costs/oz up 45% YoY to US$1,342 in Q2 2026
- AISC/oz up 15% YoY to US$1,763 in Q2 2026
- Free cash flow down to $42 million from $52.9 million in Q2 2025
- Net cash from operating activities fell to $87.5 million from $100.9 million
- Eagle River Q2 production decreased 15% to 21,798 ounces
- Eagle River H1 production decreased 9% to 49,644 ounces
News Explained
Existing holders have a completed 7.8-million-share cancellation, while further buybacks remain authorized rather than committed.
Wesdome reported
The release describes two different buyback states: shares already purchased and cancelled, and a remaining authorization that permits purchases up to a ceiling rather than committing the company to complete that amount.
At Kiena, the new ramp reached surface in
The specific operating milestone to monitor is whether the Kiena ventilation expansion reaches the stated capacity objective and supports the planned production growth.
Details
News Market Reaction – WDOFF
On Aug 14, the first trading day after this news, WDOFF closed 0.04% above the previous close.
Data tracked by StockTitan Argus for the Aug 14 session.
AI-generated analysis. How Rhea-AI works. Not financial advice.




Toronto, Ontario--(Newsfile Corp. - August 13, 2026) - Wesdome Gold Mines Ltd. (TSX: WDO) (OTCQX: WDOFF) ("Wesdome" or the "Company") today announced its financial results for the three and six months ended June 30, 2026 ("Q2 2026" and "H1 2026"). Preliminary operating results for Q2 2026 were disclosed in the Company's press release dated July 13, 2026. Management will host a webcast tomorrow morning, August 14, 2026 at 10:00 a.m. ET to discuss its results. All amounts are expressed in Canadian dollars unless otherwise indicated.
Q2 2026 Highlights
Strong safety performance: High Potential Incident Frequency Rate declined
69% year-over-year to 0.67, reflecting the strong commitment to safety across the organization. Total Recordable Incident Frequency Rate of 1.67 in Q2 2026.Production and costs: Consolidated gold production for the second quarter was 43,824 ounces, a
2% increase compared to Q2 2025. Q2 2026 cash costs per ounce of gold sold1 increased by45% to US$1,342 and all-in sustaining costs ("AISC") per ounce of gold sold1 increased by15% to US$1,763 compared to Q2 2025.Revenue growth: Consolidated Q2 2026 revenue increased by
28% to$267 million compared to Q2 2025. The average realized price of gold sold was US$4,365 per ounce in Q2 2026.Expanding margins: Gross profit increased by
22% year-over-year in Q2 2026 to$161 million and operating cash margin1 grew by23% to$184 million .Net income: Q2 2026 net income of
$94 million , or$0.64 earnings per share, an increase of$11.3 million compared to Q2 2025.EBITDA1: EBITDA1 was
$170 million in Q2 2026, a23% increase relative to Q2 2025.Cash flow1: Q2 2026 net cash from operating activities was
$88 million , or$0.59 per share3, with free cash flow1 of$42 million , or$0.28 per share. Free cash flow1 decreased to$42 million , or$0.28 per share, from$53 million , or$0.35 per share, in Q2 2025 driven by higher net income offset by a combined increase in tax payments, receivables, supplies inventories, mine exploration and development and capital equipment purchases.Strong liquidity position: As at June 30, 2026, the Company had liquidity of
$746 million , including$391 million in cash and US$250 million of undrawn full capacity available under its revolving credit facility.Expanded capital returns: The Company is delivering capital returns to shareholders while preserving flexibility to act opportunistically, within a framework that continues to prioritize fully funded organic growth:
Dividend declaration: On June 24, the Company declared a quarterly cash dividend of
$0.0306 per common share or$0.1224 per common share on an annualized basis.
Share buyback expansion: Through Q2 2026, the Company purchased and cancelled 3.2 million common shares for approximately
$82 million at an average price of$25.66 per share. On June 24, 2026, the Company announced it was expanding its normal course issuer bid, authorizing the purchase of an incremental 3.0 million shares, bringing the total aggregate number of shares the Company intends to repurchase up to approximately 9.0 million shares or6% of its public float. In July 2026, the Company repurchased an additional 1.8 million shares for approximately$46 million . The total number of shares purchased at the end of July was 7.8 million shares.
Updated technical reports confirm extended mine lives and growth potential at Eagle River and Kiena: Filed independent NI 43-101 technical reports for Eagle River and Kiena, confirming 1.4 million ounces of consolidated proven and probable reserves and 8-year reserve-based mine plans through 2033 at both operations, with significant organic growth potential from resource conversion and exploration targets.
Kiena ramp breakthrough achieved, enhancing operational flexibility: Kiena's new ramp reached surface in Q2 2026, establishing continuous ramp access that boosts underground materials and equipment flexibility and enables the ongoing ventilation expansion project, expected to double mine ventilation capacity to support production growth at Kiena.
Discovery in Kiena Deep, Norbenite Footwall: As reported in the Company's press release dated June 22, 2026, drilling in Kiena Deep discovered a new parallel zone beyond the Norbenite Fault, previously interpreted as barren footwall, highlighted by 6.9 g/t over 42.1 metres, confirming an entirely new mineralized corridor, called the Norbenite Footwall, spanning at least 150 vertical metres. This discovery represents a significant new exploration opportunity for future resource growth at Kiena.
Anthea Bath, President and Chief Executive Officer, commented: "Q2 2026 demonstrated the operational momentum we have been building across both assets, giving us the confidence to reaffirm our full year production and cost guidance.
"At Eagle River, the integration of global model ore into our fill-the-mill strategy is now a structural part of how we run the mine. This approach is driving higher mill throughput and, as we move through the second half of the year, we expect grade improvement, keeping Eagle River firmly on track to deliver its full year production and cost targets.
"Kiena's performance this quarter was a genuine inflection point. Production increased
"Overall, it was a strong quarter with higher margins and robust EBITDA. Free cash flow was negatively impacted by several items, most notably the timing of a
"Perhaps most importantly for investors, there is greater visibility into Wesdome's long-term value proposition. Our June technical report update established eight-year reserve mine lives at both mines, providing a foundation for production and cash flow while preserving significant upside from operational optimization, resource conversion and exploration. Together with our strong balance sheet, we have the flexibility to invest in organic growth while also returning capital through our quarterly dividend and expanded share buyback program. We have two long-life assets, a clear pathway to grow production, and emerging district-scale opportunities around both operations. Our focus now is on converting that potential into sustainable growth and increasing value per share."
Consolidated Financial and Operating Highlights
| In 000s, except per units and per share amounts | ||||||||||||
| Q2 2026 | Q2 2025 | H1 2026 | H1 2025 | |||||||||
| Financial results | ||||||||||||
| Revenues² | 266,764 | 208,548 | 566,557 | 396,166 | ||||||||
| Cost of sales | 82,332 | 59,181 | 160,232 | 119,205 | ||||||||
| Gross profit | 161,213 | 132,172 | 356,027 | 235,546 | ||||||||
| Operating cash margin¹ | 184,432 | 149,367 | 406,325 | 276,961 | ||||||||
| EBITDA¹ | 169,675 | 138,399 | 381,908 | 257,758 | ||||||||
| Net income | 93,955 | 82,696 | 212,837 | 145,169 | ||||||||
| Earnings per share | 0.64 | 0.55 | 1.43 | 0.97 | ||||||||
| Adjusted net income¹ | 96,271 | 78,856 | 215,608 | 141,329 | ||||||||
| Adjusted net income per share¹ | 0.65 | 0.52 | 1.45 | 0.94 | ||||||||
| Net cash from operating activities | 87,538 | 100,920 | 249,359 | 181,076 | ||||||||
| Operating cash flow per share³ | 0.59 | 0.67 | 1.67 | 1.21 | ||||||||
| Net cash (used in) from financing activities | (81,766 | ) | (1,303 | ) | (130,152 | ) | 43 | |||||
| Net cash used in investing activities | (45,475 | ) | (79,987 | ) | (82,145 | ) | (116,652 | ) | ||||
| Free cash flow¹ | 41,772 | 52,924 | 167,634 | 100,428 | ||||||||
| Free cash flow per share¹ | 0.28 | 0.35 | 1.13 | 0.67 | ||||||||
| Average USD/CAD exchange rates | 1.3838 | 1.3841 | 1.3777 | 1.4095 | ||||||||
| Operating results | ||||||||||||
| Gold produced (ounces) | 43,824 | 42,781 | 89,127 | 88,473 | ||||||||
| Gold sold (ounces) | 44,100 | 45,900 | 89,700 | 91,200 | ||||||||
| Per ounce of gold sold¹ | ||||||||||||
| Cost of sales⁴ ($/oz) | 1,867 | 1,289 | 1,786 | 1,307 | ||||||||
| Cost of sales⁴ (US$/oz) | 1,349 | 932 | 1,297 | 927 | ||||||||
| Cash costs¹ ($/oz) | 1,857 | 1,285 | 1,775 | 1,302 | ||||||||
| Cash costs¹ (US$/oz) | 1,342 | 929 | 1,288 | 924 | ||||||||
| AISC¹ ($/oz) | 2,439 | 2,115 | 2,382 | 2,038 | ||||||||
| AISC¹ (US$/oz) | 1,763 | 1,528 | 1,729 | 1,446 | ||||||||
| Average realized price¹ ($/oz) | 6,040 | 4,539 | 6,305 | 4,339 | ||||||||
| Average realized price¹ (US$/oz) | 4,365 | 3,279 | 4,576 | 3,078 | ||||||||
| Financial position | ||||||||||||
| Cash | 390,927 | 187,564 | 390,927 | 187,564 | ||||||||
| Working capital⁵ | 402,149 | 199,273 | 402,149 | 199,273 | ||||||||
| Total assets | 1,245,097 | 932,996 | 1,245,097 | 932,996 | ||||||||
| Current liabilities | 68,190 | 71,166 | 68,190 | 71,166 | ||||||||
| Total liabilities | 219,789 | 197,577 | 219,789 | 197,577 |
- Refer to "Non-IFRS Performance Measures" for the reconciliation of non-IFRS measurements to the financial statements.
- Revenue includes
$0.4 million for Q2 2026,$0.2 million for Q2 2025,$1.0 million for H1 2026 and$0.4 million for H1 2025, from the sale of by-product silver. - Operating cash flow per share is calculated by dividing net cash from operating activities by basic weighted average number of common shares.
- Cost of sales per ounce sold is calculated by dividing the cost of sales by the number of ounces sold.
- Working capital is the sum of current assets less current liabilities on the statements of financial position.
REVIEW OF OPERATING MINES
Eagle River (Ontario, Canada)
Operating and Financial Results
| Q2 2026 | Q2 2025 | H1 2026 | H1 2025 | |||||||||
| Eagle River operating results | ||||||||||||
| Ore milled (tonnes) | 72,439 | 48,623 | 144,170 | 108,633 | ||||||||
| Head grade (g/t) | 9.7 | 16.9 | 11.1 | 16.2 | ||||||||
| Average mill recoveries (%) | 96.2 | 96.7 | 96.5 | 96.5 | ||||||||
| Gold production (oz) | 21,798 | 25,612 | 49,644 | 54,611 | ||||||||
| Gold sold (ounces) | 22,300 | 27,000 | 49,650 | 54,700 | ||||||||
| Production costs per tonne milled¹ ($) | 631 | 626 | 609 | 597 | ||||||||
| Costs per oz of gold sold ($/oz) | ||||||||||||
| Operating cash margin¹ | 3,770 | 3,332 | 4,377 | 3,083 | ||||||||
| Cost of sales | 2,225 | 1,211 | 1,920 | 1,272 | ||||||||
| Cash costs¹ | 2,218 | 1,207 | 1,911 | 1,268 | ||||||||
| All-in sustaining costs¹ | 2,800 | 1,929 | 2,471 | 1,924 | ||||||||
| Costs per oz of gold sold (US$/oz) | ||||||||||||
| Operating cash margin¹ | 2,724 | 2,407 | 3,177 | 2,188 | ||||||||
| Cost of sales | 1,608 | 875 | 1,395 | 903 | ||||||||
| Cash costs¹ | 1,603 | 872 | 1,386 | 899 | ||||||||
| All-in sustaining costs¹ | 2,023 | 1,394 | 1,794 | 1,365 | ||||||||
- Refer to the section entitled "Non-IFRS Performance Measures" for the reconciliation of non-IFRS measurements to the financial statements.
| In | Q2 2026 | Q2 2025 | H1 2026 | H1 2025 | ||||||||
| Gold revenue from mining operation | 133,537 | 122,551 | 312,172 | 238,001 | ||||||||
| Cost of sales | ||||||||||||
| Mining | 20,741 | 16,439 | 38,069 | 33,091 | ||||||||
| Processing | 7,943 | 6,535 | 15,059 | 12,930 | ||||||||
| Site administration and camp costs | 16,769 | 12,087 | 30,972 | 24,121 | ||||||||
| Change in inventories | 247 | (4,626 | ) | 3,628 | (5,140 | ) | ||||||
| Royalties | 3,912 | 2,265 | 7,600 | 4,595 | ||||||||
| 49,612 | 32,700 | 95,328 | 69,597 | |||||||||
| Silver revenue | (148 | ) | (114 | ) | (471 | ) | (255 | ) | ||||
| Total cash costs | 49,464 | 32,586 | 94,857 | 69,342 | ||||||||
| Cost of sales per ounce of gold sold | 2,225 | 1,211 | 1,920 | 1,272 | ||||||||
| Cash cost per ounce of gold sold1 | 2,218 | 1,207 | 1,911 | 1,268 | ||||||||
| Operating cash margin1 | 84,073 | 89,965 | 217,315 | 168,659 | ||||||||
| All-in sustaining costs1 | ||||||||||||
| Sustaining mine exploration and development | 6,098 | 8,850 | 14,720 | 16,417 | ||||||||
| Sustaining mine capital equipment | 4,948 | 6,676 | 6,788 | 11,710 | ||||||||
| Sustaining tailings management facility | 80 | 499 | 149 | 624 | ||||||||
| Corporate and general allocation | 1,712 | 3,240 | 5,921 | 6,563 | ||||||||
| Payment of sustaining lease liabilities | 128 | 233 | 253 | 569 | ||||||||
| 62,430 | 52,084 | 122,688 | 105,225 | |||||||||
| All-in sustaining costs per ounce of gold1 | 2,800 | 1,929 | 2,471 | 1,924 | ||||||||
| Cost of sales per tonne milled1 | 685 | 673 | 661 | 641 | ||||||||
| Production costs per tonne milled1 | 631 | 626 | 609 | 598 | ||||||||
| Total capital expenditures | 15,530 | 16,386 | 27,011 | 29,114 | ||||||||
- Refer to the section entitled "Non-IFRS Performance Measures" for the reconciliation of non-IFRS measurements to the financial statements
Operating Highlights
Eagle River gold production decreased by
Eagle River produced 49,644 ounces in the first half of 2026, a decrease of
Mill throughput of 72,439 tonnes in Q2 2026 was
Driven by a
Financial Highlights
In Q2 2026, Eagle River's gold revenue increased by
Cost of sales in Q2 2026 was
Cost of sales for the first half of 2026 totaled
Cash costs per ounce of gold sold increased by
In Q2 2026, AISC per ounce of gold sold increased by
During the first half of 2026, AISC per ounce of gold sold increased by
Exploration Update
Expanding the 6 Central Zone
The 6 Central Zone is considered a priority exploration area given its intermediate depth, proximity to existing mine infrastructure and geological similarities to the 300 Zone at comparable elevations. The zone remains underdrilled and open down plunge and laterally. The 2026 program is designed to further define the geometry and continuity of the high-grade mineralization and test its down-plunge extension, with approximately 9,600 metres planned for the year. Recent results continue to support the interpretation that the high-grade trend extends at depth, and drilling will continue in the second half of the year. Continued success could support future resource growth and provide an additional source of high-grade ore at depths shallower than those currently being mined in the 300 Zone.
Growing the 800 Zone
Growth drilling continued during the quarter. Shears with quartz veining were logged in holes in-filling a gap in drilling that coincided with potential up-plunge continuation of mineralization. The logging observations support the structural and geologic continuation of the zone, with assays pending. Holes designed to test the down-plunge continuation were deferred until later in the year. The 2026 exploration program is targeting to drill approximately 10,000 metres in the 800 Zone.
Growth Drilling in 700 Zone
Growth drilling evaluating the continuation of mineralization in the shallow parts of the mine, 350 Level, returned assays with thickness and grades confirming continuation of the mineralization. Infill drilling as part of conversion continues into the next quarter. Assays from drilling program are pending.
Global Model
The Global Model is a dynamic exploration framework that is continuously updated as new geological, drilling and other technical information becomes available. New prospective areas are added for both conversion and growth as the geological understanding of the Eagle River system evolves, while areas that have been sufficiently drill-tested, or are no longer considered priorities based on technical or geology considerations, are reprioritized.
The contribution of Global Model areas to the 2025 Mineral Reserve additions demonstrates how this systematic process can progressively convert previously unrecognized or underutilized areas of the Eagle River mineralized system into mineable inventory.
Global Model targets are integrated into Eagle River's ongoing underground drilling programs, with typically two to three of the mine's four underground exploration drill rigs testing these areas. During the quarter, drilling continued across several Global Model targets, including conversion drilling of Global Model Target 19 in the deeper portions of the 300 Zone. Results continue to refine the geological interpretation and identify opportunities for resource growth and conversion.
Surface Exploration
Surface holes tested an area of mineralization to the east of No Name Lake (NNL), where historic widely spaced drill holes intersected mineralization. The surface holes were designed to infill and confirm continuation of NNL mineralization. Results will be reported in the last quarter.
At North Diorite, a gradient array IP geophysical survey was completed, aimed at mapping out continuation of quartz veins and sulphide rich horizons highlighted by previous work. Survey results are expected in the third quarter.
At Dorset Main, Dorset West, and Cameron Iron Formation, drilling for geometallurgical sampling for leach and recovery test work, and deportment studies, continued as part of overall deposit resource evaluation.
Helicopter-supported scout drilling was completed at Magnacon East, evaluating the sub-surface potential of quartz veins that returned high-grade assays from rock chip samples collected during semi-regional structural mapping program executed in 2025. The area is located approximately 3 km east of the historic Magnacon mine.
Helicopter-supported scout drilling was also completed at Feather River, located approximately 8km east of Magnacon mine. The holes were designed to evaluate the continuation of quartz veins and sulphide rich horizons highlighted by previous work which included geologic mapping, local IP surveys, and scout drilling which returned anomalous intercepts.
Surface drilling continued at Mishi open pit, evaluating the down-plunge potential of mineralization, and expanding the continuation of near surface mineralization as part of overall resource evaluation. Results are expected to be reported in Q4.
Final products of AI prospectivity mapping were also received during the quarter. ALS Canada Ltd. leveraged data analytics, machine learning and numeric modelling to reprocess and level Eagle River's geophysical, geologic and geochemical data and incorporate the information into their AI related workflow. The prospectivity work has highlighted five new areas that have not been previously considered by the team, further expanding the pipeline of regional exploration opportunities (see Figure 1 below).
Existing high priority work areas represent a combination of high grade (Entirety of Eagle River Deformation Zone, Eagle River Splay/North Diorite) and bulk tonnage lower grade opportunities (Mishibishu – East and West of mines, Dorset East and West, and Central block of Cameron Lake Iron Formation). The prospectivity mapping has flagged an observation that the far east Eagle River Deformation Zone is of similar size to the Eagle River Mine area, and as such warrants priority focus.
The five new prospectivity areas of interest include Feather River South – hosting two areas with minimal surface work and understanding; Mishi West - at the convergence of Iron Lake Deformation Zone; North of Mishi – in a strain shadow of intrusion and possible second thrust zone similar to the Mishibishu Deformation Zone; Rook Lake West – in strain shadow west of Mishibishu Lake Intrusion, where Dorset Deformation Zone may be trending; Southeast portion of Cameron Lake Iron Formation – a complex area with favorable host lithologies and structure. Follow-up field programs to advance the existing high priority work areas, and the five new prospectivity areas of interest will be designed, ranked and scheduled during workshops planned for the third quarter, with the results incorporated into the Company's broader exploration targeting and prioritization process.
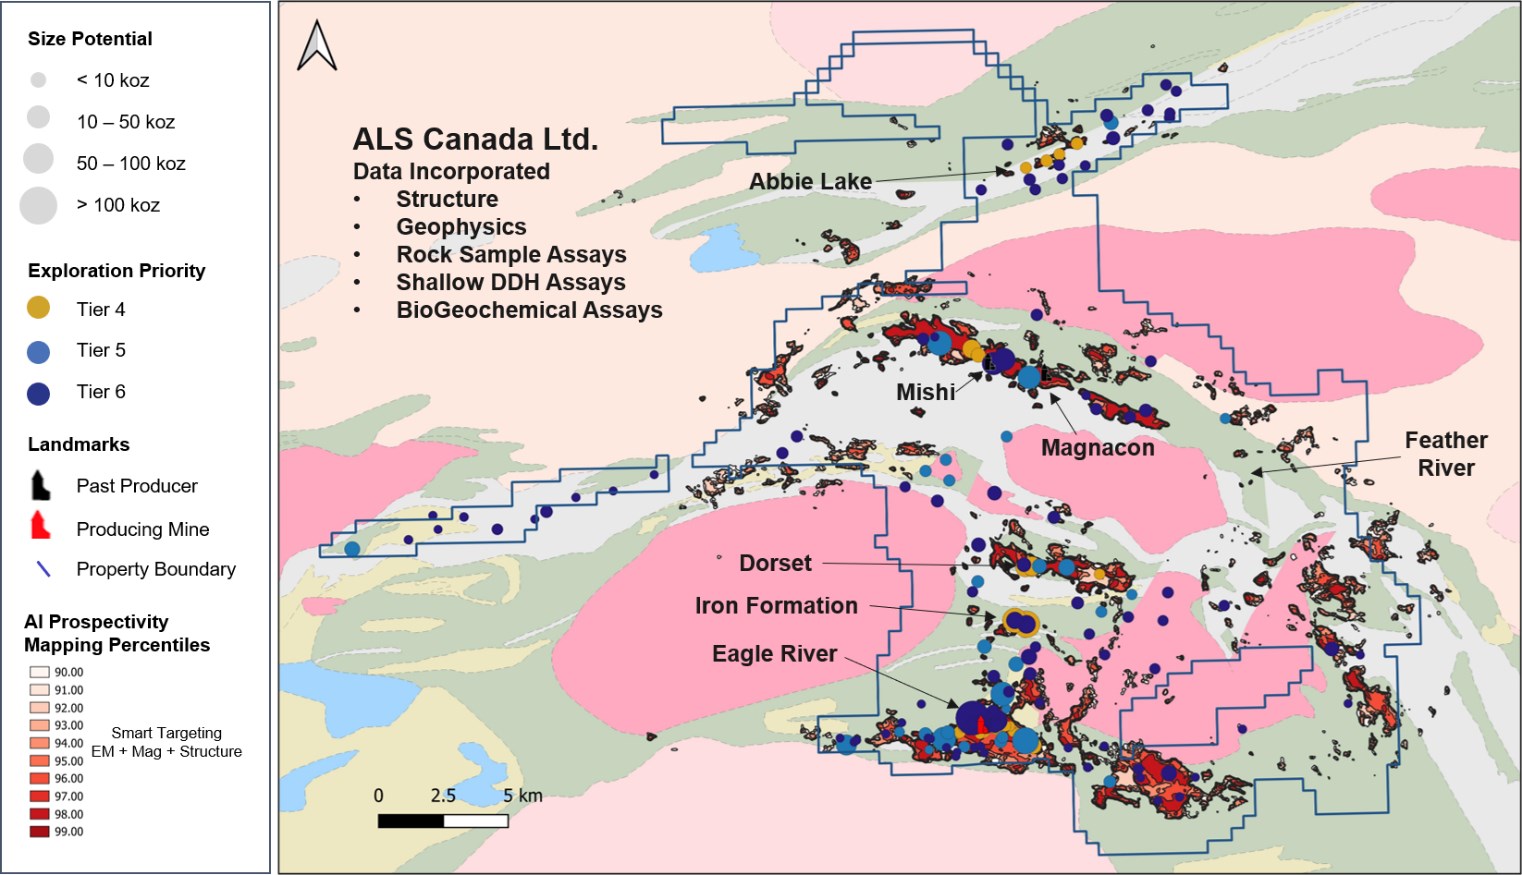
Figure 1: Final output from ALS Canada Ltd. AI prospectivity mapping
To view an enhanced version of this graphic, please visit:
https://images.newsfilecorp.com/files/2397/309589_23305e78d4078887_001full.jpg
Kiena (Quebec, Canada)
Operating and Financial Results
| Q2 2026 | Q2 2025 | H1 2026 | H1 2025 | |||||||||
| Kiena operating results | ||||||||||||
| Ore milled (tonnes) | 62,215 | 50,299 | 117,165 | 98,989 | ||||||||
| Head grade (g/t) | 11.1 | 10.8 | 10.6 | 10.8 | ||||||||
| Average mill recoveries (%) | 98.8 | 98.8 | 98.8 | 98.8 | ||||||||
| Gold production (oz) | 22,026 | 17,169 | 39,483 | 33,862 | ||||||||
| Gold sold (oz) | 21,800 | 18,900 | 40,050 | 36,500 | ||||||||
| Production costs per tonne milled1 ($) | 526 | 526 | 554 | 501 | ||||||||
| Costs per oz of gold sold ($/oz) | ||||||||||||
| Operating cash margin1 | 4,604 | 3,143 | 4,719 | 2,967 | ||||||||
| Cost of sales | 1,501 | 1,401 | 1,621 | 1,359 | ||||||||
| Cash costs1 | 1,489 | 1,397 | 1,607 | 1,354 | ||||||||
| All-in sustaining costs1 | 2,071 | 2,380 | 2,271 | 2,209 | ||||||||
| Costs per oz of gold sold (US$/oz) | ||||||||||||
| Operating cash margin1 | 3,327 | 2,271 | 3,426 | 2,105 | ||||||||
| Cost of sales | 1,085 | 1,012 | 1,176 | 964 | ||||||||
| Cash costs1 | 1,076 | 1,009 | 1,166 | 961 | ||||||||
| All-in sustaining costs1 | 1,497 | 1,720 | 1,649 | 1,567 | ||||||||
- Refer to the section entitled "Non-IFRS Performance Measures" for the reconciliation of these non-IFRS measurements to the financial statements.
| In | Q2 2026 | Q2 2025 | H1 2026 | H1 2025 | ||||||||
| Gold revenue from mining operation | 132,809 | 85,804 | 253,354 | 157,729 | ||||||||
| Cost of sales | ||||||||||||
| Mining | 20,108 | 15,628 | 41,506 | 30,793 | ||||||||
| Processing | 4,878 | 3,815 | 8,646 | 7,351 | ||||||||
| Site administration | 6,789 | 5,426 | 14,745 | 10,673 | ||||||||
| Change in inventories | 945 | 1,612 | 6 | 791 | ||||||||
| 32,720 | 26,481 | 64,903 | 49,608 | |||||||||
| Silver revenue | (270 | ) | (79 | ) | (560 | ) | (181 | ) | ||||
| Total cash costs | 32,450 | 26,402 | 64,343 | 49,427 | ||||||||
| Cost of sales per ounce of gold sold | 1,501 | 1,401 | 1,621 | 1,359 | ||||||||
| Cash cost per ounce of gold sold1 | 1,489 | 1,397 | 1,607 | 1,354 | ||||||||
| Operating cash margin1 | 100,359 | 59,402 | 189,011 | 108,302 | ||||||||
| All-in sustaining costs1 | ||||||||||||
| Sustaining mine exploration and development | 6,186 | 6,191 | 13,589 | 13,548 | ||||||||
| Sustaining mine capital equipment | 2,292 | 8,896 | 4,094 | 10,266 | ||||||||
| Sustaining tailings management facility | (15 | ) | 253 | 456 | 828 | |||||||
| Corporate and general allocation | 4,191 | 3,240 | 8,400 | 6,563 | ||||||||
| Payment of lease liabilities | 45 | - | 84 | - | ||||||||
| 45,149 | 44,982 | 90,966 | 80,632 | |||||||||
| All-in sustaining costs per ounce of gold1 | 2,071 | 2,380 | 2,271 | 2,209 | ||||||||
| Cost of sales per tonne milled | 526 | 526 | 554 | 501 | ||||||||
| Production costs per tonne milled1 | 526 | 526 | 554 | 501 | ||||||||
| Capital expenditures | 29,867 | 31,520 | 54,451 | 51,108 | ||||||||
- Refer to the section entitled "Non-IFRS Performance Measures" for the reconciliation of non-IFRS measurements to the financial statements.
Operating Highlights
In Q2 2026, Kiena produced 22,026 ounces, a
Production in the first half of 2026 totaled 39,483 ounces compared to 33,862 ounces in the first half of 2025 reflecting the addition of Presqu'île ounces and beginning to see improvements to stability from the operating model implementation and the addition of a new mining horizon providing additional mine sequence flexibility at Kiena Deep.
Average grade for the quarter was 11.14 g/t, up from 10.8 g/t in Q2 2025, driven by planned higher grades in Kiena Deep. With the operational flexibility provided by mining two zones in Kiena Deep and the addition of the near surface Presqu'île Zone, as well as the completion of ramp access, full-year 2026 production and grade guidance remain on track.
Production costs per tonne were
Financial Highlights
In Q2 2026, Kiena's gold revenue increased by
Cost of sales in Q2 2026 was
Cash costs per ounce of gold sold in Q2 2026 were
AISC per ounce of gold sold decreased by
Progress at Presqu'île Zone
Development at the Presqu'île Zone progressed as anticipated, and the first stope was blasted mid-July. Stoping and production ramp-up will continue to ramp up through the second half of 2026.
Ramp Breakthrough
Kiena achieved a major milestone in Q2 2026 with the breakthrough of the new ramp to surface, establishing continuous ramp access and significantly increasing flexibility for underground material and equipment movement. Completion of the ramp also enables the ongoing ventilation expansion project, which is expected to double mine ventilation capacity and support increased mining activity and future productivity improvements.
Exploration Update
134 Level
The Norbenite Footwall discovery announced in June continues to build excitement. The reported drill results were exceptional in the two holes which were over 150m apart vertically. Drilling from the 134-level exploration drift continued to evaluate the Norbenite Footwall mineralized zone, with holes in-filling the 150m gap. The new holes intersected geology with similar thickness, veining and localized observations of VG as the previously reported holes, growing confidence in the continuity of the mineralized zone. An exploration update with the results of the drilling is scheduled for quarter three.
Drilling from the 134-level ramp continued to confirm the continuity of the Kiena Deep A and Kiena Deep Footwall zones, with two rigs expected to continue drilling from these platforms over the next two quarters. The results will contribute towards resource growth.
109-Level Exploration Drift
Exploration drilling from the 109-level continued to advance the VC Zone and evaluate the broader mineralized potential of this area. The VC Zone remains open at depth and exhibits a style of mineralization analogous to Kiena Deep, supporting continued exploration of the system. Importantly, drilling from the 109-level has also intersected basalt-hosted mineralization within approximately 100 metres of the drill bay that is being interpreted as a potentially new mineralized zone, distinct from the VC Zone. Follow-up drilling is underway to evaluate the geometry and continuity of this basaltic lens within the surrounding ultramafic sequence.
On 33-Level, exploration drilling tested the northwest continuation of the Shawkey Main zone toward the Wish deposit. Quartz veining was intersected at the targeted depths and assays are pending. Drilling in this area is planned to continue over the next two quarters. A separate hole testing a magnetic-low target south of Dubuisson returned low values.
Surface Exploration
Barge drilling commenced later in the second quarter with one rig at Dubuisson, evaluating the continuation of intrusive unit and mineralization at depth, and a second rig at Tarmac near the historic Siscoe mine and a third rig drilling the Northwest Zone. A fourth rig is scheduled to commence at Wesdome early in the third quarter.
Drilling with a land-based rig has also commenced at Shawkey South/Shawkey 10, evaluating the bulk tonnage style of mineralization at depth.
OUTLOOK
2026 Consolidated Guidance Commentary
The information below reflects the Company's current forecast for the full year.
Consolidated Gold Production: 180,000 to 205,000 ounces (midpoint 192,500 ounces)
The Company remains on track to meet its full-year gold production guidance of 180,000 to 205,000 ounces (midpoint 192,500 ounces), with H1 production of 89,127 ounces representing
46% of the midpoint.Eagle River is expected to achieve its full-year production guidance range of 105,000 to 115,000 ounces at a lower average grade of 11.5-12.5 g/t compared to initial guidance range of 13.0-14.0 g/t. In H2 2026, the continued integration of Global Model ore into the mine plan will drive higher mill throughput and improved grades compared to H1 2026.
Kiena is expected to achieve its 75,000-to-90,000-ounce guidance at an average grade of 8.0-9.5 g/t, broadly in line with reserve grades. Nearly
60% of output is weighted to H2 2026, reflecting improved operational stability at Kiena Deep and incremental contributions from Presqu'île.
Depreciation and Depletion:
$100 million (previously$130 million )Based on the updated Technical Reports and the mineral reserves published on June 24, 2026, the Company is lowering its guidance for depreciation and depletion from
$130 million to$100 million .
Cash Costs Per Ounce Sold: US
$1,050 t o US$1,150 (midpoint: US$1,100) Consolidated cash costs per ounce of gold sold are expected to fall within the 2026 guidance range of US
$1,050 t o US$1,150 .As outlined in its original guidance (see the Company's release dated January 20, 2026), Eagle River's cash costs per ounce sold are expected to increase in 2026 over the prior year, primarily reflecting higher royalties from higher revenue.
Kiena's cash costs per ounce sold are expected to be at the upper end of guidance due to higher input costs, primarily labour and contractors.
All-in Sustaining Costs Per Ounce Sold: US
$1,525 t o US$1,700 (midpoint: US$1,612) Consolidated all-in sustaining costs per ounce of gold sold are expected to fall within the initial 2026 guidance range of US
$1,525 t o US$1,700 .Eagle River's Q2 2026 AISC of US
$2,023 per ounce sold was higher than its guidance range of US$1,525 t o US$1,675 per ounce sold. However, Eagle River is anticipated to achieve full-year guidance as higher grade in H2 2026 is expected to offset higher sustaining capex and result in lower AISC per ounce sold in the second half of the year.Kiena remains on track to achieve its annual AISC guidance of US
$1,525 t o US$1,750 per ounce sold.
Total Capital Investments:
$205 million Based on our most recent forecast, full-year consolidated capital spend could track up to
10% higher than initial guidance of$205 million , primarily driven by the timing of growth expenditures.
The following table outlines Wesdome's updated 2026 guidance compared to its initial guidance set forth in the Company's press release dated January 20, 2026:
| Unit | Eagle River | Kiena | Consolidated Guidance | ||||
| Previous Jan 20, 2026 | Updated Aug 13, 2026 | Previous Jan 20, 2026 | Updated Aug 13, 2026 | Previous Jan 20, 2026 | Updated Aug 13, 2026 | ||
| Production | |||||||
| Head grade | (g/t) | 13.0 - 14.0 | 11.5 - 12.5 | 8.0 - 9.5 | 8.0 - 9.5 | 10.0 - 12.0 | 10.0 - 11.0 |
| Gold production | (oz) | 105,000 - 115,000 | 105,000 - 115,000 | 75,000 - 90,000 | 75,000 - 90,000 | 180,000 - 205,000 | 180,000 - 205,000 |
| Operating Costs | |||||||
| Depreciation and depletion | ($M) | ||||||
| Corporate and general1 | ($M) | ||||||
| Exploration and evaluation2 | ($M) | ||||||
| Cash costs3,4 | (US$/oz) | ||||||
| All-in sustaining costs3,4 | (US$/oz) | ||||||
| Capital Investment3 | |||||||
| Sustaining capital3 | ($M) | ||||||
| Growth capital3 | ($M) | ||||||
| Total capital investment | ($M) | ||||||
- Consolidated guidance for 2026 corporate and general costs excludes an estimated
$9 million in stock-based compensation. Corporate general and administrative costs of$30 million is allocated equally to each mine and is included in the Company's calculation of all-in sustaining costs. - Exploration and evaluation costs primarily include surface drilling activities and regional office expenses and are not included in all-in sustaining costs.
- Refer to the section entitled "Non-IFRS Performance Measures" for the reconciliation of non-IFRS measurements to the financial statements.
- Based on a USD/CAD exchange rate of
$1.38 .
Webcast
Management will host a conference call and webcast to discuss the Company's Q2 2026 financial and operating results. A question-and-answer session will follow management's prepared remarks. Details of the webcast are as follows:
| Date and time: | Friday, August 14, 2026 at 10:00 a.m. ET |
| Dial-in numbers: | To access the call by telephone, dial 1.646.968.2525 or 1.888.596.4144 (toll-free). The event passcode is: 8215935. Please allow up to 10 minutes to be connected. |
| Webcast link: | https://events.q4inc.com/attendee/255950472 Pre-registration is required for this event. It is recommended you join 10 minutes prior to the start of the event. The webcast can also be accessed from the home page of the Company's website at www.wesdome.com. |
The financial statements and management's discussion and analysis will be available on the Company's website at www.wesdome.com and on SEDAR+ www.sedarplus.ca the evening of Thursday, August 13, 2026.
About Wesdome
Wesdome is a Canadian-focused gold producer with two high-grade underground assets, the Eagle River mine in Ontario and the Kiena mine in Québec. The Company's primary goal is to responsibly leverage its operating platform and high-quality brownfield and greenfield exploration pipeline to build a growing value-driven mid-tier gold producer.
For More Information
| Raj Gill SVP, Corporate Development & Investor Relations Phone: +1.416.360.3743 E-Mail: invest@wesdome.com | Trish Moran VP, Investor Relations Phone: +1.416.564.4290 E-mail: trish.moran@wesdome.com |
Technical Disclosure
The technical and geoscientific content of this press release have been reviewed, and approved by Peter Gula,
P. Eng and General Manager of Eagle River Mine (wholly owned by Wesdome), a "Qualified Person" as defined in National Instrument 43-101 - Standards of Disclosure for Mineral Projects.
Forward-Looking Statements
This press release contains "forward-looking information" within the meaning of applicable Canadian securities legislation, which is based on expectations, estimates, projections, and interpretations as of the date of this release. Forward-looking information includes, without limitation, statements or information with respect to: the timing of the webcast to discuss the Q2 results; the total aggregate number of shares the Company intends to repurchase under its normal course issuer bid; the reaffirmation of the Company's full year production and cost guidance; the expectation of grade improvement in the second half of the year at Eagle River, along with Eagle River being on track to deliver its full year production and cost targets; the June technical reports preserving significant upside from operational optimization, resource conversion and exploration; the emergence of district-scale opportunities around both Eagle River and Kiena; Eagle River continuing to incorporate global model ore into the mine plan sequence in the second half of 2026; the expectation that production costs at Egale River will start to decline in the second half of 2026; the expectation that the rate of capital expenditures at Eagle River will increase in the second half of 2026, with higher ounce production expected to offset higher sustaining capex and result in lower AISC in H2 2026; the expectation that Eagle River's AISC per ounce of gold will fall within its full-year guidance range; details and plans of the 2026 drilling program at Eagle River with respect to the various zones and areas, including timing of when results will be reported; the potential for five new mining areas that were identified by AI prospectivity mapping that could further expand the pipeline of regional exploration opportunities, along with the planned steps and activities (and related timing) in respect of these five new prospectivity areas of interest; the ramp-up at Kiena remaining on track for H2 2026; full-year 2026 production and grade guidance at Kiena remaining on track; the anticipation that sustaining capital for Kiena will increase in H2 2026, with guidance on track for the year; the expectation that stoping and production of the Presqu'île Zone will continue to ramp up through H2 2026; details and plans of the 2026 drilling program at Kiena with respect to the various zones and areas, including timing of when results will be reported; the Company's outlook and forecast for the full year, including in respect of Consolidated Gold Production, Depreciation and Depletion, Cash Costs per Ounce, All-in Sustaining Costs per Ounce and Total Capital Investments.
These forward-looking statements involve various risks and uncertainties and are based on certain factors and assumptions. Furthermore, should one or more of the risks, uncertainties or other factors materialize, or should underlying assumptions prove incorrect, actual results may vary materially from those described in forward-looking statements or information. These risks, uncertainties and other factors including those risk factors discussed in the sections titled "Cautionary Note Regarding Forward-Looking Information" and "Risks and Uncertainties" in the Company's most recent Annual Information Form. Readers are urged to carefully review the detailed risk discussion in our most recent Annual Information Form which is available on SEDAR+ and on the Company's website.
There can be no assurance that forward-looking statements or information will prove to be accurate, as actual results and future events could differ materially from those anticipated in such statements. The Company undertakes no obligation to update forward-looking statements if circumstances, management's estimates or opinions should change, except as required by securities legislation. Accordingly, the reader is cautioned not to place undue reliance on forward-looking statements.
Non-IFRS Performance Measures
Wesdome uses non-IFRS performance measures throughout this MD&A as it believes that these generally accepted industry performance measures provide a useful indication of the Company's operational performance. These non-IFRS performance measures do not have standardized meanings defined by IFRS and may not be comparable to information in other gold producers' reports and filings. Accordingly, it is intended to provide additional information and should not be considered in isolation or as a substitute for measures of performance prepared in accordance with IFRS.
The non-IFRS performance measures include:
Average realized price per ounce of gold sold
Cash costs and cash costs per ounce of gold sold
Production costs per tonne milled
Operating cash margin and operating cash margin per ounce of gold sold
Sustaining capital and growth capital
AlSC and AISC per ounce of gold sold
Free cash flow and free cash flow per share
Adjusted net income and adjusted net earnings per share
EBITDA
Average Realized Price per Ounce of Gold Sold
Average realized price per ounce of gold sold is a non-IFRS measure and does not constitute a measure recognized by IFRS and does not have a standardized meaning defined by IFRS. Average realized price per ounce of gold sold is calculated by dividing gold revenue from the Company's mining operations for the relevant period by the ounces of gold sold. It may not be comparable to information in other gold producers' reports and filings.
| In | Q2 2026 | Q2 2025 | H1 2026 | H1 2025 | ||||||||
| Revenue per financial statements | 266,764 | 208,548 | 566,557 | 396,166 | ||||||||
| Silver revenue from mining operations | (418 | ) | (193 | ) | (1,031 | ) | (436 | ) | ||||
| Gold revenue from mining operations (a) | 266,346 | 208,355 | 565,526 | 395,730 | ||||||||
| Ounces of gold sold (b) | 44,100 | 45,900 | 89,700 | 91,200 | ||||||||
| Average realized price per ounce of gold sold CAD (c) = (a) ÷ (b) | 6,040 | 4,539 | 6,305 | 4,339 | ||||||||
| Average USD/CAD exchange rate (d) | 1.3838 | 1.3841 | 1.3777 | 1.4095 | ||||||||
| Average realized price per ounce of gold sold USD (c) ÷ (d) | 4,365 | 3,279 | 4,576 | 3,078 | ||||||||
Cash Costs and Cash Costs per Ounce of Gold Sold
Cash costs per ounce of gold sold is a non-IFRS performance measure and does not constitute a measure recognized by IFRS and does not have a standardized meaning defined by IFRS, as well it may not be comparable to information in other gold producers' reports and filings. The Company has included this non-IFRS performance measure throughout this document as it believes that this generally accepted industry performance measure provides a useful indication of the Company's operational performance. The Company believes that, in addition to conventional measures prepared in accordance with IFRS, certain investors use this information to evaluate the Company's operating performance and ability to generate cash flow. Accordingly, it is intended to provide additional information and should not be considered in isolation or as a substitute for measures of performance prepared in accordance with IFRS. The following table provides a reconciliation of total cash costs per ounce of gold sold to cost of sales per the financial statements:
| In | Q2 2026 | Q2 2025 | H1 2026 | H1 2025 | ||||||||
| Cost of sales per financial statements (a) | 82,332 | 59,181 | 160,232 | 119,205 | ||||||||
| Silver revenue from mining operations | (418 | ) | (193 | ) | (1,031 | ) | (436 | ) | ||||
| Cash costs (b) | 81,914 | 58,988 | 159,201 | 118,769 | ||||||||
| Ounces of gold sold (c) | 44,100 | 45,900 | 89,700 | 91,200 | ||||||||
| Cost of sales per ounce of gold sold (d) = (a) ÷ (c) | 1,867 | 1,289 | 1,786 | 1,307 | ||||||||
| Cash costs per ounce of gold sold (e) = (b) ÷ (c) | 1,857 | 1,285 | 1,775 | 1,302 | ||||||||
| Average USD/CAD exchange rate (f) | 1.3838 | 1.3841 | 1.3777 | 1.4095 | ||||||||
| Cost of sales per ounce of gold sold USD (d) ÷ (f) | 1,349 | 932 | 1,297 | 927 | ||||||||
| Cash costs per ounce of gold sold USD (e) ÷ (f) | 1,342 | 929 | 1,288 | 924 | ||||||||
Production Costs and Production Costs per Tonne Milled
Production costs per tonne milled is a non-IFRS performance measure and does not constitute a measure recognized by IFRS and does not have a standardized meaning defined by IFRS, and as well it may not be comparable to information in other gold producers' reports and filings. As illustrated in the table below, this measure is calculated by adjusting cost of sales, as shown in the statements of income for non-cash depletion and depreciation, royalties and inventory level changes and then dividing by tonnes processed through the mill. Management believes that production costs per tonne milled provides additional information regarding the performance of mining and milling operations and allows management to monitor operating costs on a more consistent basis as the per tonne milled measure reduces the cost variability associated with varying production levels. Management also uses this measure to determine the economic viability of mining blocks. As each mining block is evaluated based on the net realizable value of each tonne milled, the estimated revenue on a per tonne basis must be in excess of the production costs per tonne milled in order to be economically viable. Management is aware that this per tonne milled measure is impacted by fluctuations in throughput and thus uses this evaluation tool in conjunction with cost of sales prepared in accordance with IFRS. This measure supplements cost of sales information prepared in accordance with IFRS and allows investors to distinguish between changes in cost of sales resulting from changes in production versus changes in operating performance.
| In | Q2 2026 | Q2 2025 | H1 2026 | H1 2025 | ||||||||
| Cost of sales per financial statements (a) | 82,332 | 59,181 | 160,232 | 119,205 | ||||||||
| Royalties | (3,912 | ) | (2,265 | ) | (7,600 | ) | (4,595 | ) | ||||
| Bullion and in-circuit inventory adjustments | (105 | ) | (2,982 | ) | (455 | ) | (1,145 | ) | ||||
| Production costs (b) | 78,315 | 53,934 | 152,177 | 113,465 | ||||||||
| Ore milled (tonnes) (c) | 134,654 | 98,922 | 261,335 | 207,622 | ||||||||
| Cost of sales per tonne milled (a) ÷ (c) | 611 | 598 | 613 | 574 | ||||||||
| Production costs per tonne milled (b) ÷ (c) | 582 | 575 | 584 | 552 | ||||||||
Operating Cash Margin and Operating Cash Margin per Ounce of Gold Sold
Operating cash margin is a non-IFRS measure and does not constitute a measure recognized by IFRS and does not have a standardized meaning defined by IFRS, and as well it may not be comparable to information in other gold producers' reports and filings. It is calculated as the difference between gold revenue from mining operations and cash mine site operating costs (see cash costs per ounce of gold sold section above) per the Company's financial statements. The Company believes operating cash margin illustrates the performance of the Company's operating mines and enables investors to better understand the Company's performance in comparison to other gold producers who present results on a similar basis.
| In | Q2 2026 | Q2 2025 | H1 2026 | H1 2025 | ||||||||
| Gold revenue from mining operations | 266,346 | 208,355 | 565,526 | 395,730 | ||||||||
| Cash costs | 81,914 | 58,988 | 159,201 | 118,769 | ||||||||
| Operating cash margin | 184,432 | 149,367 | 406,325 | 276,961 | ||||||||
| Average realized price (a) | 6,040 | 4,539 | 6,305 | 4,339 | ||||||||
| Cash costs per ounce of gold sold (b) | 1,857 | 1,285 | 1,775 | 1,302 | ||||||||
| Operating cash margin per ounce of gold sold (a) - (b) | 4,183 | 3,254 | 4,530 | 3,037 | ||||||||
Sustaining Capital and Growth Capital
Sustaining capital expenditures are generally defined as expenditures that support the ongoing operation of the asset or business without any associated increase in capacity, life of assets or future earnings. This measure is being used by management to understand the ongoing capital cost required to maintain operations at current levels. In Q2 2026, there was a reclass adjustment related to Eagle River exploration activities.
Growth capital expenditures are generally defined as capital expenditures that expand existing capacity, increase life of assets and/or increase future earnings. This measure is used by management to understand the costs of developing new operations or major projects at existing operations where these projects will materially increase production from current levels.
| In | Q2 2026 | Q2 2025 | H1 2026 | H1 2025 | ||||||||
| Mining properties and plant and equipment | ||||||||||||
| Eagle River | ||||||||||||
| Sustaining mine exploration | (1,108 | ) | 2,070 | 1,385 | 3,864 | |||||||
| Sustaining mine development | 7,206 | 6,780 | 13,335 | 12,553 | ||||||||
| Sustaining mine capital equipment | 4,948 | 6,676 | 6,788 | 11,710 | ||||||||
| Sustaining tailings management facility | 80 | 499 | 149 | 624 | ||||||||
| 11,126 | 16,025 | 21,657 | 28,751 | |||||||||
| Kiena | ||||||||||||
| Sustaining mine exploration | 159 | 2,099 | 431 | 4,463 | ||||||||
| Sustaining mine development | 6,027 | 4,092 | 13,158 | 9,085 | ||||||||
| Sustaining mine capital equipment | 2,292 | 8,896 | 4,094 | 10,266 | ||||||||
| Sustaining tailings management facility | (15 | ) | 253 | 456 | 828 | |||||||
| 8,463 | 15,340 | 18,139 | 24,642 | |||||||||
| Total sustaining capital | 19,589 | 31,365 | 39,796 | 53,393 | ||||||||
| Mines under development and plant and equipment | ||||||||||||
| Growth mine development | 17,656 | 8,125 | 29,648 | 15,462 | ||||||||
| Ramp development | 424 | 472 | 811 | 472 | ||||||||
| Growth mine capital equipment | 7,728 | 7,944 | 11,207 | 10,895 | ||||||||
| Total growth capital | 25,808 | 16,541 | 41,666 | 26,829 | ||||||||
| Total sustaining and growth capital | 45,397 | 47,906 | 81,462 | 80,222 | ||||||||
AISC and AISC per Ounce of Gold Sold
AISC includes mine site operating costs incurred at the Company's mining operations, sustaining mine capital and development expenditures, mine site exploration and evaluation expenditures and equipment lease payments related to the mine operations and corporate and general expenses. The Company believes that this measure represents the total cash costs of producing gold from current operations and provides the Company and other stakeholders with additional information that illustrates its operational performance and ability to generate cash flow. This cost measure seeks to reflect the total cost of gold production from current operations on a per ounce of gold sold basis. New project and growth capital are not included. Wesdome is targeting to begin calculating AISC in accordance with the World Gold Council guidelines starting in the 2027 calendar year in conjunction with IFRS 18 reporting changes, ensuring alignment with industry standards and improved comparability for investors.
| In | Q2 2026 | Q2 2025 | H1 2026 | H1 2025 | ||||||||
| Cost of sales, per financial statements | 82,332 | 59,181 | 160,232 | 119,205 | ||||||||
| Silver revenue from mining operations | (418 | ) | (193 | ) | (1,031 | ) | (436 | ) | ||||
| Cash costs | 81,914 | 58,988 | 159,201 | 118,769 | ||||||||
| Sustaining mine exploration and development | 12,284 | 15,041 | 28,309 | 29,965 | ||||||||
| Sustaining mine capital equipment | 7,240 | 15,572 | 10,882 | 21,976 | ||||||||
| Sustaining tailings management facility | 65 | 752 | 605 | 1,452 | ||||||||
| Corporate and general | 10,763 | 6,667 | 20,017 | 13,384 | ||||||||
| Less: Corporate development and non-sustaining items | (4,860 | ) | (187 | ) | (5,696 | ) | (258 | ) | ||||
| Payment of lease liabilities | 173 | 233 | 337 | 569 | ||||||||
| AISC (a) | 107,579 | 97,066 | 213,655 | 185,857 | ||||||||
| Ounces of gold sold (b) | 44,100 | 45,900 | 89,700 | 91,200 | ||||||||
| AISC per ounce of gold sold (c) = (a) ÷ (b) | 2,439 | 2,115 | 2,382 | 2,038 | ||||||||
| Average USD/CAD exchange rate (d) | 1.3838 | 1.3841 | 1.3777 | 1.4095 | ||||||||
| AISC per ounce of gold sold USD (c) ÷ (d) | 1,763 | 1,528 | 1,729 | 1,446 | ||||||||
Free Cash Flow and Free Cash Flow per Share
Free cash flow is a non-IFRS measure and is calculated by taking net cash provided by operating activities less cash used in capital expenditures and lease payments as reported in the Company's financial statements. Free cash flow is a useful indicator of the Company's ability to operate without reliance on additional borrowing or usage of existing cash. Free cash flow per share is calculated by dividing free cash flow by the weighted average number of shares outstanding for the period.
| In | Q2 2026 | Q2 2025 | H1 2026 | H1 2025 | ||||||||
| Net cash from operating activities per financial statements (a) | 87,538 | 100,920 | 249,359 | 181,076 | ||||||||
| Sustaining mine exploration and development | (12,284 | ) | (15,041 | ) | (28,309 | ) | (29,965 | ) | ||||
| Sustaining mine capital equipment | (7,240 | ) | (15,572 | ) | (10,882 | ) | (21,976 | ) | ||||
| Sustaining tailings management facility | (65 | ) | (752 | ) | (605 | ) | (1,452 | ) | ||||
| Growth mine exploration and development | (18,080 | ) | (8,597 | ) | (30,459 | ) | (15,934 | ) | ||||
| Growth mine capital equipment | (7,728 | ) | (7,944 | ) | (11,207 | ) | (10,895 | ) | ||||
| Funds held against standby letters of credit | - | 143 | 313 | 143 | ||||||||
| Payment of lease liabilities | (369 | ) | (233 | ) | (576 | ) | (569 | ) | ||||
| Free cash flow (b) | 41,772 | 52,924 | 167,634 | 100,428 | ||||||||
| Weighted average number of common shares (000s) (c) | 147,584 | 150,290 | 148,893 | 150,099 | ||||||||
| Per share data | ||||||||||||
| Operating cash flow per share (a) ÷ (c) | 0.59 | 0.67 | 1.67 | 1.21 | ||||||||
| Free cash flow per share (b) ÷ (c) | 0.28 | 0.35 | 1.13 | 0.67 | ||||||||
Adjusted Net Income and Adjusted Net Earnings per Share
Adjusted net income and adjusted net earnings per share are non-IFRS performance measures and do not constitute a measure recognized by IFRS and do not have standardized meanings defined by IFRS, and as well both measures may not be comparable to information in other gold producers' reports and filings. Adjusted net income is calculated by removing the one-time gains and losses resulting from the disposition of non-core assets, non-recurring expenses and significant tax adjustments (mining tax recognition and exploration credit refunds) not related to the current period's income, as detailed in the table below. The Company discloses this measure, which is based on its financial statements, to assist in the understanding of the Company's operating results and financial position.
| In | Q2 2026 | Q2 2025 | H1 2026 | H1 2025 | ||||||||
| Net income per financial statements | 93,955 | 82,696 | 212,837 | 145,169 | ||||||||
| Adjustments for: | ||||||||||||
| - | - | - | - | |||||||||
| Non-recurring payments & strategic initiatives | 3,453 | - | 3,453 | - | ||||||||
| Consideration for Goldshore royalty rights | - | (6,633 | ) | - | (6,633 | ) | ||||||
| Executive departure costs | 110 | 725 | 810 | 725 | ||||||||
| Total adjustments | 3,563 | (5,908 | ) | 4,263 | (5,908 | ) | ||||||
| Related income tax effect | (1,247 | ) | 2,068 | (1,492 | ) | 2,068 | ||||||
| 2,316 | (3,840 | ) | 2,771 | (3,840 | ) | |||||||
| Adjusted net income (a) | 96,271 | 78,856 | 215,608 | 141,329 | ||||||||
| Basic weighted number of common shares (000s) (b) | 147,584 | 150,290 | 148,893 | 150,099 | ||||||||
| Adjusted net earnings per share (a) ÷ (b) | 0.65 | 0.52 | 1.45 | 0.94 | ||||||||
EBITDA
Earnings before interest, taxes and depreciation and amortization ("EBITDA") is a non-IFRS financial measure which excludes the following items from net income (loss): interest expense, mining and income tax expense (recovery) and depletion and depreciation. The Company believes that, in addition to conventional measures prepared in accordance with IFRS, the Company and certain investors use EBITDA as an indicator of Wesdome's ability to generate liquidity from net cash from operating activities to fund working capital needs, service debt obligations and fund capital expenditures. EBITDA is intended to provide additional information to investors and analysts and do not have any standardized definition under IFRS and should not be considered in isolation or as a substitute for measures of performance prepared in accordance with IFRS. EBITDA excludes the impact of cash costs of financing activities and taxes, and the effects of changes in operating working capital balances and therefore are not necessarily indicative of operating profit or net cash from operating activities as determined under IFRS. Other producers may calculate EBITDA differently.
| In | Q2 2026 | Q2 2025 | H1 2026 | H1 2025 | ||||||||
| Net income per financial statements | 93,955 | 82,696 | 212,837 | 145,169 | ||||||||
| Adjustments for: | ||||||||||||
| Mining and income tax expense | 48,488 | 44,106 | 113,586 | 76,487 | ||||||||
| Depletion and depreciation | 23,219 | 17,195 | 50,298 | 41,415 | ||||||||
| Non-recurring income and expenses | 3,563 | (5,908 | ) | 4,263 | (5,908 | ) | ||||||
| Interest expense | 450 | 310 | 924 | 595 | ||||||||
| EBITDA | 169,675 | 138,399 | 381,908 | 257,758 | ||||||||
Endnotes
- Refer to "Non-IFRS Performance Measures" for the reconciliation of non-IFRS measurements to the financial statements.
- Revenue includes
$0.4 million for Q2 2026,$0.2 million for Q2 2025,$1.0 million for H1 2026 and$0.4 million for H1 2025, from the sale of by-product silver. - Operating cash flow per share is calculated by dividing net cash from operating activities by basic weighted average number of common shares.
- Cost of sales per ounce of gold sold is calculated by dividing the cost of sales by the number of ounces of gold sold.
- Working capital is the sum of current assets less current liabilities on the statements of financial position.

To view the source version of this press release, please visit https://www.newsfilecorp.com/release/309589
FAQ
AI-generated questions and answers. How Rhea-AI works. Not financial advice.