
Meet the dual shopper: Nearly 1 in 13 for-sale shoppers also engage with rentals
Rhea-AI Summary
Z (Zillow) analysis finds that 7.6% of U.S. for-sale shoppers also browse rentals, creating a cohort called “dual shoppers.” Dual shoppers most often look at three-bedroom homes and face a median $415 monthly owning-versus-renting gap.
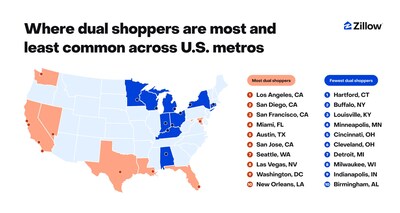
Dual shopping is concentrated in high-cost metros (Los Angeles 12.0%, San Diego 10.8%, San Francisco 10.1%, San Jose gap $3,438), while more affordable metros show lower shares (Hartford 4.2%). Zillow cites BuyAbility and rent-calculator tools and new AI mode to help compare options.
Positive
- Dual shoppers represent 7.6% of U.S. for-sale shoppers
- Highest metro share: Los Angeles 12.0%
- Dual shoppers keep consistent home preferences: three bedrooms
Negative
- Median $415 monthly premium to own versus rent nationwide
- Extreme ownership gap in San Jose: $3,438 monthly
- Coastal metros may require ~two-thirds of median income for mortgage
News Market Reaction – ZG
In the Apr 14 session, ZG gained 0.91%, reflecting a mild positive market reaction. Argus tracked a peak move of +2.6% during that session. Our momentum scanner triggered 9 alerts that day, indicating moderate trading interest and price volatility.
Data tracked by StockTitan Argus on the day of publication.
Key Figures
Historical Context
| Date | Event | Sentiment | 24h Move | Catalyst |
|---|---|---|---|---|
| Apr 10 | Platform expansion | Positive | -1.8% | More brokerages joined Zillow Preview, expanding pre-market listing exposure. |
| Apr 7 | Earnings schedule | Neutral | +1.6% | Announced timing of first-quarter 2026 earnings release and conference call. |
| Apr 6 | Housing data report | Positive | +2.9% | Reported March housing acceleration with higher pending listings and home values. |
| Apr 2 | Market rankings | Positive | +0.4% | Named Jacksonville and other metros as top markets for first-time buyers. |
| Mar 25 | Platform adoption | Positive | -3.8% | Announced rapid brokerage uptake of Zillow Preview pre-market listings. |
24h Move is the share-price change in the day after each event; other market factors may also have contributed.
Recent informational and product-related releases often saw modestly positive price reactions, but there are instances where seemingly positive platform news coincided with next-day declines.
Over the past few weeks, Zillow has issued several platform- and housing-data-focused updates. On Mar 25 and Apr 10, Zillow Preview expansion news coincided with next-day moves of -3.75% and -1.75%, showing that upbeat product headlines did not always translate into gains. In contrast, a housing market report on Apr 6 and a first-time buyer market ranking on Apr 2 aligned with price increases of 2.88% and 0.42%. The earnings-date notice on Apr 7 saw a 1.56% rise, underscoring generally constructive, but not uniformly positive, reactions to news.
Key Terms
mortgage financial
down payment financial
monthly ownership costs financial
Zestimate technical
rent affordability calculator financial
AI-generated analysis. How Rhea-AI works. Not financial advice.




Dual shoppers — those engaging with for-sale and rental listings — are weighing both options as affordability reshapes housing decisions
- Dual shoppers are most common in
Los Angeles (12% ),San Diego (10.8% ) andSan Francisco (10.1% ). - Dual shoppers gravitate toward homes with the same number of bedrooms across both for-sale and rental listings, reflecting consistent preferences.
- Across the
U.S. , homes that dual-intent shoppers engage with have monthly mortgage payments about$415
Because Zillow hosts both for-sale and rental listings, it offers a unique window into how shoppers navigate between the two markets. Dual shoppers tend to focus on similar types of homes — most often three-bedroom properties — suggesting their lifestyle needs remain consistent even as they consider different paths. Rather than changing what they want in a home, many are straddling the fence between renting and buying, deciding which option best fits their budget and long-term goals.
In most cases, that decision likely comes down to monthly costs. For the homes dual-intent shoppers consider, owning is typically
"In today's market, affordability is fundamentally changing how people approach their housing search," said Zillow Senior Economist Kara Ng. "More shoppers are weighing renting and buying side by side, especially as the monthly cost of owning continues to outpace rents in many markets."
Dual shoppers typically explore larger homes when browsing for-sale listings — the rentals they consider are, on average, 284 square feet smaller. Even so, these rental properties often provide higher value per square foot — based on Zestimate® comparisons — suggesting they may feature newer finishes, updated amenities or more efficient layouts.
Dual shopping is more prevalent in markets where affordability constraints create a steep financial divide between owning and leasing.
At the other end of the spectrum, dual shopping is less common in more affordable markets, where homeownership is more feasible for shoppers. Metros with a higher share of affordable inventory, lower home price to income ratio and fewer years for potential buyers to save for a down payment are associated with lower shares of for-sale shoppers also engaging with rentals.
"In the past, you were either a buyer or a renter, and those two paths rarely met. But on Zillow, those aisles are right next to each other, and we're seeing shoppers toggle between a for-sale listing and a rental in the same neighborhood as they weigh which option works better for their life," said Ng. "Having both platforms integrated allows for a level of transparency that didn't exist a decade ago. It empowers shoppers to weigh the long-term benefits of equity against the immediate flexibility of a lease without ever having to leave their couch or the app."
For shoppers comparing renting and buying, Zillow provides tools such as BuyAbility℠, which helps estimate their purchasing power, and a rent affordability calculator to gauge what's within their reach. Together, these tools make it easier to compare monthly costs and evaluate options side by side — while Zillow's new AI mode helps bring these insights to the surface through natural language requests, like "Show me what's available to rent or buy within my monthly budget."
Metro area* | Share of dual shoppers | Median monthly | Median square footage |
7.6 % | 284 | ||
12.0 % | 219 | ||
10.8 % | 200 | ||
10.1 % | 215 | ||
9.4 % | 160 | ||
9.0 % | 207 | ||
9.0 % | 145 | ||
8.5 % | 199 | ||
8.0 % | 87 | ||
7.6 % | 190 | ||
7.5 % | 362 | ||
7.4 % | 253 | ||
7.4 % | 250 | ||
7.3 % | 293 | ||
7.2 % | 167 | ||
7.1 % | 319 | ||
6.8 % | 155 | ||
6.7 % | 191 | ||
6.7 % | 200 | ||
6.7 % | 190 | ||
6.6 % | 288 | ||
6.6 % | 210 | ||
6.6 % | 189 | ||
6.5 % | 321 | ||
6.4 % | 260 | ||
6.4 % | 256 | ||
6.3 % | 136 | ||
6.3 % | 238 | ||
6.3 % | 295 | ||
6.2 % | 314 | ||
6.2 % | 304 | ||
6.1 % | 146 | ||
6.1 % | 310 | ||
6.1 % | 169 | ||
6.0 % | 245 | ||
6.0 % | 318 | ||
6.0 % | 235 | ||
5.9 % | 230 | ||
5.7 % | 390 | ||
5.6 % | 248 | ||
5.5 % | 214 | ||
5.3 % | 297 | ||
5.1 % | 349 | ||
4.9 % | 289 | ||
4.8 % | - | 418 | |
4.8 % | 385 | ||
4.7 % | - | 272 | |
4.6 % | 458 | ||
4.3 % | 278 | ||
4.3 % | - | 252 | |
4.2 % | 356 |
* | Table ordered by share of dual shoppers |
** | Among homes that dual shoppers engage with. Positive values indicate the median for-sale option is more expensive or larger than the median rental option |
Methodology
This analysis uses anonymized Zillow user activity to understand how people shop for homes, particularly when weighing the decision to rent versus buy. Zillow identified users who actively engaged with listings by saving or sharing a home, grouping activity by month and region. Each user was categorized based on whether they interacted with for-sale listings, rental listings or both. Zillow then analyzed the characteristics of homes these users engaged with, including size, bedrooms, age and estimated value. For for-sale homes, Zillow estimated monthly ownership costs based on list price, assuming a
About Zillow Group:
Zillow Group, Inc. (Nasdaq: Z and ZG) is reimagining real estate to make home a reality for more and more people.
As the most visited real estate app and website in
Zillow's ecosystem spans the entire home journey — from dreaming and shopping to renting, buying, selling and financing.
Zillow Group's affiliates, subsidiaries and brands include Zillow®, Zillow Premier Agent®, Zillow Home Loans®, Zillow Rentals®, Zillow® New Construction, Trulia®, StreetEasy®, Out East®, HotPads®, Follow Up Boss®, ShowingTime®, dotloop® and Zillow® Closing.
All marks herein are owned by MFTB Holdco, Inc., a Zillow affiliate. Zillow Home Loans, LLC is an Equal Housing Lender, NMLS #10287 (www.nmlsconsumeraccess.org). © 2026 MFTB Holdco, Inc., a Zillow affiliate.
(ZFIN)

 View original content to download multimedia:https://www.prnewswire.com/news-releases/meet-the-dual-shopper-nearly-1-in-13-for-sale-shoppers-also-engage-with-rentals-302741346.html
SOURCE Zillow