[10-Q] Commault Systems, Inc. Quarterly Earnings Report
Filing Impact
Filing Sentiment
Form Type
10-Q
UNITED STATES
SECURITIES AND EXCHANGE COMMISSION
Washington, D.C. 20549
FORM 10-Q
For the quarterly period ended: June 30, 2025
Commission File Number: 1-33026
(Exact name of registrant as specified in its charter)
| (State or other jurisdiction of incorporation or organization) | (I.R.S. Employer Identification No.) | |||||||
(Address of principal executive offices, including zip code)
(732 ) 870-4000
(Registrant’s telephone number, including area code)
Securities registered pursuant to Section 12(b) of the Act:
| Title of each class | Trading Symbol(s) | Name of each exchange on which registered | ||||||
Indicate by check mark whether the registrant (1) has filed all reports required to be filed by Section 13 or 15(d) of the Securities Exchange Act of 1934 during the preceding 12 months (or for such shorter period that the registrant was required to file such reports), and (2) has been subject to such filing requirements for the past 90 days. Yes x No ¨
Indicate by check mark whether the registrant has submitted electronically every Interactive Data File required to be submitted pursuant to Rule 405 of Regulation S-T (§232.405 of this chapter) during the preceding 12 months (or for such shorter period that the registrant was required to submit such files). Yes x No ¨
Indicate by check mark whether the registrant is a large accelerated filer, an accelerated filer, a non-accelerated filer, a smaller reporting company, or an emerging growth company. See the definitions of "large accelerated filer", "accelerated filer", "smaller reporting company", and "emerging growth company" in Rule 12b-2 of the Exchange Act.
| x | Accelerated filer | ☐ | Non-accelerated filer | ☐ | Smaller reporting company | ||||||||||||||||||
| Emerging growth company | |||||||||||||||||||||||
| If an emerging growth company, indicate by check mark if the registrant has elected not to use the extended transition period for complying with any new or revised financial accounting standards provided pursuant to Section 13(a) of the Exchange Act. | ☐ | ||||||||||||||||||||||
Indicate by check mark whether the registrant is a shell company (as defined in Rule 12b-2 of the Exchange Act). Yes ☐ No x
As of July 28, 2025, there were 44,459,659 shares of the registrant’s common stock, $0.01 par value, outstanding.
1
COMMVAULT SYSTEMS, INC.
FORM 10-Q
INDEX
| Page | ||||||||
| Part I – FINANCIAL INFORMATION | ||||||||
| Item 1. | Financial Statements | |||||||
Unaudited Consolidated Balance Sheets as of June 30, 2025 and March 31, 2025 | 1 | |||||||
Unaudited Consolidated Statements of Operations for the three months ended June 30, 2025 and 2024 | 2 | |||||||
Unaudited Consolidated Statements of Comprehensive Income for the three months ended June 30, 2025 and 2024 | 3 | |||||||
Unaudited Consolidated Statements of Stockholders’ Equity for the three months ended June 30, 2025 and 2024 | 4 | |||||||
Unaudited Consolidated Statements of Cash Flows for the three months ended June 30, 2025 and 2024 | 5 | |||||||
Notes to Consolidated Financial Statements (unaudited) | 6 | |||||||
| Item 2. | Management’s Discussion and Analysis of Financial Condition and Results of Operations | 19 | ||||||
| Item 3. | Quantitative and Qualitative Disclosures about Market Risk | 27 | ||||||
| Item 4. | Controls and Procedures | 28 | ||||||
Part II – OTHER INFORMATION | ||||||||
| Item 1. | Legal Proceedings | 29 | ||||||
| Item 1A. | Risk Factors | 29 | ||||||
| Item 2. | Unregistered Sales of Equity Securities and Use of Proceeds | 29 | ||||||
| Item 3. | Defaults Upon Senior Securities | 29 | ||||||
| Item 4. | Mine Safety Disclosures | 29 | ||||||
| Item 5. | Other Information | 30 | ||||||
| Item 6. | Exhibits | 30 | ||||||
SIGNATURES | 31 | |||||||
2
Table of Contents
Commvault Systems, Inc.
Consolidated Balance Sheets
(In thousands, except per share data)
(Unaudited)
| June 30, 2025 | March 31, 2025 | |||||||||||||
| ASSETS | ||||||||||||||
| Current assets: | ||||||||||||||
| Cash and cash equivalents | $ | $ | ||||||||||||
| Trade accounts receivable, net | ||||||||||||||
| Assets held for sale | ||||||||||||||
| Other current assets | ||||||||||||||
| Total current assets | ||||||||||||||
| Deferred tax assets, net | ||||||||||||||
| Property and equipment, net | ||||||||||||||
| Operating lease assets | ||||||||||||||
| Deferred commissions cost | ||||||||||||||
| Intangible assets, net | ||||||||||||||
| Goodwill | ||||||||||||||
| Other assets | ||||||||||||||
| Total assets | $ | $ | ||||||||||||
| LIABILITIES AND STOCKHOLDERS’ EQUITY | ||||||||||||||
| Current liabilities: | ||||||||||||||
| Accounts payable | $ | $ | ||||||||||||
| Accrued liabilities | ||||||||||||||
| Current portion of operating lease liabilities | ||||||||||||||
| Deferred revenue | ||||||||||||||
| Total current liabilities | ||||||||||||||
| Deferred revenue, less current portion | ||||||||||||||
| Deferred tax liabilities | ||||||||||||||
| Long-term operating lease liabilities | ||||||||||||||
| Other liabilities | ||||||||||||||
| Commitments and contingencies (Note 6) | ||||||||||||||
| Stockholders’ equity: | ||||||||||||||
Preferred stock, $ | ||||||||||||||
Common stock, $ | ||||||||||||||
| Additional paid-in capital | ||||||||||||||
| Accumulated deficit | ( | ( | ||||||||||||
| Accumulated other comprehensive loss | ( | ( | ||||||||||||
| Total stockholders’ equity | ||||||||||||||
| Total liabilities and stockholders’ equity | $ | $ | ||||||||||||
See accompanying unaudited notes to consolidated financial statements
1
Table of Contents
Commvault Systems, Inc.
Consolidated Statements of Operations
(In thousands, except per share data)
(Unaudited)
| Three Months Ended June 30, | ||||||||||||||
| 2025 | 2024 | |||||||||||||
| Revenues: | ||||||||||||||
| Subscription: | ||||||||||||||
| Term-based license | $ | $ | ||||||||||||
| Software-as-a-service | ||||||||||||||
| Total subscription | ||||||||||||||
| Perpetual license | ||||||||||||||
| Customer support | ||||||||||||||
| Other services | ||||||||||||||
| Total revenues | ||||||||||||||
| Cost of revenues: | ||||||||||||||
| Subscription: | ||||||||||||||
| Term-based license | ||||||||||||||
| Software-as-a-service | ||||||||||||||
| Total subscription | ||||||||||||||
| Perpetual license | ||||||||||||||
| Customer support | ||||||||||||||
| Other services | ||||||||||||||
| Total cost of revenues | ||||||||||||||
| Gross margin | ||||||||||||||
| Operating expenses: | ||||||||||||||
| Sales and marketing | ||||||||||||||
| Research and development | ||||||||||||||
| General and administrative | ||||||||||||||
| Depreciation and amortization | ||||||||||||||
| Restructuring | ||||||||||||||
| Change in contingent consideration | ( | |||||||||||||
| Total operating expenses | ||||||||||||||
| Income from operations | ||||||||||||||
| Interest income | ||||||||||||||
| Interest expense | ( | ( | ||||||||||||
| Other income, net | ||||||||||||||
| Income before income taxes | ||||||||||||||
| Income tax expense | ||||||||||||||
| Net income | $ | $ | ||||||||||||
| Net income per common share: | ||||||||||||||
| Basic | $ | $ | ||||||||||||
| Diluted | $ | $ | ||||||||||||
| Weighted average common shares outstanding: | ||||||||||||||
| Basic | ||||||||||||||
| Diluted | ||||||||||||||
See accompanying unaudited notes to consolidated financial statements
2
Table of Contents
Commvault Systems, Inc.
Consolidated Statements of Comprehensive Income
(In thousands)
(Unaudited)
| Three Months Ended June 30, | ||||||||||||||
| 2025 | 2024 | |||||||||||||
| Net income | $ | $ | ||||||||||||
| Other comprehensive income (loss): | ||||||||||||||
| Foreign currency translation adjustment, net of tax | ( | |||||||||||||
| Comprehensive income | $ | $ | ||||||||||||
See accompanying unaudited notes to consolidated financial statements
3
Table of Contents
Commvault Systems, Inc.
Consolidated Statements of Stockholders’ Equity
(In thousands)
(Unaudited)
| Common Stock | Additional Paid – In Capital | Accumulated Deficit | Accumulated Other Comprehensive Loss | Total | ||||||||||||||||||||||||||||||||||
| Shares | Amount | |||||||||||||||||||||||||||||||||||||
| Balance as of March 31, 2025 | $ | $ | $ | ( | $ | ( | $ | |||||||||||||||||||||||||||||||
| Stock-based compensation | ||||||||||||||||||||||||||||||||||||||
| Share issuances related to stock-based compensation | ||||||||||||||||||||||||||||||||||||||
| Repurchase of common stock | ( | ( | ( | ( | ( | |||||||||||||||||||||||||||||||||
| Net income | ||||||||||||||||||||||||||||||||||||||
| Other comprehensive income | ||||||||||||||||||||||||||||||||||||||
| Balance as of June 30, 2025 | $ | $ | $ | ( | $ | ( | $ | |||||||||||||||||||||||||||||||
| Common Stock | Additional Paid – In Capital | Accumulated Deficit | Accumulated Other Comprehensive Loss | Total | ||||||||||||||||||||||||||||||||||
| Shares | Amount | |||||||||||||||||||||||||||||||||||||
| Balance as of March 31, 2024 | $ | $ | $ | ( | $ | ( | $ | |||||||||||||||||||||||||||||||
| Stock-based compensation | ||||||||||||||||||||||||||||||||||||||
| Share issuances related to business combination | ||||||||||||||||||||||||||||||||||||||
| Share issuances related to stock-based compensation | ||||||||||||||||||||||||||||||||||||||
| Repurchase of common stock | ( | ( | ( | ( | ( | |||||||||||||||||||||||||||||||||
| Net income | ||||||||||||||||||||||||||||||||||||||
| Other comprehensive loss | ( | ( | ||||||||||||||||||||||||||||||||||||
| Balance as of June 30, 2024 | $ | $ | $ | ( | $ | ( | $ | |||||||||||||||||||||||||||||||
See accompanying unaudited notes to consolidated financial statements
4
Table of Contents
Commvault Systems, Inc.
Consolidated Statements of Cash Flows
(In thousands)
(Unaudited)
| Three Months Ended June 30, | ||||||||||||||
| 2025 | 2024 | |||||||||||||
| Cash flows from operating activities | ||||||||||||||
| Net income | $ | $ | ||||||||||||
| Adjustments to reconcile net income to net cash provided by operating activities: | ||||||||||||||
| Depreciation and amortization | ||||||||||||||
| Noncash stock-based compensation | ||||||||||||||
| Noncash change in fair value of equity securities | ( | ( | ||||||||||||
| Noncash adjustment on headquarters sale leaseback | ||||||||||||||
| Noncash change in fair value of contingent consideration | ( | |||||||||||||
| Noncash operating lease expense | ||||||||||||||
| Deferred income taxes | ( | |||||||||||||
| Amortization of deferred commissions cost | ||||||||||||||
| Changes in operating assets and liabilities: | ||||||||||||||
| Trade accounts receivable, net | ||||||||||||||
| Operating lease liabilities | ( | ( | ||||||||||||
| Other current assets and Other assets | ( | |||||||||||||
| Deferred commissions cost | ( | ( | ||||||||||||
| Accounts payable | ( | |||||||||||||
| Accrued liabilities | ( | ( | ||||||||||||
| Deferred revenue | ||||||||||||||
| Other liabilities | ( | |||||||||||||
| Net cash provided by operating activities | ||||||||||||||
| Cash flows from investing activities | ||||||||||||||
| Purchase of property and equipment | ( | ( | ||||||||||||
| Purchase of equity securities | ( | ( | ||||||||||||
| Proceeds from sale of headquarters, net | ||||||||||||||
| Business combination, net of cash acquired | ( | |||||||||||||
| Net cash provided by (used in) investing activities | ( | |||||||||||||
| Cash flows from financing activities | ||||||||||||||
| Repurchase of common stock | ( | ( | ||||||||||||
| Proceeds from stock-based compensation plans | ||||||||||||||
| Payment of debt issuance costs | ( | |||||||||||||
| Payment of financial liability | ( | |||||||||||||
| Net cash used in financing activities | ( | ( | ||||||||||||
| Effects of exchange rate — changes in cash | ( | |||||||||||||
| Net increase (decrease) in cash and cash equivalents | ( | |||||||||||||
| Cash and cash equivalents at beginning of period | ||||||||||||||
| Cash and cash equivalents at end of period | $ | $ | ||||||||||||
| Supplemental disclosures of noncash activities | ||||||||||||||
| Issuance of common stock for business combination | $ | $ | ||||||||||||
| Operating lease liabilities arising from obtaining right-of-use assets | $ | $ | ||||||||||||
See accompanying unaudited notes to consolidated financial statements
5
Table of Contents
Commvault Systems, Inc.
Notes to Consolidated Financial Statements - Unaudited
(In thousands, except per share data)
1. Basis of Presentation
Commvault Systems, Inc. and its subsidiaries ("Commvault," "we," "us," "our," or the "Company") aims to provide its customers cyber resiliency by protecting and recovering their data and cloud-native applications in a world of increasing cyber threats and attacks, including ransomware. We provide products and services across many types of environments, including on-premises, hybrid and multi-cloud. Our offerings are delivered via self-managed software, software-as-a-service ("SaaS"), integrated appliances, or managed by partners. Customers use our Commvault Cloud platform to help protect themselves from threats like ransomware and recover their data efficiently.
The consolidated financial statements of Commvault as of June 30, 2025 and for the three months ended June 30, 2025 and 2024 are unaudited, and in the opinion of management, include all adjustments (consisting only of normal recurring adjustments) necessary for a fair presentation of the results for the interim periods. Accordingly, they do not include all the information and footnotes required by U.S. generally accepted accounting principles (“U.S. GAAP”) for complete financial statements and should be read in conjunction with the financial statements and notes in our Annual Report on Form 10-K for the fiscal year ended March 31, 2025. The results reported in these financial statements should not necessarily be taken as indicative of results that may be expected for the entire fiscal year.
The preparation of financial statements and related disclosures in conformity with U.S. GAAP requires management to make judgments and estimates that affect the amounts reported in our consolidated financial statements and the accompanying notes. We base our estimates and judgments on historical experience and on various other assumptions that we believe are reasonable under the circumstances. The amounts of assets and liabilities reported in our balance sheets and the amounts of revenues and expenses reported for each of the periods presented are affected by estimates and assumptions, which are used for, but not limited to, the accounting for revenue recognition, income taxes and related reserves, deferred commissions, goodwill, and purchased intangible assets. Actual results could differ from those estimates.
6
Table of Contents
Commvault Systems, Inc.
Notes to Consolidated Financial Statements - Unaudited (continued)
(In thousands, except per share data)
2. Summary of Significant Accounting Policies
Reclassification of Prior Year Balances
Certain prior year amounts have been reclassified for consistency with the current year presentation. Beginning in fiscal 2026, the subscription revenues and cost of revenues line items on the consolidated statements of operations have been further disaggregated to disclose the software portion of term-based licenses and SaaS. These reclassifications have no impact on the amount of total revenues or net income.
Recently Adopted and Recently Issued Accounting Standards
There were no recently adopted accounting standards that had a material effect on our condensed consolidated financial statements and accompanying disclosures. The table below outlines recently issued accounting standards not yet adopted.
| Standard | Description | Effective Date | Effect on the Consolidated Financial Statements (or Other Significant Matters) | ||||||||
| Accounting Standards Update ("ASU") No. 2023-09 (Topic 740): Income Taxes | In December 2023, the Financial Accounting Standards Board ("FASB") issued a new standard to improve income tax disclosures. The standard requires greater disaggregated information about a reporting entity’s effective tax rate reconciliation as well as information on income taxes paid. | This standard will be effective for us for our annual period beginning April 1, 2025. | This standard will result in additional annual tax disclosures and is not expected to have a significant impact on our results of operations, cash flows, or financial condition. | ||||||||
| ASU No. 2024-03 (Subtopic 220-40): Disaggregation of Income Statement Expenses | In November 2024, the FASB issued a new standard to improve income statement expense disclosures. The standard requires greater disaggregated information on certain expense captions, as well as disclosures about selling expenses. | This standard will be effective for us for our annual period beginning April 1, 2027 and interim periods beginning April 1, 2028, with early adoption permitted. | We are currently evaluating the impact of this standard on our consolidated financial statements and disclosures. | ||||||||
We grant credit to customers in a wide variety of industries worldwide and generally do not require collateral. Credit losses relating to these customers have historically been minimal.
We rely significantly on our value-added resellers, systems integrators and corporate resellers, which we collectively refer to as resellers, for the marketing and distribution of our products and services. Further, we have non-exclusive distribution agreements with certain partners who enable a more efficient and effective distribution channel for our solutions by managing our resellers and leveraging their own industry experience.
For the three months ended June 30, 2025 and 2024, Partner A accounted for approximately 33 % and 34 % of our total revenues, respectively. In addition, Partner A represented approximately 26 % and 29 % of our total accounts receivable as of June 30, 2025 and March 31, 2025, respectively. Separately, Partner B accounted for approximately 11 % of our total revenues for the three months ended June 30, 2025 and 12 % of our total accounts receivable as of June 30, 2025. Total revenues for the three months ended June 30, 2024 and total accounts receivable as of March 31, 2025 for Partner B were not material.
7
Table of Contents
Commvault Systems, Inc.
Notes to Consolidated Financial Statements - Unaudited (continued)
(In thousands, except per share data)
Fair value is defined as the exchange price that would be received for an asset or paid to transfer a liability (an exit price) in the principal or most advantageous market for such asset or liability in an orderly transaction between market participants on the measurement date. Valuation techniques used to measure fair value should maximize the use of observable inputs and minimize the use of unobservable inputs. To measure fair value, we use the following fair value hierarchy based on three levels of inputs, of which the first two are considered observable and the last unobservable:
Level 1 — Observable inputs such as quoted prices in active markets for identical assets or liabilities;
Level 2 — Inputs other than Level 1, that are observable for the asset or liability, either directly or indirectly; and
Level 3 — Unobservable inputs that are supported by little or no market activity and that require the reporting entity to develop its own assumptions.
The carrying amounts of our cash, cash equivalents, accounts receivable and accounts payable approximate their fair values due to the short-term maturity of these instruments. Equity securities within Level 3 include an investment in a privately held company which was valued using the measurement alternative as permitted under Accounting Standards Codification ("ASC") 321, Investments - Equity Securities. This investment is included in other assets in the accompanying consolidated balance sheets.
The following table summarizes the composition of our financial assets and liabilities measured at fair value as of June 30, 2025 and March 31, 2025:
| June 30, 2025 | Level 1 | Level 2 | Level 3 | Total | |||||||||||||||||||
| Assets: | |||||||||||||||||||||||
| Equity securities | $ | $ | $ | $ | |||||||||||||||||||
| March 31, 2025 | Level 1 | Level 2 | Level 3 | Total | |||||||||||||||||||
| Liabilities: | |||||||||||||||||||||||
| Contingent consideration | $ | $ | $ | $ | |||||||||||||||||||
Based on the actual achievement of certain financial metrics as of June 30, 2025, the contingent consideration arrangement related to the acquisition of Appranix, Inc. resulted in final aggregate consideration of $1,855 , of which $1,527 has already been paid and $328 was recorded in accrued liabilities on the consolidated balance sheets as of June 30, 2025. The liability, with a fair value of $873 as of March 31, 2025 and classified as a Level 3 investment, was adjusted accordingly, resulting in a $545 reduction in operating expenses on our consolidated statements of operations during the first quarter of fiscal 2026. As the liability is no longer subject to fair value remeasurement, it has been excluded from the table above as of June 30, 2025.
Equity Securities Accounted for at Net Asset Value
8
Table of Contents
Commvault Systems, Inc.
Notes to Consolidated Financial Statements - Unaudited (continued)
(In thousands, except per share data)
Goodwill and Intangible Assets
Goodwill is recorded when the consideration paid for an acquisition exceeds the fair value of net tangible and intangible assets acquired. The carrying value of goodwill is tested for impairment on an annual basis on January 1, or more often if an event occurs or circumstances change that would more likely than not reduce the fair value of its carrying amount. For the purpose of impairment testing, we have a single reporting unit. We have elected to first assess the qualitative factors to determine whether it is more likely than not that the fair value of our single reporting unit is less than its carrying amount as a basis for determining whether it is necessary to perform the quantitative goodwill impairment test. If the qualitative assessment indicates that it is more likely than not that the fair value is less than the carrying amount, a quantitative goodwill impairment test is performed. If the fair value exceeds the carrying amount, no further analysis is required; otherwise, an impairment loss is recognized for the amount by which the carrying value of goodwill exceeds its fair value.
Our finite-lived purchased intangible assets consist of developed technology and customer relationships. Developed technology was valued using the multi-period excess earnings method and is being amortized on a straight-line basis over its economic life of five years . Customer relationships were valued using the distributor method and are being amortized on a straight-line basis over their economic life of ten years . We believe these methods most closely reflect the pattern in which the economic benefits of the assets will be consumed. Impairment losses are recognized if the carrying amount of an intangible asset is both not recoverable and exceeds its fair value.
Deferred Commissions Cost
Sales commissions, bonuses, and related payroll taxes earned by our employees are considered incremental and recoverable costs of obtaining a contract with a customer. Our typical contracts include performance obligations related to term-based software licenses, SaaS offerings, perpetual software licenses, software updates, and customer support. In these contracts, incremental costs of obtaining a contract are allocated to the performance obligations based on the relative estimated standalone selling prices and then recognized on a systematic basis that is consistent with the transfer of the goods or services to which the asset relates. We do not pay commissions on annual renewals of customer support contracts for perpetual licenses. The costs allocated to software and products are expensed at the time of sale, when revenue for the functional software license is recognized. The costs allocated to software updates and customer support for perpetual licenses are amortized ratably over a period of approximately five years , the expected period of benefit of the asset capitalized. We currently estimate a period of five years is appropriate based on consideration of historical average customer life and the estimated useful life of the underlying software sold as part of the transaction. The commission paid on the renewal of subscription arrangements is not commensurate with the commission paid on the initial purchase. As a result, the cost of commissions allocated to SaaS offerings, software updates and customer support on the initial term-based software license transactions are amortized over a period of approximately five years , consistent with the accounting for these costs associated with perpetual licenses. The costs of commissions allocated to SaaS offerings, software updates and customer support for the renewal of term-based software licenses is limited to the contractual period of the arrangement, as we pay a commensurate renewal commission upon the next renewal of the subscription software license and related updates and support.
The incremental costs attributable to professional services are generally amortized over the period the related services are provided and revenue is recognized. Amortization expense related to these costs is included in sales and marketing expenses in the accompanying consolidated statements of operations.
9
Table of Contents
Commvault Systems, Inc.
Notes to Consolidated Financial Statements - Unaudited (continued)
(In thousands, except per share data)
3. Revenue
We generate revenues through subscription arrangements, which includes both term-based software licenses and SaaS, perpetual software licenses, customer support contracts and other services.
Term-based License
Term-based license revenue typically includes revenue from the license portion of time-based subscription arrangements which are deployed on-premises. The revenue from these licenses is typically recognized when the software is delivered or made available for download.
Software-as-a-service ("SaaS")
SaaS revenue typically includes revenue from time-based subscription arrangements which are delivered via hosted cloud solutions. SaaS revenue is recognized ratably over the contract term, typically to three years , beginning on the date that the service is made available to the customer.
Perpetual License
Perpetual license includes the revenues from the sale of perpetual software licenses. Perpetual software license revenue is typically recognized when the software is delivered or made available for download.
Customer Support
Customer support includes revenues associated with support contracts tied to our software products. Customer support includes software updates on a when-and-if-available basis, telephone support, integrated web-based support, and other premium support offerings, for both term-based software license and perpetual software license arrangements. We sell our customer support contracts as a percentage of net software purchases. Customer support revenue is recognized ratably over the term of the customer support agreement, which is typically one year on our perpetual licenses and over the term on our term-based licenses, which typically range from to three years .
Other Services
Other services consist primarily of revenues related to professional service offerings, including consultation, assessment and design, installation services, and customer education. Revenues related to other services can vary period over period based on the timing services are delivered and are typically recognized as the services are performed.
We do not customize our software licenses (both term-based and perpetual) and installation services are not required. Software licenses are delivered before related services are provided and are functional without professional services, updates, or technical support. We have concluded that our software licenses (both term-based and perpetual) are functional intellectual property that is distinct, as the user can benefit from the software on its own. Revenues for both term-based and perpetual licenses are typically recognized when the software is delivered and/or made available for download as this is the point the user of the software can direct the use of and obtain substantially all the remaining benefits from the functional intellectual property. We do not recognize software revenue related to the renewal of term-based software licenses earlier than the beginning of the new subscription period.
We also offer software that integrates with appliances and address a wide range of business needs and use cases, ranging from support for remote or branch offices with limited IT staff up to large corporate data centers. These appliances are almost exclusively sold via a software only model in which we sell software to a third party, which assembles an integrated appliance that is sold to end user customers. As a result, the revenues and costs associated with hardware are usually not included in our financial statements.
10
Table of Contents
Commvault Systems, Inc.
Notes to Consolidated Financial Statements - Unaudited (continued)
(In thousands, except per share data)
Our typical performance obligations include the following:
| Performance Obligation | When Performance Obligation is Typically Satisfied | When Payment is Typically Due | How Standalone Selling Price is Typically Estimated | ||||||||
| Subscription | |||||||||||
| Term-based software licenses | Upon shipment or made available for download (point in time) | Within | Residual approach | ||||||||
| Software-as-a-service (SaaS) | Ratably over the course of the contract (over time) | Annually or at the beginning of the contract period | Observable in transactions without multiple performance obligations | ||||||||
| Perpetual License | |||||||||||
| Perpetual software licenses | Upon shipment or made available for download (point in time) | Within | Residual approach | ||||||||
| Customer Support | |||||||||||
| Software updates | Ratably over the course of the support contract (over time) | At the beginning of the contract period | Observable in renewal transactions | ||||||||
| Customer support | Ratably over the course of the support contract (over time) | At the beginning of the contract period | Observable in renewal transactions | ||||||||
| Other Services | |||||||||||
| Other professional services | As work is performed (over time) | Within | Observable in transactions without multiple performance obligations | ||||||||
Judgments related to revenue recognition
Most of our contracts with customers contain multiple performance obligations. For these contracts, we evaluate and account for individual performance obligations separately if they are determined to be distinct. The transaction price is allocated to the separate performance obligations on a relative standalone selling price basis. Standalone selling prices of software licenses (both term-based and perpetual) are typically estimated using the residual approach. Standalone selling prices for SaaS, customer support contracts, and other services are typically estimated based on observable transactions when these services are sold on a standalone basis. We recognize revenue net of sales tax.
Disaggregation of Revenues
We disaggregate revenues from contracts with customers into geographical regions. Our Americas region includes the United States, Canada, and Latin America. Our International region primarily includes Europe, Middle East, Africa, Australia, India, Southeast Asia, and China.
| Three Months Ended June 30, | |||||||||||
| 2025 | 2024 | ||||||||||
| Americas | $ | $ | |||||||||
| International | |||||||||||
| Total revenues | $ | $ | |||||||||
11
Table of Contents
Commvault Systems, Inc.
Notes to Consolidated Financial Statements - Unaudited (continued)
(In thousands, except per share data)
Remaining Performance Obligations
Remaining performance obligations represent expected future revenue from existing contracts where performance obligations are unsatisfied or partially unsatisfied at the end of the reporting period. Remaining performance obligations include unfulfilled contracts at the end of a given period and can include subscription arrangements (term-based licenses and SaaS), customer support and other services. As of June 30, 2025, our remaining performance obligations (inclusive of deferred revenue) were $835,430 , of which approximately 62 % is expected to be recognized as revenue over the next 12 months and the remainder recognized thereafter.
Remaining performance obligations, excluding deferred revenue, related to subscription arrangements, customer support revenue and other services were $86,789 , $57,424 , and $25,782 , respectively. Of these balances, we expect approximately 57 % of subscription arrangements, 32 % of customer support and 100 % of other services to be recognized as revenue over the next 12 30 % of subscription arrangements and 8 % of customer support remaining performance obligations to be recognized as revenue in the second quarter of fiscal 2026. These balances represent transactions consisting primarily of early renewals, unbilled and undelivered support and other services, and orders received prior to the last day of the quarter that were not delivered or provisioned to customers.
Remaining performance obligations will fluctuate period to period. We do not believe the amount of remaining performance obligations is indicative of future sales or revenue or that the mix at the end of any given period correlates with actual sales performance.
Information about Contract Balances
Amounts collected in advance of services being provided are accounted for as deferred revenue. Nearly all of our deferred revenue balance is related to SaaS, customer support, and other services.
In some arrangements we allow customers to pay for term-based licenses over the term of the software license. When a term-based license arrangement contains payment terms that extend beyond one year, a significant financing component may exist. The significant financing component is calculated as the difference between the stated value and present value of the license and is recognized as interest income over the extended payment period. The total license fee net of the significant financing component is recognized as revenue at the point in time when the software is transferred to the customer. Interest income from significant financing components was not material for the three months ended June 30, 2025 and 2024.
| Accounts receivable | Unbilled receivable (current) | Unbilled receivable (long-term) | Deferred revenue (current) | Deferred revenue (long-term) | |||||||||||||
Opening balance as of March 31, 2025 | $ | $ | $ | $ | $ | ||||||||||||
| Increase/(decrease) | ( | ( | |||||||||||||||
Ending balance as of June 30, 2025 | $ | $ | $ | $ | $ | ||||||||||||
The net increase in accounts receivable (inclusive of unbilled receivables) is primarily the result of an increase in revenue relative to the fourth quarter of the prior fiscal year. The increase in deferred revenue is primarily the result of an increase in deferred customer support renewals during the first quarter of fiscal 2026 as well as an increase in SaaS contracts which are billed upfront but recognized ratably over the contract period.
12
Table of Contents
Commvault Systems, Inc.
Notes to Consolidated Financial Statements - Unaudited (continued)
(In thousands, except per share data)
The amount of revenue recognized in the period that was included in the opening deferred revenue balance was $144,785 for the three months ended June 30, 2025. The majority of this revenue consists of SaaS and customer support. The amount of revenue recognized from performance obligations satisfied in prior periods was not significant.
4. Sale and Leaseback Transaction
On April 28, 2025, we completed the sale of our owned corporate headquarters located in Tinton Falls, New Jersey for cash consideration of $36,000 , excluding transaction costs, pursuant to a purchase and sale agreement signed on October 2, 2024. Concurrent with the sale, we entered into a leaseback arrangement for a portion of the premises over a term of ten years , expiring April 30, 2035. The transaction met the criteria for a sale under ASC 842, Leases and ASC 606, Revenue from Contracts with Customers and the leaseback was determined to be an operating lease.
In connection with the transaction, the Company determined that the leaseback terms were above market. Accordingly, a financial liability of $1,300 19,563 , based on the present value of fixed lease payments over the lease term. The discount rate used to calculate the lease liability was 6.35 %.
5. Net Income per Common Share
Basic net income per common share is computed by dividing net income by the weighted average number of common shares outstanding during the period. Diluted net income per share is computed using the weighted average number of common shares outstanding and, if dilutive, potential common shares outstanding during the period. Potential common shares consist of the incremental common shares issuable upon the vesting of restricted stock units ("RSUs"), performance stock units ("PSUs"), common shares to be purchased under the Employee Stock Purchase Plan ("ESPP"), and the exercise of stock options. The dilutive effect of such potential common shares is reflected in diluted earnings per share by application of the treasury stock method.
The following table sets forth the reconciliation of basic and diluted net income per common share:
| Three Months Ended June 30, | |||||||||||
| 2025 | 2024 | ||||||||||
| Net income | $ | $ | |||||||||
| Basic net income per common share: | |||||||||||
| Basic weighted average shares outstanding | |||||||||||
| Basic net income per common share | $ | $ | |||||||||
| Diluted net income per common share: | |||||||||||
| Basic weighted average shares outstanding | |||||||||||
| Dilutive effect of restricted stock units | |||||||||||
| Diluted weighted average shares outstanding | |||||||||||
| Diluted net income per common share | $ | $ | |||||||||
The diluted weighted average shares outstanding excludes RSUs, PSUs, common shares to be purchased under the ESPP and outstanding stock options totaling 157 and 175 for the three months ended June 30, 2025 and 2024, respectively, because the effect of including them would have been anti-dilutive.
13
Table of Contents
Commvault Systems, Inc.
Notes to Consolidated Financial Statements - Unaudited (continued)
(In thousands, except per share data)
6. Commitments and Contingencies
We do not believe that we are currently party to any pending legal action that could reasonably be expected to have a material adverse effect on our business or operating results.
7. Capitalization
On April 17, 2025, our board of directors (the "Board") approved an increase of the existing share repurchase program so that $250,000 was available. The Board's authorization has no expiration date. For the three months ended June 30, 2025, we repurchased $15,050 of our common stock, or approximately 82 shares. The remaining amount available under the current authorization as of June 30, 2025 was $234,950 . Our stock repurchase program has been funded by our existing cash and cash equivalent balances, as well as cash flows provided by our operations.
8. Stock Plans
The following table presents the stock-based compensation expense included in cost of revenues, sales and marketing, research and development, general and administrative and restructuring expenses for the three months ended June 30, 2025 and 2024. Stock-based compensation is attributable to RSUs, PSUs and the ESPP.
| Three Months Ended June 30, | |||||||||||
| 2025 | 2024 | ||||||||||
| Cost of revenues | $ | $ | |||||||||
| Sales and marketing | |||||||||||
| Research and development | |||||||||||
| General and administrative | |||||||||||
| Restructuring | |||||||||||
| Stock-based compensation expense | $ | $ | |||||||||
As of June 30, 2025, there was $179,013 of unrecognized stock-based compensation expense that is expected to be recognized over a weighted average period of 1.67 years. We account for forfeitures as they occur. To the extent that awards are forfeited, stock-based compensation will be different from our current estimate.
Restricted Stock Units
Restricted stock unit activity for the three months ended June 30, 2025 was as follows:
| Non-vested Restricted Stock Units | Number of Awards | Weighted Average Grant Date Fair Value | |||||||||
| Non-vested as of March 31, 2025 | $ | ||||||||||
| Awarded | |||||||||||
| Vested | ( | ||||||||||
| Forfeited | ( | ||||||||||
Non-vested as of June 30, 2025 | $ | ||||||||||
14
Table of Contents
Commvault Systems, Inc.
Notes to Consolidated Financial Statements - Unaudited (continued)
(In thousands, except per share data)
The weighted average fair value of RSUs awarded was $185.21 and $115.60 per unit during the three months ended June 30, 2025 and 2024, respectively. The weighted average fair value of awards includes the awards with a market condition described below.
Performance Based Awards
In the three months ended June 30, 2025, we granted approximately 77 PSUs to certain executives. Vesting of these awards is contingent upon i) us meeting certain non-GAAP performance goals (performance-based) in fiscal 2026 and ii) our customary service periods. The awards vest over three years and have the potential to vest between 0 % and 300 % (231 shares) based on actual fiscal 2026 performance. The vesting quantity of these awards may vary based on actual fiscal 2026 performance. The related stock-based compensation expense is determined based on the value of the underlying shares on the date of grant and is recognized over the vesting term using the accelerated method. During the interim financial periods, management estimates the probable number of PSUs that would vest until the ultimate achievement of the performance goals is known. The awards are included in the restricted stock units table.
Awards with a Market Condition
In the three months ended June 30, 2025, we granted approximately 77 market PSUs to certain executives. The vesting of these awards is contingent upon us meeting certain total shareholder return ("TSR") levels as compared to the Russell 3000 market index over the succeeding three years from grant date. The awards vest in three annual tranches and have the potential to vest between 0 % and 300 % (231 shares) based on TSR performance. The related stock-based compensation expense is determined based on the estimated fair value of the underlying shares on the date of grant and is recognized using the accelerated method over the vesting term. The estimated fair value was calculated using a Monte Carlo simulation model. The fair value of the awards granted during the three months ended June 30, 2025 was $288.47 per unit. The awards are included in the restricted stock units table.
9. Income Taxes
Income tax expense was $3,387 in the three months ended June 30, 2025, compared to income tax expense of $2,127 in the three months ended June 30, 2024. The increase in income tax expense compared to the prior year period relates primarily to estimated current federal taxes. We continue to monitor the impact of new global and U.S. legislation on our effective tax rate.
15
Table of Contents
Commvault Systems, Inc.
Notes to Consolidated Financial Statements - Unaudited (continued)
(In thousands, except per share data)
10. Segment Information
We operate as a single reportable segment as we report financial information, including net income determined in accordance with U.S. GAAP, among other measures, on a consolidated basis to our Chief Executive Officer, who serves as the Chief Operating Decision Maker (“CODM”). The CODM uses consolidated net income to make operating decisions, allocate resources, and evaluate financial performance, primarily by monitoring actual results compared to forecasted results, as well as by reviewing year-over-year results and trending historical performance. The CODM also uses net income in competitive analysis by benchmarking to the Company’s competitors. The competitive analysis along with the monitoring of actual versus forecasted results are used in assessing the performance of the segment.
The CODM reviews significant segment expenses for our single reportable segment. Significant segment expenses include cost of revenues, sales and marketing expenses, research and development expenses, general and administrative expenses, depreciation and amortization, restructuring, and other operating expenses, all of which are presented in our consolidated statements of operations. Other segment items include interest income, interest expense, other income, net, and income tax expense, which are also presented in our consolidated statements of operations.
Revenues by geography are based upon the billing address of the customer. All transfers between geographic regions have been eliminated from consolidated revenues. The following table sets forth revenue by geographic area:
| Three Months Ended June 30, | |||||||||||
| 2025 | 2024 | ||||||||||
| United States | $ | $ | |||||||||
| Other | |||||||||||
| Total revenues | $ | $ | |||||||||
No individual country other than the United States accounted for 10% or more of revenues for the three months ended June 30, 2025 and 2024. Revenue included in the “Other” caption above primarily relates to our operations in Europe, Australia, Canada and Asia.
16
Table of Contents
Commvault Systems, Inc.
Notes to Consolidated Financial Statements - Unaudited (continued)
(In thousands, except per share data)
11. Restructuring
We initiated a restructuring plan in the first quarter of fiscal 2026 intended to optimize our Business Technology organization. The objective of this plan is to realign the workforce, invest in emerging capabilities, modernize the technology landscape, and streamline operations to operate with greater agility and customer focus. These charges relate primarily to severance and related costs associated with headcount reductions and stock-based compensation related to modifications of existing awards granted to certain employees impacted by the plan. We anticipate the restructuring plan will be completed in fiscal 2026. The total costs to be incurred related to the restructuring plan cannot be estimated at this time.
In the fourth quarter of fiscal 2024, we initiated a restructuring plan which was completed in fiscal 2025. It was intended to enhance customer satisfaction through the reorganization and redesign of our customer success functions. The realignment of the customer success structure aimed to optimize operational efficiency and improve continuity for our customers through the pre-sales and post-sales experience. These charges related primarily to severance and related costs associated with headcount reductions, stock-based compensation related to modifications of existing awards granted to certain employees impacted by the plan and office termination and exit charges.
For the three months ended June 30, 2025 and 2024, restructuring charges were comprised of the following:
| Three Months Ended June 30, | |||||||||||
| 2025 | 2024 | ||||||||||
| Employee severance and related costs | $ | $ | |||||||||
Lease exit costs (1) | |||||||||||
| Stock-based compensation | |||||||||||
| Total restructuring charges | $ | $ | |||||||||
(1) Lease exit costs relate to one office for the three months ended June 30, 2024.
Restructuring accrual
The accrual activity related to our restructuring plans for the three months ended June 30, 2025 was as follows:
Total (1) | |||||
| Beginning balance | $ | ||||
| Employee severance and related costs | |||||
| Payments | ( | ||||
| Ending balance | $ | ||||
(1) During the three months ended June 30, 2025, there were no new charges incurred and $353 in payments made related to our prior restructuring plan that was completed in fiscal 2025. The amount included in the ending balance as of June 30, 2025 related to the completed plan was $437 .
17
Table of Contents
Commvault Systems, Inc.
Notes to Consolidated Financial Statements - Unaudited (continued)
(In thousands, except per share data)
12. Revolving Credit Facility
On April 15, 2025, we refinanced our existing $100,000 senior secured revolving credit facility, replacing it with a new five-year $300,000 senior secured revolving credit facility (the “Credit Facility”) with JPMorgan Chase Bank, N.A., as administrative agent, and the lenders party thereto. The Credit Facility is available for share repurchases, general corporate purposes, and letters of credit. The Credit Facility contains financial maintenance covenants, including a leverage ratio and interest coverage ratio. The Credit Facility also contains certain customary events of default which would permit the lenders to, among other things, declare all loans then outstanding to be immediately due and payable if such default is not cured within applicable grace periods. The Credit Facility also limits our ability to incur certain additional indebtedness, create or permit liens on assets, make acquisitions or investments, make loans or advances, sell or transfer assets, pay dividends or distributions, and engage in certain transactions with affiliates. Outstanding borrowings under the Credit Facility accrue interest at a per annum rate determined by the Company’s election of either the Secured Overnight Financing Rate plus a margin ranging from 1.50 % to 2.00 %, or a base rate, which is generally the greater of a prime rate plus a margin ranging from 0.50 % to 1.00 %. The applicable margin in each case is contingent upon the Company’s leverage ratio. Additionally, the unused balance on the Credit Facility is subject to an unused commitment fee at a rate equal to 0.25 % per annum subject to increases based on the Company's leverage ratio. As of June 30, 2025, there were no borrowings under the Credit Facility and we were in compliance with all covenants.
We have deferred the expense related to debt issuance costs, which are classified as other assets, and will amortize the costs into interest expense over the term of the Credit Facility. Unamortized amounts as of June 30, 2025 were $1,959 . The amortization of debt issuance costs and interest expense incurred for the three months ended June 30, 2025 and 2024 was as follows:
| Three Months Ended June 30, | |||||||||||
| 2025 | 2024 | ||||||||||
| Amortization of debt issuance costs | $ | $ | |||||||||
| Interest expense | |||||||||||
| Total charges | $ | $ | |||||||||
13. Subsequent Event
On July 24, 2025, we signed an agreement to acquire all of the shares of Satori Cyber, Ltd., a data and AI security company, for total cash consideration of approximately $24,000 , subject to customary transaction adjustments. The primary reason for the business combination is to advance our cyber resilience strategy. As the transaction occurred subsequent to quarter-end, we are still evaluating the purchase price allocation but expect the primary assets acquired to be intangible assets and goodwill. The closing is expected to be finalized in the second quarter of fiscal 2026.
18
Table of Contents
Item 2 - Management’s Discussion and Analysis of Financial Condition and Results of Operations
You should read the following discussion and analysis along with our consolidated financial statements and the related notes included elsewhere in this Quarterly Report on Form 10-Q. The statements in this discussion regarding our expectations of our future performance, liquidity and capital resources, and other non-historical statements are forward-looking statements. These forward-looking statements are subject to numerous risks and uncertainties, including, but not limited to, the risks and uncertainties described under “Risk Factors” in our Annual Report on Form 10-K for the fiscal year ended March 31, 2025. Our actual results may differ materially from those contained in or implied by any forward-looking statements.
Overview
Commvault Systems, Inc. aims to provide its customers cyber resiliency by protecting and recovering their data and cloud-native applications in a world of increasing cyber threats and attacks, including ransomware. We provide products and services across many types of environments, including on-premises, hybrid and multi-cloud. Our offerings are delivered via self-managed software, software-as-a-service ("SaaS"), integrated appliances, or managed by partners.
Sources of Revenues
We generate revenues through subscription arrangements, which includes both term-based software licenses and SaaS, perpetual software licenses, customer support contracts and other services. A significant portion of our total revenues comes from subscription arrangements, whether deployed on-premises (term-based license) or delivered via hosted cloud SaaS solutions. These arrangements are economically and contractually similar, as customers receive access to our software for a specified term under binding agreements. We are focused on these types of recurring revenue arrangements.
We expect our subscription arrangements will continue to generate revenues from the renewals of term-based licenses and SaaS offerings sold in prior years. Any of our pricing models (capacity, instance based, etc.) can be sold either through term-based licensing or via hosted cloud SaaS solutions. In term-based license arrangements, software revenue is generally recognized when the software is delivered. Revenue related to SaaS is recognized ratably over the contract period.
We sell to end-user customers both directly through our sales force and indirectly through our global network of value-added reseller partners, systems integrators, corporate resellers, original equipment manufacturers, and marketplaces. Revenue generated through indirect distribution channels accounted for approximately 90% of total revenues in both the three months ended June 30, 2025 and 2024. Revenue generated through direct distribution channels accounted for approximately 10% of total revenues in both the three months ended June 30, 2025 and 2024. Deals initiated by our direct sales force are sometimes transacted through indirect channels based on end-user customer requirements, which are not always in our control and can cause this overall percentage split to vary from period-to-period. As such, there may be fluctuations in the dollars and percentage of revenue generated through our distribution channels from time-to-time. We believe that the growth of our revenue, derived from both our indirect channel partners and direct sales force, are key attributes to our long-term growth strategy. We intend to continue to invest in both our channel relationships and direct sales force in the future, but we continue to expect more revenue to be generated through indirect distribution channels over the long term. The failure of our indirect distribution channels or our direct sales force to effectively sell our products and services could have a material adverse effect on our revenues and results of operations.
We have non-exclusive distribution agreements with certain partners who enable a more efficient and effective distribution channel for our solutions by managing our resellers and leveraging their own industry experience. For the three months ended June 30, 2025 and 2024, Partner A accounted for approximately 33% and 34% of our total revenues, respectively. Separately, Partner B accounted for approximately 11% of our total revenues for the three months ended June 30, 2025. Total revenues for the three months ended June 30, 2024 for Partner B were not material. If these partners discontinue or reduce the sales of our solutions or if our agreements with them were terminated, and if we were unable to take back the management of our reseller channel or find another distributor to replace them, there could be a material adverse effect on our future business.
Our customer support revenue includes support contracts tied to our software products. Customer support includes software updates on a when-and-if-available basis, telephone support, integrated web-based support, and other premium support offerings, for both term-based software license and perpetual software license arrangements. We sell our customer support contracts as a percentage of net software purchases. Customer
19
Table of Contents
support revenue is recognized ratably over the term of the customer support agreement, which is typically one year on our perpetual licenses and over the term on our term-based licenses, which typically range from one to three years.
Our other services revenue consists primarily of professional service offerings, including consultation, assessment and design, installation services, and customer education. Revenues from other services can vary period over period based on the timing services are delivered and are typically recognized as the services are performed.
For additional information on how we recognize revenue, see Note 3 of the Notes to Consolidated Financial Statements included in Part I, Item I of this Quarterly Report on Form 10-Q.
Key Performance Indicators ($ in millions)
We monitor the following key performance indicators to help evaluate the state of our business. We believe the below metrics are material to investors to understand the growth and performance of our business, as they help normalize certain variable factors. Metrics such as Annualized Recurring Revenue ("ARR"), Subscription ARR, SaaS ARR and SaaS Net Dollar Retention Rate ("SaaS NRR") provide a consistent view of our recurring revenue profile. ARR, Subscription ARR, and SaaS ARR exclude non-recurring elements and reflect the annualized value of active contracts, while SaaS NRR measures net expansion within our existing customer base. Together, we believe these metrics offer meaningful insight into the health and trajectory of our recurring revenue streams.
Annualized Recurring Revenue (ARR)
ARR represents the annualized recurring value of all active contracts at the end of a reporting period. It includes recurring subscription offerings (including term licenses, SaaS, and utility software), maintenance related to perpetual and term licenses, extended maintenance contracts (enterprise support), and managed services. It excludes non-recurring elements such as perpetual licenses and professional services which are typically delivered at a point in time. ARR is calculated by dividing the total contract value by the number of days in the contract term and multiplying by 365. We believe ARR is a valuable metric for evaluating the growth of our business, as it provides a normalized view of recurring revenue by excluding the variability associated with contract term lengths and omitting contracts that are not expected to renew.
| June 30, | ||||||||||||||
| 2025 | 2024 | |||||||||||||
| Total ARR | $ | 996.2 | $ | 802.7 | ||||||||||
| % Growth | 24 | % | 17 | % | ||||||||||
Subscription ARR
Subscription ARR includes only term licenses, SaaS, and utility arrangements, calculated using the same methodology as ARR. We believe Subscription ARR provides meaningful insight into the growth of our subscription-based offerings and reflects both new customer acquisition and expansion within our existing customer base. As our most strategically significant and rapidly expanding revenue streams, our subscription arrangements are central to our long-term growth strategy and operational focus.
| June 30, | ||||||||||||||
| 2025 | 2024 | |||||||||||||
| Subscription ARR | $ | 843.9 | $ | 635.9 | ||||||||||
| % Growth | 33 | % | 27 | % | ||||||||||
20
Table of Contents
SaaS ARR
SaaS ARR includes only the cloud-hosted portion of Subscription ARR and is calculated using the same methodology. SaaS ARR reflects the annualized value of active SaaS contracts and we believe this metric provides insight into customer adoption trends and expansion within our cloud-based offerings. As SaaS continues to represent a growing share of our total revenue, we view this metric as a key indicator of our ability to meet the evolving needs of our customer base. Continued adoption and conversion to SaaS arrangements are critical to sustaining our long-term growth and aligning with customer preferences for cloud-delivered solutions.
| June 30, | ||||||||||||||
| 2025 | 2024 | |||||||||||||
| SaaS ARR | $ | 306.9 | $ | 187.9 | ||||||||||
| % Growth | 63 | % | 66 | % | ||||||||||
SaaS Net Dollar Retention Rate (SaaS NRR)
SaaS NRR is the percentage of SaaS ARR retained from existing customers at the start of an annual period after accounting for expansion revenue, churn, and downgrades. It is presented on a constant currency basis using exchange rates as of March 31, 2025. We believe our SaaS Net Dollar Retention Rate offers valuable insight into the year-over-year expansion of our existing customer base, reflecting both increased utilization of current products and services as well as the adoption of additional offerings.
| June 30, | ||||||||||||||
| 2025 | 2024 | |||||||||||||
| SaaS NRR | 125 | % | 127 | % | ||||||||||
These metrics are non-GAAP measures and do not have standardized definitions under GAAP. As such, they may not be comparable to similarly titled measures used by other companies and should be considered as a supplement to, and not as a substitute for, financial information prepared in accordance with GAAP. Management uses these metrics to assess the health of our recurring revenue base and to inform strategic decision-making. These metrics should be viewed independently of GAAP revenue, deferred revenue and unbilled revenue and are not intended to be combined with or to replace those items. ARR is not a forecast of future revenue.
Foreign Currency Exchange Rates’ Impact on Results of Operations
Sales outside the United States were 44% and 48% of our total revenues for the three months ended June 30, 2025 and 2024, respectively. The income statements of our non-U.S. operations are translated into U.S. dollars at the average exchange rates for each applicable month in a period. To the extent the U.S. dollar weakens against foreign currencies, the translation of these foreign currency denominated transactions generally results in increased revenues, operating expenses and income from operations for our non-U.S. operations. Similarly, our revenues, operating expenses and income from operations will generally decrease for our non-U.S. operations if the U.S. dollar strengthens against foreign currencies.
Using the average foreign currency exchange rates from the three months ended June 30, 2024, our total revenues would have been lower by $5.0 million, our cost of revenues would have been lower by $0.2 million and our operating expenses would have been lower by $1.5 million from non-U.S. operations for the three months ended June 30, 2025.
In addition, we are exposed to risks of foreign currency fluctuation primarily from cash balances, accounts receivables and intercompany accounts denominated in foreign currencies and are subject to the resulting transaction gains and losses, which are recorded as a component of general and administrative expenses. We recognized net foreign currency transaction losses of approximately $1.2 million and insignificant losses for the three months ended June 30, 2025 and 2024, respectively.
21
Table of Contents
Critical Accounting Policies
In presenting our consolidated financial statements in conformity with U.S. GAAP, we are required to make estimates and judgments that affect the amounts reported therein. Some of the estimates and assumptions we are required to make relate to matters that are inherently uncertain as they pertain to future events. We base these estimates on historical experience and on various other assumptions that we believe to be reasonable and appropriate. Actual results may differ significantly from these estimates. To the extent that there are material differences between these estimates and actual results, our future financial statement presentation, financial condition, results of operations and cash flows may be affected.
In many cases, the accounting treatment of a particular transaction is specifically dictated by U.S. GAAP and does not require management’s judgment in its application, while in other cases, significant judgment is required in selecting among available alternative accounting standards that allow different accounting treatment for similar transactions. We consider these policies requiring significant management judgment to be critical accounting policies. These critical accounting policies are:
•Revenue Recognition
•Accounting for Income Taxes
•Goodwill and Purchased Intangible Assets
There have been no significant changes in our critical accounting policies during the three months ended June 30, 2025 as compared to the critical accounting policies and estimates disclosed in “Management’s Discussion and Analysis of Financial Condition and Results of Operations - Critical Accounting Policies” included in our Annual Report on Form 10-K for the fiscal year ended March 31, 2025.
22
Table of Contents
Results of Operations
Amounts reported in millions are rounded based on the amounts in thousands. As a result, the sum of the components reported in millions may not equal the total amount reported in millions due to rounding.
Three months ended June 30, 2025 compared to three months ended June 30, 2024
Revenues ($ in millions)
| Three Months Ended June 30, | ||||||||||||||||||||
| 2025 | 2024 | % Change | ||||||||||||||||||
| Subscription: | ||||||||||||||||||||
| Term-based license | $ | 109.3 | $ | 80.4 | 36 | % | ||||||||||||||
| SaaS | 72.4 | 43.7 | 66 | % | ||||||||||||||||
| Total subscription | 181.7 | 124.1 | 46 | % | ||||||||||||||||
| Perpetual license | 7.3 | 13.7 | (47) | % | ||||||||||||||||
| Customer support | 79.0 | 76.3 | 4 | % | ||||||||||||||||
| Other services | 13.9 | 10.6 | 31 | % | ||||||||||||||||
| Total revenues | $ | 282.0 | $ | 224.7 | 26 | % | ||||||||||||||
–Total revenues increased $57.3 million, or 26% year over year, driven primarily by an increase in both term-based license revenue and SaaS revenue, partially offset by a decrease in perpetual license revenue. We remain focused on selling subscription arrangements through both term-based software licenses and SaaS offerings.
–Term-based license revenue increased $28.9 million, or 36% year over year, primarily due to a 39% increase in larger transactions (deals greater than $0.1 million) period over period. This increase was driven by a 24% increase in customer volume and a 12% increase in the average selling price for larger transactions.
–SaaS revenue increased $28.8 million, or 66% year over year, as a result of growth in both new customer acquisitions and expansion of our existing customer base.
–Perpetual license revenue decreased $6.4 million, or 47% year over year. Our preferred route to market for software is led by the sale of term-based licenses. Perpetual licenses are generally only sold in certain verticals and geographies.
–Customer support revenue increased $2.7 million, or 4% year over year, driven by a $7.9 million increase in customer support revenue related to term-based license arrangements, partially offset by a $5.2 million decrease in customer support revenue attached to perpetual license support renewals.
–Other services revenue increased $3.3 million, or 31% year over year. Changes in other services revenue can vary period over period, primarily due to the timing professional services are delivered.
We track total revenues on a geographic basis. Our Americas region includes the United States, Canada, and Latin America. Our International region primarily includes Europe, Middle East, Africa, Australia, India, Southeast Asia and China. Americas and International represented 61% and 39% of total revenues, respectively, for the three months ended June 30, 2025. Total revenues increased 23% and 29% year over year in the Americas and International, respectively.
▪The increase in Americas total revenues was primarily due to increases of 16% and 82% in term-based license and SaaS revenues, respectively, partially offset by a 37% decrease in perpetual license revenue, driven by the shift from selling perpetual licenses to subscription software arrangements. Customer support revenue increased 1% year over year. Other services revenue increased 45% year over year primarily due to the timing professional services were delivered compared to the same period of the prior year.
▪The increase in International total revenues was due to increases of 90%, 42%, 7% and 11% in term-based license, SaaS, customer support and other services revenues, respectively, partially offset by a decrease of 51% in perpetual license revenue, as compared to the same period of the prior year.
Our total revenues in International is subject to changes in foreign exchange rates as further discussed above in the “Foreign Currency Exchange Rates’ Impact on Results of Operations” section.
23
Table of Contents
Cost of Revenues and Gross Margin ($ in millions)
| Three Months Ended June 30, | ||||||||||||||||||||
| 2025 | 2024 | |||||||||||||||||||
| Cost of Revenues | Gross Margin | Cost of Revenues | Gross Margin | |||||||||||||||||
| Subscription: | ||||||||||||||||||||
| Term-based license | $ | 2.2 | 98 | % | $ | 1.8 | 98 | % | ||||||||||||
| SaaS | 26.0 | 64 | % | 15.8 | 64 | % | ||||||||||||||
| Total subscription | 28.2 | 84 | % | 17.5 | 86 | % | ||||||||||||||
| Perpetual license | 0.2 | 97 | % | 0.3 | 98 | % | ||||||||||||||
| Customer support | 14.2 | 82 | % | 14.3 | 81 | % | ||||||||||||||
| Other services | 8.1 | 42 | % | 7.6 | 28 | % | ||||||||||||||
| Total cost of revenues | $ | 50.8 | 82 | % | $ | 39.8 | 82 | % | ||||||||||||
–Total cost of revenues increased $11.0 million and represented 18% of our total revenues for the three months ended June 30, 2025 and 2024.
–Cost of term-based license revenue increased $0.5 million and represented 2% of our term-based license revenue for the three months ended June 30, 2025 and 2024.
–Cost of SaaS revenue increased $10.2 million and represented 36% of our SaaS revenue for the three months ended June 30, 2025 and 2024. The year over year increase is primarily the result of incremental hosting costs associated with acquisitions completed in fiscal 2025 and an increase in the cost of infrastructure related to growth in our SaaS offerings.
–Cost of perpetual license revenue decreased $0.1 million and represented 3% of our perpetual revenue for the three months ended June 30, 2025 compared to 2% for the three months ended June 30, 2024.
–Cost of customer support revenue decreased $0.1 million, representing 18% of our customer support revenue for the three months ended June 30, 2025 compared to 19% for the three months ended June 30, 2024.
–Cost of other services revenue increased $0.5 million, representing 58% of our other services revenue for the three months ended June 30, 2025 compared to 72% for the three months ended June 30, 2024.
24
Table of Contents
Operating Expenses ($ in millions)


–Sales and marketing expenses increased $26.5 million, or 28%, primarily driven by a $13.3 million increase in employee compensation and sales commissions associated with increases in headcount and revenues relative to the same period in the prior year, including an increase of $3.1 million in stock-based compensation. In addition, there was an increase year over year of $9.0 million due to higher spending on marketing initiatives, which included in-person events and travel.
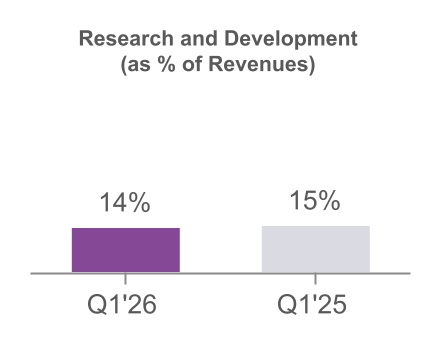
–Research and development expenses increased $7.0 million, or 21%, driven by an increase of $5.4 million in employee compensation and related expenses, including an increase of $1.9 million in stock-based compensation. The increase in employee compensation and related expenses is primarily driven by additional headcount, including headcount related to acquisitions completed in fiscal 2025. Investing in research and development remains a priority for Commvault and we anticipate continued responsible spending related to the development of our software applications and hosted services.
–General and administrative expenses increased $10.5 million, or 34%, driven by an increase of $8.3 million in employee compensation and related expenses, including an increase of $3.0 million in stock-based compensation.
–Depreciation and amortization expense increased $0.7 million, driven by the acquisition of intangible assets in fiscal 2025.
–Restructuring: Our restructuring plan, initiated in the first quarter of fiscal 2026, is intended to optimize our Business Technology organization. Restructuring expenses were $0.2 million for the three months ended June 30, 2025. These charges relate primarily to severance and related costs associated with headcount reductions and include $0.1 million of stock-based compensation related to modifications of existing awards granted to certain employees impacted by the plan. We anticipate the restructuring plan will be completed in fiscal 2026. Restructuring expenses were $4.7 million for the three months ended June 30, 2024 related to a prior restructuring plan that was completed in fiscal 2025.
Risks associated with our restructuring plan include additional unexpected costs, adverse effects on employee morale and the failure to meet operational and growth targets due to the loss of key employees, any of which may impair our ability to achieve anticipated results of operations or otherwise harm our business.
–Change in contingent consideration: During the three months ended June 30, 2025, we recorded a reduction to expense of $0.5 million related to the final achievement under our contingent consideration arrangement related to the acquisition of Appranix, Inc. The arrangement, with final aggregate consideration
25
Table of Contents
of $1.9 million, was contingent upon meeting certain financial metrics by June 30, 2025 and could have ranged up to $4.0 million.
Income Tax Expense
Income tax expense was $3.4 million in the three months ended June 30, 2025 compared to expense of $2.1 million in the three months ended June 30, 2024. The increase in income tax expense compared to the same period in the prior year relates primarily to estimated current federal taxes. We continue to monitor the impact of new global and U.S. legislation on our effective tax rate.
Liquidity and Capital Resources
In recent fiscal years, our principal source of liquidity has been cash provided by operations. As of June 30, 2025, our cash and cash equivalents balance was $363.2 million, of which approximately $289.7 million was held outside of the United States by our foreign legal entities. These balances are dispersed across approximately 35 international locations around the world. We believe that such dispersion meets the current and anticipated future liquidity needs of our foreign legal entities. In the event we need to repatriate funds from outside of the United States, such repatriation would likely be subject to restrictions by local laws and/or tax consequences, including foreign withholding taxes.
On April 15, 2025, we refinanced our existing $100 million senior secured revolving credit facility, replacing it with a new five-year $300 million senior secured revolving credit facility (the “Credit Facility”) with JPMorgan Chase Bank, N.A, as administrative agent, and the lenders party thereto. The Credit Facility is available for share repurchases, general corporate purposes, and letters of credit. The Credit Facility contains financial maintenance covenants, including a leverage ratio and interest coverage ratio. The Credit Facility also contains certain customary events of default which would permit the lenders to, among other things, declare all loans then outstanding to be immediately due and payable if such default is not cured within applicable grace periods. The Credit Facility also limits our ability to incur certain additional indebtedness, create or permit liens on assets, make acquisitions or investments, make loans or advances, sell or transfer assets, pay dividends or distributions, and engage in certain transactions with affiliates. Outstanding borrowings under the Credit Facility accrue interest at a per annum rate determined by the Company’s election of either the Secured Overnight Financing Rate plus a margin ranging from 1.50% to 2.00%, or a base rate, which is generally the greater of a prime rate plus a margin ranging from 0.50% to 1.00%. The applicable margin in each case is contingent upon the Company’s leverage ratio. Additionally, the unused balance on the Credit Facility is subject to an unused commitment fee at a rate equal to 0.25% per annum subject to increases based on the Company's leverage ratio. As of June 30, 2025, there were no borrowings under the Credit Facility and we were in compliance with all covenants.
On April 17, 2025, the Board of Directors approved an increase of the existing share repurchase program so that $250.0 million was available. The Board's authorization has no expiration date. For the three months ended June 30, 2025, we repurchased $15.1 million of our common stock. The remaining amount available under the current authorization as of June 30, 2025 was $235.0 million.
Our summarized cash flow information is as follows (in millions):
| Three Months Ended June 30, | ||||||||||||||
| 2025 | 2024 | |||||||||||||
| Net cash provided by operating activities | $ | 31.7 | $ | 44.7 | ||||||||||
| Net cash provided by (used in) investing activities | 26.8 | (22.3) | ||||||||||||
| Net cash used in financing activities | (16.9) | (46.1) | ||||||||||||
| Effects of exchange rate - changes in cash | 19.5 | (1.2) | ||||||||||||
| Net increase (decrease) in cash and cash equivalents | $ | 61.1 | $ | (24.9) | ||||||||||
26
Table of Contents


–Net cash provided by operating activities was impacted by net income adjusted for the impact of non-cash charges and a decrease in accrued expenses, partially offset by an increase in deferred revenue.
–Net cash provided by investing activities was the result of $34.8 million of net proceeds from the sale of Commvault's corporate headquarters, partially offset by $6.1 million for the purchase of equity securities and $1.9 million of capital expenditures.
–Net cash used in financing activities was the result of $15.1 million of repurchases of our common stock and $1.8 million of payment of debt issuance costs.
Working capital increased $51.1 million from $80.0 million as of March 31, 2025 to $131.1 million as of June 30, 2025. The net increase in working capital was primarily the result of an increase in cash and cash equivalents and a decrease in accrued liabilities, partially offset by an increase in the current portion of deferred revenue.
We believe that our existing cash, cash equivalents and our cash from operations will be sufficient to meet our anticipated cash needs for working capital, income taxes, capital expenditures and potential stock repurchases for at least the next 12 months. We may seek additional funding through public or private financings or other arrangements during this period. Adequate funds may not be available when needed or may not be available on terms favorable to us, or at all. If additional funds are raised by issuing equity securities, dilution to existing stockholders will result. If we raise additional funds by obtaining loans from third parties, the terms of those financing arrangements may include negative covenants or other restrictions on our business that could impair our operational flexibility and would also require us to fund additional interest expense. If funding is insufficient at any time in the future, we may be unable to develop or enhance our products or services, take advantage of business opportunities, or respond to competitive pressures, any of which could have a material adverse effect on our business, financial condition and results of operations.
Impact of Recently Issued Accounting Standards
See Note 2 of the Notes to Consolidated Financial Statements included in Part I, Item I of this Quarterly Report on Form 10-Q for a discussion of the impact of recently issued accounting standards.
Item 3 - Quantitative and Qualitative Disclosures about Market Risk
Interest Rate Risk
None.
27
Table of Contents
Foreign Currency Risk
Economic Exposure
As a global company, we face exposure to adverse movements in foreign currency exchange rates. Our international sales are generally denominated in foreign currencies and this revenue could be materially affected by currency fluctuations. Approximately 44% of our sales were outside the United States for the three months ended June 30, 2025. Our primary exposures are to fluctuations in exchange rates for the U.S. dollar versus the Euro, and to a lesser extent, the Australian dollar, British pound sterling, Canadian dollar, Chinese yuan, Indian rupee, Korean won and Singapore dollar. Changes in currency exchange rates could adversely affect our reported revenues and require us to reduce our prices to remain competitive in foreign markets, which could also have a material adverse effect on our results of operations. Historically, we have periodically reviewed and revised the pricing of our products available to our customers in foreign countries and we have not maintained excess cash balances in foreign accounts.
Transaction Exposure
Our exposure to foreign currency transaction gains and losses is primarily the result of certain net receivables due from our foreign subsidiaries and customers being denominated in currencies other than the functional currency of the subsidiary. Our foreign subsidiaries conduct their businesses in local currency and we generally do not maintain excess U.S. dollar cash balances in foreign accounts.
Foreign currency transaction gains and losses are recorded in general and administrative expenses in the consolidated statements of operations. We recognized net foreign currency transaction losses of approximately $1.2 million and insignificant losses for the three months ended June 30, 2025 and 2024, respectively.
Item 4 - Controls and Procedures
Evaluation of Disclosure Controls and Procedures
Our management, with the participation of the Chief Executive Officer and Chief Financial Officer, has evaluated the effectiveness of our disclosure controls and procedures, as defined in Rules 13a-15(e) and 15d-15(e) of the Securities Exchange Act of 1934, as amended, as of June 30, 2025. Based on that evaluation, the Chief Executive Officer and Chief Financial Officer concluded that our disclosure controls and procedures were effective as of June 30, 2025.
Changes in Internal Control over Financial Reporting
There was no change in our internal control over financial reporting that occurred during the first quarter of fiscal 2026 that has materially affected, or is reasonably likely to materially affect, our internal control over financial reporting.
Inherent Limitations on Internal Controls
Our management, including our Chief Executive Officer and Chief Financial Officer, do not expect that our disclosure controls and procedures or our internal control over financial reporting will prevent or detect all error and fraud. A control system, no matter how well designed and operated, can provide only reasonable, not absolute, assurance that the control objectives of the control system are met. Further, the design of a control system must reflect the fact that there are resource constraints, and the benefits of controls must be considered relative to their costs. Because of inherent limitations in all control systems, no evaluation of controls can provide absolute assurance that all control issues and instances of fraud, if any, within the company have been detected. These inherent limitations include the realities that judgments in decision-making can be faulty, and that breakdowns can occur because of a simple error or mistake. Additionally, controls can be circumvented by the individual acts of some persons, by collusion of two or more people, or by management override of the controls. The design of any system of controls also is based in part upon certain assumptions about the likelihood of future events, and there can be no assurance that any design will succeed in achieving its stated goals under all potential future conditions. Over time, controls may become inadequate because of changes in conditions, or the degree of compliance with the policies or procedures may deteriorate. Because of inherent limitations in a cost-effective control system, misstatements due to error or fraud may occur and not be detected.
28
Table of Contents
PART II. OTHER INFORMATION
Item 1. Legal Proceedings
From time to time, we are subject to claims in legal proceedings arising in the normal course of business. We do not believe that we are currently party to any pending legal action that could reasonably be expected to have a material adverse effect on our business or operating results. Please refer to Part I, “Item 1A. Risk Factors” in our Annual Report on Form 10-K for the year ended March 31, 2025 for additional information.
Item 1A. Risk Factors
In addition to the other information set forth in this report, you should carefully consider the factors discussed in Part I, “Item 1A. Risk Factors” in our Annual Report on Form 10-K for the year ended March 31, 2025, which are incorporated herein by reference, and could materially affect our business, financial condition or future results. Additional risks and uncertainties not currently known to us or that we currently deem to be immaterial also may materially adversely affect our business, financial condition and/or operating results. If any of the risks actually occur, our business, financial conditions or results of operations could be negatively affected. In that case, the trading price of our stock could decline, and our stockholders may lose part or all of their investment. There have been no material changes from the risk factors set forth in Part I, “Item 1A. Risk Factors” in our Annual Report on Form 10-K for the year ended March 31, 2025.
Item 2. Unregistered Sales of Equity Securities and Use of Proceeds
Issuer Purchases of Equity Securities
On April 17, 2025, the Board of Directors approved an increase of the existing share repurchase program so that $250.0 million was available. The Board's authorization has no expiration date. During the three months ended June 30, 2025, we repurchased $15.1 million of common stock, or approximately 0.1 million shares, under our share repurchase program. As of June 30, 2025, the remaining amount available under the current authorization was $235.0 million. A summary of our repurchases of common stock is as follows:
| Period | Total number of shares purchased | Average price paid per share | Total number of shares purchased as part of publicly announced programs | Approximate dollar value of shares that may yet be purchased under the program (in thousands) | ||||||||||||||||||||||
| April 1, 2025 - April 30, 2025 | — | $ | — | — | $250,000 | |||||||||||||||||||||
| May 1, 2025 - May 31, 2025 | — | $ | — | — | $250,000 | |||||||||||||||||||||
| June 1, 2025 - June 30, 2025 | 82,102 | $ | 183.30 | 82,102 | $234,950 | |||||||||||||||||||||
| Three months ended June 30, 2025 | 82,102 | $ | 183.30 | 82,102 | ||||||||||||||||||||||
Item 3. Defaults upon Senior Securities
None.
Item 4. Mine Safety Disclosures
Not Applicable.
29
Table of Contents
Item 5. Other Information
On June 10, 2025 , Jennifer DiRico , Chief Financial Officer , adopted a Rule 10b5-1 trading arrangement intended to satisfy the affirmative defense of Rule 10b5-1(c) for the sale of up to approximately 21,000 shares of the Company’s common stock. The plan is in effect until March 6, 2026 .
On June 13, 2025, Gary Merrill, Chief Commercial Officer, modified his Rule 10b5-1 trading arrangement that was originally adopted on November 20, 2024, to increase the number of shares to be sold under the plan. The modified trading arrangement is intended to satisfy the affirmative defense of Rule 10b5-1(c) for the sale of up to approximately 34,000 shares of the Company’s common stock and is in effect until May 31, 2027.
During the three months ended June 30, 2025, no other directors or officers of the Company adopted , modified or terminated
Item 6. Exhibits
| Exhibit No. | Description | ||||
10.1* | Lease Agreement, by and between Bell Works Tinton Falls Urban Renewal LLC and Commvault Systems, Inc. with an effective date of April 28, 2025. | ||||
10.2 | Credit Agreement, dated April 15, 2025, by and among Commvault Systems, Inc., the lenders from time to time party thereto, and JPMorgan Chase Bank, N.A., as Administrative Agent (Incorporated by reference to Exhibit 10.1 to the Registrant's Form 8-K dated April 15, 2025). | ||||
31.1 | Certification of Chief Executive Officer Pursuant to Section 302 of the Sarbanes-Oxley Act of 2002 | ||||
31.2 | Certification of Chief Financial Officer Pursuant to Section 302 of the Sarbanes-Oxley Act of 2002 | ||||
32.1** | Certification of Chief Executive Officer Pursuant to Section 906 of the Sarbanes-Oxley Act of 2002 | ||||
32.2** | Certification of Chief Financial Officer Pursuant to Section 906 of the Sarbanes-Oxley Act of 2002 | ||||
99.1* | Purchase and Sale Agreement, by and between Commvault and Somerset Development, LLC, with an effective date of October 2,2024 (Incorporated by reference to Exhibit 10.1 to the Registrant's Form 8-K dated October 4, 2024). | ||||
| 101.INS | XBRL Instance Document - the instance document does not appear in the Interactive Data File because its XBRL tags are embedded within the Inline XBRL document | ||||
| 101.SCH | XBRL Taxonomy Extension Schema Document | ||||
| 101.CAL | XBRL Taxonomy Extension Calculation Linkbase Document | ||||
| 101.DEF | XBRL Taxonomy Extension Definition Linkbase Document | ||||
| 101.LAB | XBRL Taxonomy Extension Label Linkbase Document | ||||
| 101.PRE | XBRL Taxonomy Extension Presentation Linkbase Document | ||||
| 104 | Cover Page Interactive Data File (formatted as Inline XBRL and contained in Exhibit 101) | ||||
| * Certain exhibits to this Agreement have been omitted pursuant to Item 601(a)(5) of Regulation S-K. A copy of any omitted exhibit will be furnished as a supplement to the Securities and Exchange Commission upon request. | |||||
| ** Furnished herewith | |||||
30
Table of Contents
SIGNATURES
Pursuant to the requirements of the Securities Exchange Act of 1934, the registrant has duly caused this report to be signed on its behalf by the undersigned thereunto duly authorized.
| Commvault Systems, Inc. | ||||||||||||||
| Dated: | July 30, 2025 | By: | /s/ Sanjay Mirchandani | |||||||||||
| Sanjay Mirchandani | ||||||||||||||
| Director, President and Chief Executive Officer | ||||||||||||||
| (Principal Executive Officer) | ||||||||||||||
| Dated: | July 30, 2025 | By: | /s/ Jennifer DiRico | |||||||||||
| Jennifer DiRico | ||||||||||||||
| Chief Financial Officer | ||||||||||||||
| (Principal Financial Officer) | ||||||||||||||
31