
Troilus Reports Updated Technical Report Following Completion of Basic Engineering, Delivering After-Tax US$3.2 Billion NPV5%, 22% IRR, and Cashflow of US$6.9 Billion at Base Case Gold Price of US $3,600/oz
Updated engineering lifts reserves, extends mine life and tightens cost estimates, targeting US$3.2 billion after-tax NPV at long-term metal prices.
Sentiment and the balance of points
Rhea-AI Sentiment reads the wording of the document, how positive or negative its language is on a 1 to 5 scale. The balance of points shown with the takes weighs what the document actually discloses, so the two can disagree, for example when a trial that missed its main goal is described in upbeat language.
Rhea-AI Summary
Troilus Mining (CHXMF) released an updated NI 43-101 Technical Report for its gold-copper Troilus Project in Quebec, based on completed Basic Engineering, outlining a 26-year open-pit mine with after-tax NPV(5%) of US$3.2 billion, 22% IRR and a 3.6-year payback at a base gold price of US$3,600/oz.
The plan is underpinned by 478 million tonnes of Proven and Probable Reserves grading 0.44 g/t gold, 0.05% copper and 0.92 g/t silver, supporting life-of-mine payable output of 5.63 million ounces of gold, 472 million pounds of copper and 10.88 million ounces of silver. Initial capital is estimated at US$1.428 billion, with life-of-mine operating costs of US$19.21/t milled and AISC of US$1,340 per payable gold ounce. The estimate reflects roughly 95,000 engineering hours, ~90% market‑validated pricing and meets AACE Class 3 (+15%/‑10%) accuracy, which the company said strengthens the basis for financing and execution.
Positive
- After-tax NPV(5%) of US$3.2 billion, IRR 22%, 3.6-year payback at US$3,600/oz gold
- Life-of-mine after-tax cash flow of US$6.9 billion
- 26-year mine life with 5.63Moz gold, 472Mlb copper, 10.88Moz silver payable
- Mineral Reserves of 478Mt grading 0.44 g/t Au, 0.05% Cu, 0.92 g/t Ag
- Reserve tonnage increased by ~26% versus the 2024 Feasibility Study
- Life-of-mine strip ratio improved to 2.4:1 from 3.1:1 in the 2024 FS
- Life-of-mine AISC estimated at US$1,340 per payable gold ounce after credits
- Capital and operating estimates meet AACE Class 3 accuracy with ~95,000 engineering hours and ~90% market-validated pricing
Negative
- Project requires high initial capital of US$1.428 billion
- After-tax payback period of 3.6 years before initial capital is recovered
News Explained
The US$1.428 billion estimate excludes specified costs through the first quarter of 2027; construction is still a future decision.
The disclosed project state is engineering-stage: Troilus says it is advancing through Detailed Engineering toward a future construction decision.
That means the reported
The estimate includes capitalized operating costs and capitalized revenues but excludes sunk costs planned through
Details
News Market Reaction – CHXMF
On Sep 9, the day this news came out, CHXMF closed 0.38% below the previous close.
Data tracked by StockTitan Argus for the Sep 9 session.
AI-generated analysis. How Rhea-AI works. Not financial advice.




Approximately 95,000 engineering hours and market validation of ~
MONTREAL, Sept. 09, 2026 (GLOBE NEWSWIRE) -- Troilus Mining Corp. (“Troilus” or the “Company”) (TSX: TLG; OTCQX: CHXMF; FSE: CM5), is pleased to report the results of an updated NI 43-101 Technical Report (the “Technical Report”) for the gold-copper Troilus Project located in northcentral Quebec, Canada. Based on the Company’s completed Basic Engineering program, the Technical Report confirms and improves upon the strong economic fundamentals established in the May 2024 Feasibility Study (“2024 FS”), while extending the Project’s mine life, strengthening its gold and copper production profile, and incorporating a substantially more advanced level of engineering, design and cost definition.
The Technical Report outlines a large-scale, approximately 26-year mine life with an after-tax NPV5% of
Importantly, the updated capital estimate has been developed following completion of Basic Engineering, representing approximately 95,000 engineering hours and C
All dollar values are in United States dollars unless stated otherwise.
Technical Report Highlights
Compelling Economics and Significant Cash Flow Generation
- Base case before-tax NPV(
5% ) of US$5.3 billion and IRR of27% , based on long-term metal prices of US$3,600 /oz gold, US$5.00 /lb copper and US$50.00 /oz silver - Approximately US
$11.1 billion of cumulative before-tax cash flow over the life of mine - Approximately US
$4.2 billion in taxes paid over the life of mine, including Quebec mining tax, Quebec income tax and Federal income tax - Base case after-tax NPV(
5% ) of US$3.2 billion , IRR of22% and 3.6-year payback, based on long-term metal prices of US$3,600 /oz gold, US$5.00 /lb copper and US$50.00 /oz silver - Approximately US
$6.9 billion of cumulative after-tax cash flow over the life of mine - Strong leverage to metal prices: at US
$4,500 /oz gold, after-tax NPV(5% ) increases to approximately US$4.7 billion , IRR to28% , with payback reduced to approximately 3.0 years
Large-Scale, Long-Life Gold-Copper Operation
- Approximately 26-year mine life based on a conventional open-pit operation and 50,000 tpd nameplate processing rate
- Life-of-mine payable production of 5.63 million ounces of gold, 472 million pounds of copper and 10.88 million ounces of silver
- 304,000 payable gold-equivalent ounces of average annual production from 2031–2040, with peak annual production of approximately 557,000 payable gold-equivalent ounces in 2042
- Average annual payable production during the 21-year active mining period of approximately 251,000 ounces of gold, 20.1 million pounds of copper and 466,000 ounces of silver
- Life-of-mine strip ratio improves to 2.4:1, compared with 3.1:1 in the 2024 Feasibility Study
Updated Capital and Competitive Cost Profile
- Initial capital of approximately US
$1.428 billion 1, reflecting a substantially more advanced and fully defined Project design, supported by approximately 95,000 engineering hours, ~90% market-validated pricing and AACE Class 3 (+15% /-10% ) estimate accuracy across the full Project scope. - Life-of-mine operating costs of approximately US
$19.21 /t milled ore - Life-of-mine AISC of approximately US
$1,340 per payable gold ounce, net of copper and silver credits
Expanded Reserve Base with Further Upside
- Mine plan underpinned by a Mineral Reserve estimate of 478 million tonnes grading 0.44 g/t gold,
0.05% copper and 0.92 g/t silver, comprising 6.7 million contained ounces of gold, 568 million contained pounds of copper and 14.2 million contained ounces of silver - Reserve tonnage increased approximately
26% compared with the 2024 Feasibility Study - Mineral Reserve estimate effective December 31, 2025, excluding drilling results announced during 2026 and preserving potential future resource growth and mine-plan optimization upside
- Numerous near-mine and regional targets provide additional opportunities for resource growth and new discoveries beyond the current mine plan
- Ongoing infill and pit optimization drilling targeting inferred material and historically unsampled intervals
_________________________
1 The initial capital cost estimate of US
Justin Reid, CEO of Troilus, commented, “The results presented in our updated technical report reinforce Troilus’ position as one of the most compelling large-scale gold-copper development projects in North America. The combination of a US
Table 1: Gold-Copper Troilus Project Technical Report Summary
| Technical Report Summary | ||
| Units | Values | |
| Base Case Assumptions | ||
| Gold Price (Long Term) | USD/oz | 3,600 |
| Copper Price (Long Term) | USD/lb | 5 |
| Silver Price (Long Term) | USD/oz | 50 |
| Exchange Rate | CAD:USD | 1.37 |
| Discount Rate | % | 5 |
| Production | ||
| Mine Life | Years | 26 |
| Total Mined and Milled | M Tonnes | 478.2 |
| Strip Ratio | W:O | 2.4:1 |
| Daily Mill Throughput | tpd | 50,000 |
| Annual Mill Throughput | M Tonnes/year | 18.3 |
| Gold Grade | g/t | 0.44 |
| Copper Grade | (%) | 0.05 |
| Silver Grade | g/t | 0.92 |
| Total Payable Gold Production | koz | 5,631 |
| Average Annual Payable Gold Production (Yrs 1-21)* | koz/year | 251 |
| Total Payable Copper Production | Mlbs | 472 |
| Average annual Payable Copper Production (Yrs 1-21)* | Mlbs/year | 20.1 |
| Total Payable Silver Production | koz | 10,880 |
| Average Annual Payable Silver in Gold doré (Yrs 1-21)* | koz/year | 466 |
| Average Concentrate Production (Yrs 1 - 21)* | DMT/year | 63,022 |
| Average Gold Grade | g/t | 79.3 |
| Average Copper Grade | (%) | |
| Average Silver Grade | g/t | 248 |
| Operating Costs (LOM) | ||
| Open Pit Mine Operating Cost | $/t milled | 11.25 |
| Process Operating Cost | $/t milled | 5.55 |
| General and Administration Cost | $/t milled | 2.40 |
| Royalties | (% of NSR) | 1.0 |
| Total Operating Costs | $/t Mill Feed | 19.21 |
| All-in-Sustaining Cost (AISC**) (after metal credits) | $/oz | 1,340 |
| Capital Costs | ||
| Initial Capital Cost*** | $M | 1,428 |
| Sustaining Capital Cost | $M | 198 |
| Reclamation and Closure Costs | $M | 52.4 |
| Financial Analysis Summary | ||
| Pre-Tax Cash Flow | $M | 11,129 |
| Pre-Tax NPV( | $M | 5,266 |
| Pre-Tax IRR | % | 27 |
| Pre-Tax Payback Period | Years | 3.3 |
| After-Tax Cash Flow | $M | 6,927 |
| After-Tax NPV( | $M | 3,206 |
| After-Tax IRR | % | 22 |
| After-Tax Payback Period | Years | 3.6 |
* Years 22-26 is production from stockpile with average annual production of 65koz/year gold, 9.4Mlbs/year copper and 200koz/year of silver.
**All-in sustaining cost per ounce is a non-GAAP ratio. This measure has no standardized meaning under
IFRS Accounting Standards (IFRS) and may not be comparable to similar measures used by other issuers.
Refer to the “Non-GAAP Financial Measures” section of this press release for more information,
including a detailed description of these measures.
*** The initial capital cost estimate of US
Technical Report Overview
The Technical Report was prepared in accordance with NI 43-101 for Troilus with contributions from BBA Inc. (“BBA”), AGP Mining Consultants Inc. (“AGP”) and WSP Canada Inc. (“WSP”), and incorporates the results of the Company’s completed Basic Engineering program.
The Technical Report outlines a large-scale, conventional open-pit operation processing 50,000 tonnes per day from the 87, J, X22 and SW deposits. The mine plan is underpinned by 478 million tonnes of Proven and Probable Mineral Reserves grading 0.44 g/t Au,
Life-of-mine payable production totals approximately 5.63 million ounces of gold, 472 million pounds of copper and 10.88 million ounces of silver. During the 21-year active mining period, annual payable production averages approximately 251,000 ounces of gold, 20.1 million pounds of copper and 466,000 ounces of silver. At base case metal prices of US
Processing is based on a conventional flowsheet incorporating crushing, HPGRs, ball milling, gravity concentration and flotation, producing a gold-rich copper concentrate and gold-silver doré.
Key Project Optimizations and Advancements
The Technical Report incorporates the results of Basic Engineering, expanded metallurgical testwork, current vendor pricing and more advanced execution planning, resulting in a substantially more developed Project design than the 2024 Feasibility Study. Key advancements include:
Additional Front-End Processing Capacity and Flexibility: The updated flowsheet incorporates two parallel 35,000 tpd HPGR units within the 50,000 tpd nameplate processing plant. This will provide additional front-end processing capacity, along with additional plant availability with two lines, and operating flexibility to support throughput capacity across variable ore characteristics throughout the ramp-up period and into commercial production.
Higher-Confidence Comminution and Process Design: Additional metallurgical testwork has identified higher ore hardness in the SW Zone which will be mined in early years of operation, and this harder ore has been used as the benchmark to inform processing equipment sizing and the updated grinding design basis. The resulting configuration is designed to support reliable throughput and reduce ramp-up and operating risk.
Gold Doré Production from Initial Start-up: The gold room has been advanced into initial construction rather than deferred as was the case previously. This will enable gravity-recovered gold to be poured as doré from the outset of operations, supporting earlier cash generation and working capital during ramp-up.
Refined Infrastructure and Execution Planning: Basic Engineering materially advanced site-wide electrical, water, tailings and civil design, while integrating engineering and procurement with construction sequencing, long-lead equipment planning and commissioning readiness. This provides a more developed basis for Project execution as Troilus advances through Detailed Engineering.
Capital Costs
Updated Capital Estimate Reflects Advanced Engineering and Project Optimization
Initial capital is estimated at US
Since completion of the 2024 Feasibility Study, approximately 95,000 engineering hours have materially advanced design definition across the full Project scope. The largest areas of refinement relate to EPCM requirements, construction labour, concrete and structural steel quantities, owner’s costs and other indirect costs, all of which are now defined at a significantly greater level of detail than at the 2024 Feasibility Study stage. Approximately
The updated estimate also incorporates current mechanical, electrical and civil pricing, together with design changes intended to improve Project robustness and operating flexibility. These include two 35,000 tpd HPGR units, providing additional front-end processing capacity while maintaining the Project’s 50,000 tpd nameplate throughput; advancement of the gold room into initial construction, enabling doré production from the outset of operations and supporting early working capital; and updated electrical, civil and water-management infrastructure.
Together, these changes reflect both a substantially higher level of cost certainty and a more fully engineered Project than was contemplated at the 2024 Feasibility Study stage.
Table 2. Troilus Project Capital Costs
| Description | Cost (US$ million) |
| On-Site and Off-Site Infrastructures | 147.7 |
| Energy & Site Power Distribution | 18.4 |
| 161kV Hydro Quebec Transmission Line Compensation | 12.8 |
| Emergency Generators | 9.3 |
| Synchronous capacitance power factor correction | 24.2 |
| Mining Infrastructures | 64.8 |
| Dry Comminution | 227.2 |
| Processing Plant | 385.7 |
| Tailings & Water Management | 87.0 |
| Owner’s Project Costs | 84.1 |
| EPCM Services | 123.7 |
| Construction Indirects | 107.7 |
| Spares parts, freight & Vendor Support | 47.9 |
| Contingency* | 131.9 |
| Mining | 202.9 |
| Sunk Capital Costs | (145.2) |
| Capitalized Operating Costs | 78.8 |
| Capitalized Revenue | (180.8) |
| Total Initial Capital** | 1,428.1 |
| Sustaining Capital Costs | 198.0 |
| Reclamation and Closure Costs | 52.4 |
*Contingency was estimated at P50
**The initial capital cost estimate of US
Operating Costs
Operating costs have been developed at a substantially greater level of definition through Basic Engineering, using a combination of first principal estimates, project-specific design criteria, metallurgical testwork, current supplier quotations and Québec labour benchmarks. Mine operating costs are based on detailed equipment, productivity, fuel and labour assumptions, while process operating costs incorporate equipment-specific power requirements, testwork-based reagent consumption, supplier pricing and maintenance requirements.
This more detailed and market-informed approach provides a higher-confidence operating cost basis as the Project advances through Detailed Engineering. Average life-of-mine operating costs are estimated at US
Table 3. Troilus Project Operating Costs
| Area | Units | Year 1-5 | Year 6-21 | LOM (Year 1-26) |
| Open Pit Mining | $/tonne moved | 3.20 | 3.22 | 3.12 |
| $/t mill feed | 15.91 | 12.49 | 11.25 | |
| Processing | $/t mill feed | 5.82 | 5.54 | 5.55 |
| G&A | $/t mill feed | 2.98 | 2.43 | 2.40 |
| Total Operating Cost | $/t mill feed | 24.70 | 20.45 | 19.21 |
Table 4. Troilus Production Costs per Payable Gold Ounce (Cash Costs + AISC)
| Mine Production (Years 1–21) | Stockpile Reclaim (Years 22-26) | Life-of-mine | ||||
| Cash Cost (US$/payable Au oz) | ||||||
| AISC (US$/payable Au oz) | ||||||
| Operating Margin (US$/payable Au oz) | ||||||
Cash cost per ounce and AISC are a non-GAAP ratios. These measures have no standardized meaning under IFRS and may not be comparable to similar measures used by other issuers. Refer to the “Non-GAAP Financial Measures” section of this press release for more information, including a detailed description of these measures.
Project Economics and Sensitivity
The Technical Report demonstrates strong cash flow generation and robust economic returns across a range of metal price assumptions. At long-term base case metal price assumptions of US
The Project remains highly leveraged to metal prices, with after-tax NPV(
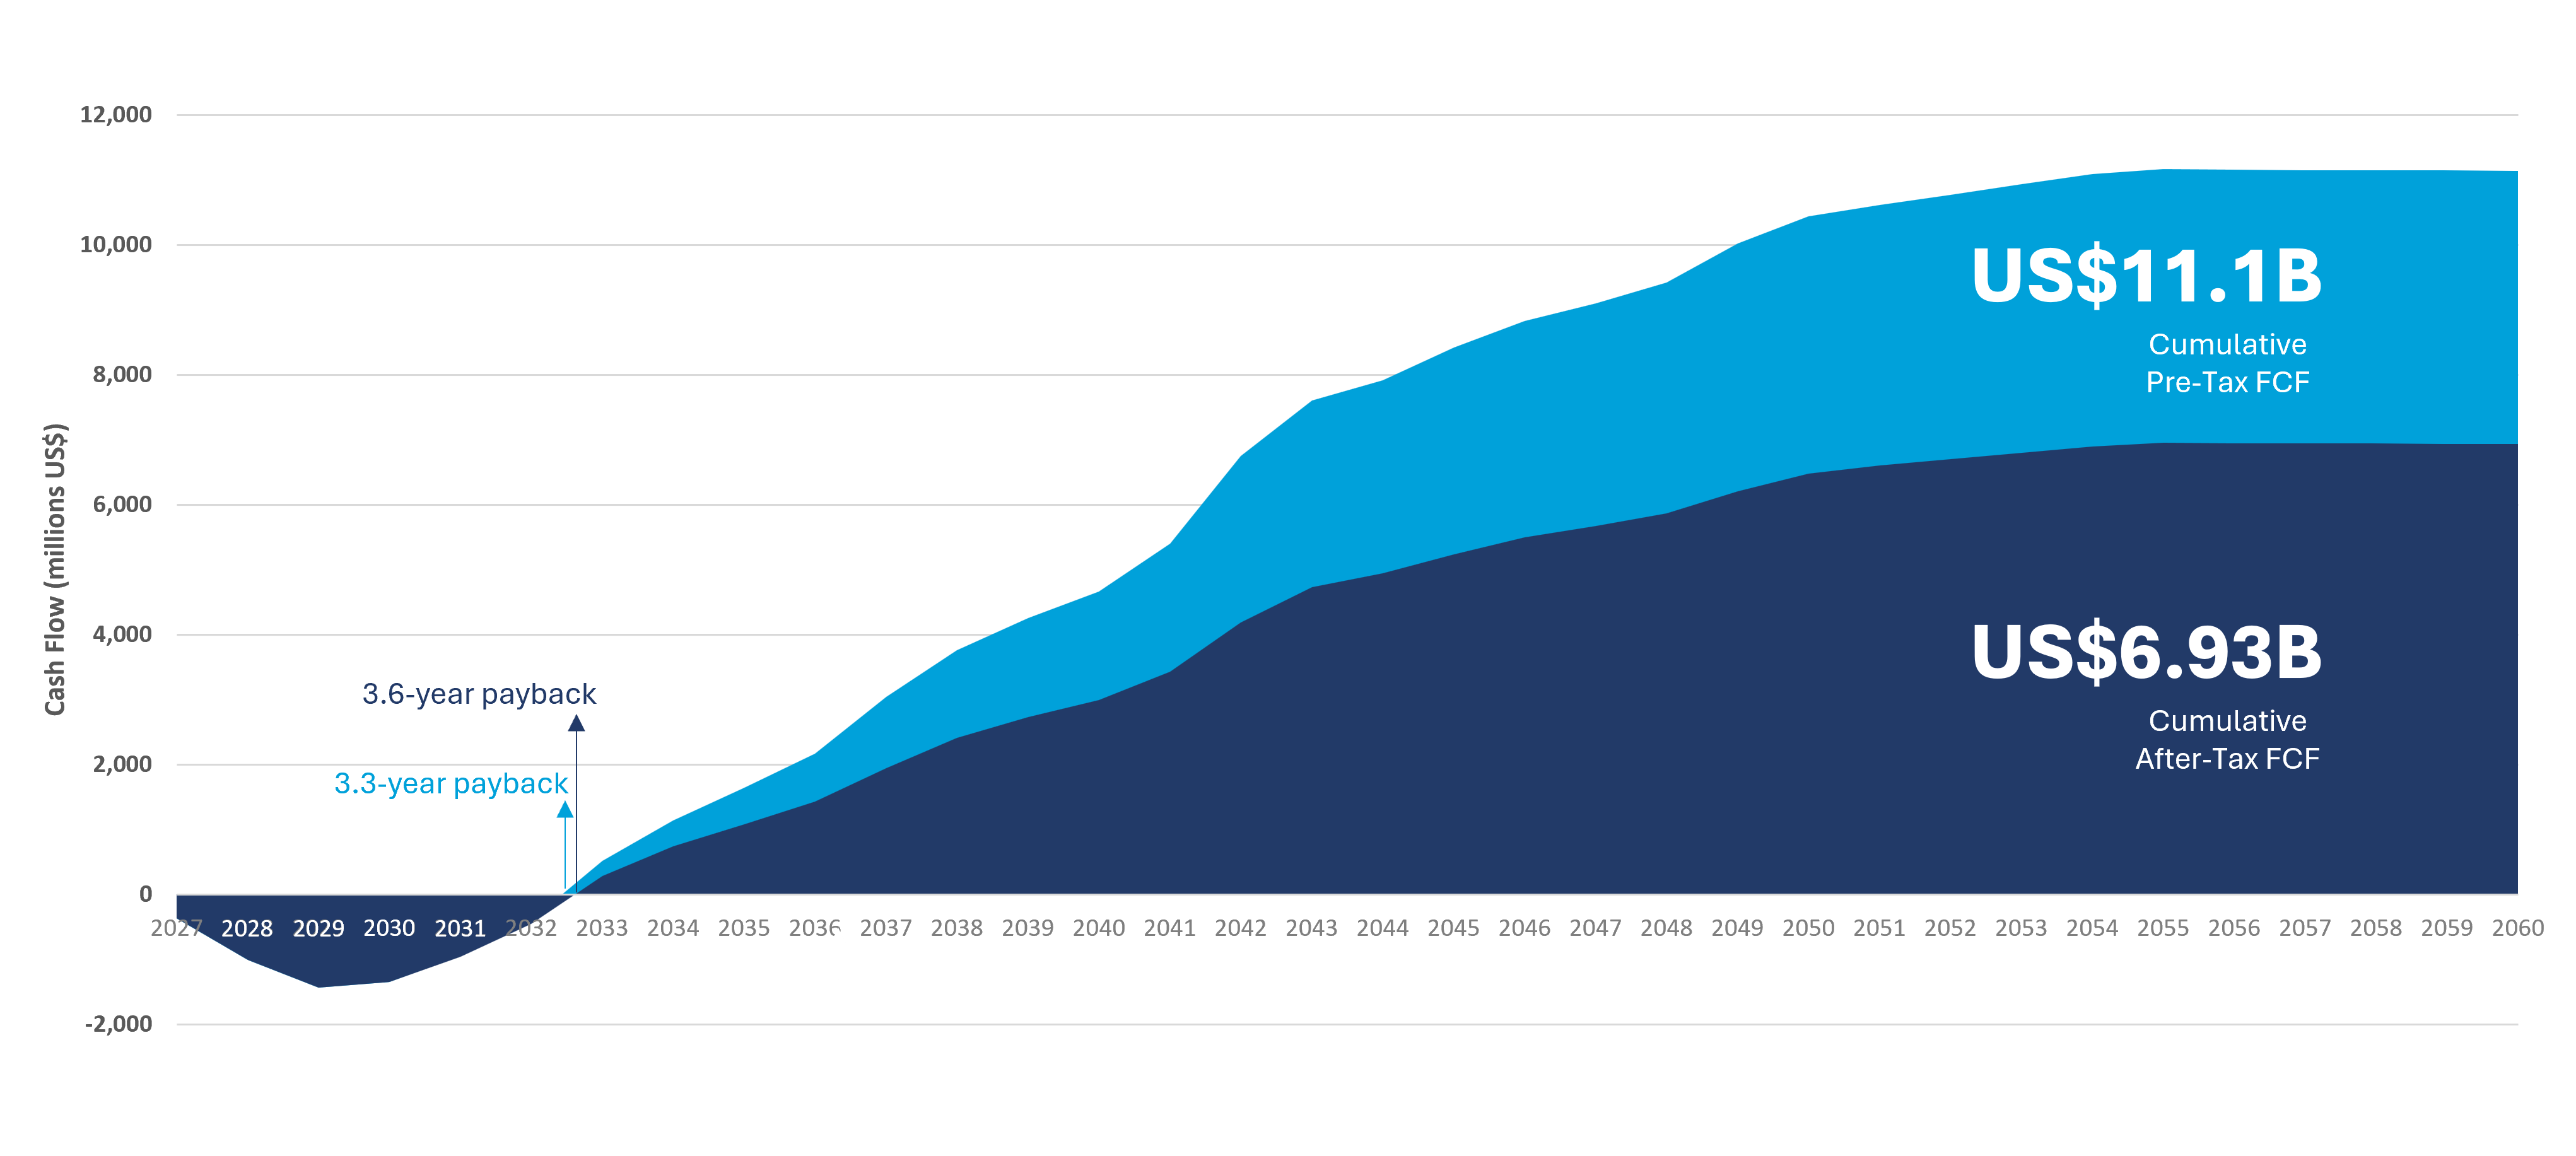
Figure 1: Troilus Project, Cumulative Cash Flows
Table 5. Troilus Project, Economic Sensitivity Analysis
| Gold Price (US$/oz) | 2,000 | 2,500 | 3,000 | 3,600 | 4,000 | 4,500 | 5,000 |
| After Tax NPV | 384 | 1,322 | 2,190 | 3,206 | 3,866 | 4,668 | 5,484 |
| After-Tax IRR | 22.0% | ||||||
| Payback (years) | 9.4 | 6.3 | 5.3 | 3.6 | 3.3 | 3.0 | 2.6 |
Mineral Resource & Reserves Summary
Mineral Reserve Estimate
The updated Mineral Reserve estimate totals 478 million tonnes of Proven and Probable Mineral Reserves grading 0.44 g/t gold,
The Mineral Reserves are derived from Measured and Indicated Mineral Resources within the 87, J, X22 and SW open pits and have an effective date of December 31, 2025. Accordingly, drilling results announced during 2026 are not incorporated into the current Reserve estimate and represent potential future opportunities for resource and reserve growth and mine-plan optimization.
Table 6. Troilus Project, Mineral Reserve Estimate
| Contained Metal | |||||||||
| Reserve Class | Tonnage | Au | Cu | Ag | AuEq | Au | Cu | Ag | AuEq |
| (Mt) | (g/t) | (%) | (g/t) | (g/t) | (Moz) | (Mlb) | (Moz) | (Moz) | |
| Proven | 49 | 0.45 | 0.048 | 0.70 | 0.53 | 0.71 | 52 | 1.10 | 0.83 |
| Probable | 429 | 0.43 | 0.055 | 0.95 | 0.52 | 5.98 | 517 | 13.12 | 7.18 |
| Proven and Probable | 478 | 0.44 | 0.054 | 0.92 | 0.52 | 6.69 | 568 | 14.22 | 8.01 |
Note:
- This mineral reserve estimate has an effective date of December 31, 2025, and is based on the mineral resource estimate dated December 31, 2025, for Troilus Mining by AGP Mining Consultants Inc. The mineral reserve estimate was completed under the supervision of Gordon Zurowski, P.Eng. of AGP, who is a Qualified Person as defined under NI 43-101. Mineral Reserves are stated within the final pit designs based on a US
$2,100 /oz gold price, US$28.00 /oz silver price and US$4.00 /lb copper price. An exchange rate of 1.37 C$ to 1 US$ has been used to convert between currencies. An NSR cut-off of C$11.84 /t was used to define reserves. The mine production cost averaged C$4.62 /t mined, processing costs were C$8.55 /t ore, G&A was C$2.78 /t and sustaining capital of C$ 0.51 /t ore placed. - The metallurgical recoveries varied according to metal head grade and concentrate grades. The average recoveries by metal are
85.7% for gold,88.7% for copper and87.5% for silver. Metallurgical recoveries were determined as follows: - Gold Recovery: 188.21(Au)3-300.37(Au)2+174.63(Au)+51.502 (Gold head grades above 0.25 g/t were capped at a maximum recovery of
88% ). Below 0.25 g/t gold head grade the recovery was determined using the gold tail grade (Au Recovery = (head grade – tail grade) / head grade * 100). - Copper Recovery: -32688(Cu)4+17746(Cu)3-3692.7(Cu)2+366.41 (Copper head grades above
0.03% were capped at a maximum recovery of93% ). Below0.03% copper head grade the recovery was determined using the copper tail grade (Cu Recovery = (head grade – tail grade) / head grade * 100). - Silver Recovery: 188.21(Ag)3-300.37(Ag)2+174.63(Ag)+51.502 (Silver head grades above 0.25g/t were capped at a maximum recovery of
88% ). Below 0.25g/t silver head grade the recovery was determined using the silver tail grade (Ag Recovery = (head grade – tail grade) / head grade * 100). At the time of the reserve estimate the silver recovery had not been finalized. The gold recovery formulae was applied to estimate the silver recovery for reserve estimation purposes. - Equivalent grade calculations for 87 pit used recoveries of
86.4% ,88.7% and87.6% for gold, copper, and silver, respectively. Equivalent grade calculations for J pit used recoveries of85.5% ,88.8% and87.4% for gold, copper, and silver, respectively. Equivalent grade calculations for X22 pit used recoveries of85.6% ,88.5% and87.6% for gold, copper, and silver, respectively. Equivalent grade calculations for SW pit used recoveries of84.3% ,88.3% and87.2% for gold, copper, and silver, respectively. The formulas used to calculate equivalent values are as follows: 87 pit AuEq = Au + 1.3409*Cu +0.0135 *Ag, J pit AuEq = Au + 1.3565*Cu +0.0136 *Ag, SW pit AuEq = Au + 1.3681*Cu +0.0138 *Ag, X22 pit AuEq = Au + 1.3504*Cu +0.0136 *Ag.
Mineral Resource Estimate
The updated open-pit Mineral Resource estimate encompasses the 87, J, X22 and SW zones and has an effective date of December 31, 2025. Measured and Indicated Mineral Resources total 810.2 million tonnes grading 0.39 g/t gold,
Since completion of the 2024 Feasibility Study, Troilus has completed an additional 132 drill holes totalling 40,786 metres. This work included a site wide exploration program in 2024 that resulted in the discovery of the West Rim Zone, which is not included in the updated Mineral Resource estimate, as well as an approximately 11,000-metre infill drilling program in 2025 focused on improved definition of the SW Zone Phase 1 pit. As a result, the updated estimate includes 81.6 million tonnes in the Measured category at the SW Zone.
The updated Mineral Resource model also incorporates a number of refinements to better reflect the current geological interpretation and planned mining scale. Resource domains were remodelled using a lower 0.2 g/t AuEq threshold, compared with 0.3 g/t AuEq in the 2024 Feasibility Study, reflecting updated geological interpretation and metal price assumptions. The block size was increased to 5 m x 10 m x 10 m, from 5 m x 5 m x 5 m previously, to better align with the proposed mining equipment and production scale. Mineral Resources are now reported using an NSR cut-off of C
Table 7. Troilus Project, Mineral Resource Estimate
| Grade | Contained Metal | |||||||||
| Class | Tonnes | Au | Cu | Ag | AuEq | NSR | Au | Cu | Ag | AuEq |
| (Mt) | (g/t) | (%) | (g/t) | (g/t) | ($C/t) | (Moz) | (Mlb) | (Moz) | (Moz) | |
| Z87 | ||||||||||
| Indicated | 323.0 | 0.44 | 0.052 | 0.91 | 0.52 | 44.26 | 4.6 | 372.7 | 9.5 | 5.4 |
| Inferred | 140.0 | 0.36 | 0.045 | 0.76 | 0.43 | 36.05 | 1.6 | 140.2 | 3.4 | 1.9 |
| JZ | ||||||||||
| Indicated | 273.1 | 0.34 | 0.049 | 0.75 | 0.42 | 34.43 | 3.0 | 296.9 | 6.6 | 3.7 |
| Inferred | 37.8 | 0.26 | 0.041 | 0.57 | 0.32 | 25.75 | 0.3 | 34.0 | 0.7 | 0.4 |
| X22 | ||||||||||
| Indicated | 98.2 | 0.39 | 0.042 | 0.85 | 0.46 | 37.76 | 1.2 | 90.2 | 2.7 | 1.4 |
| Inferred | 3.4 | 0.35 | 0.032 | 0.54 | 0.40 | 32.49 | 0.0 | 2.4 | 0.1 | 0.0 |
| SW | ||||||||||
| Measured | 81.6 | 0.35 | 0.042 | 0.64 | 0.42 | 35.65 | 0.9 | 76.4 | 1.7 | 1.1 |
| Indicated | 34.2 | 0.34 | 0.043 | 0.86 | 0.41 | 33.47 | 0.4 | 32.3 | 1.0 | 0.5 |
| Inferred | 1.4 | 0.28 | 0.037 | 0.98 | 0.35 | 30.47 | 0.0 | 1.1 | 0.0 | 0.0 |
| TOTALS – ALL ZONES | ||||||||||
| Measured | 81.6 | 0.35 | 0.042 | 0.64 | 0.42 | 35.65 | 0.9 | 76.4 | 1.7 | 1.1 |
| Indicated | 728.6 | 0.39 | 0.049 | 0.84 | 0.47 | 39.19 | 9.2 | 792.1 | 19.6 | 11.0 |
| Meas. +Ind. | 810.2 | 0.39 | 0.049 | 0.82 | 0.46 | 38.84 | 10.2 | 868.5 | 21.3 | 12.1 |
| Inferred | 182.5 | 0.34 | 0.044 | 0.72 | 0.41 | 33.81 | 2.0 | 177.8 | 4.2 | 2.4 |
Notes:
- Reported Mineral Resources are inclusive of Mineral Reserves.
- Mineral Resources that are not Mineral Reserves do not have demonstrated economic viability.
- Summation errors may occur due to rounding.
- Open pit mineral resources are reported within constraining economic pit shells.
- Open pit cut-off 11.33 C$/t NSR.
- Metal prices for the NSR formulas are: US
$ 2,415 / oz Au; US$ 4.60 /lb Cu, and US$ 32.00 / oz Ag. - Exchange Rate used to convert from C$ to US$ is 1.37.
- Metal recoveries for the AuEQ formulas are:
- 87 Zone
85.9% for Au recovery,87.9% for Cu recovery and87.6% for Ag recovery - J Zone
84.5% for Au recovery,88.1% for Cu recovery and86.9% for Ag recovery - X22 Zone
85.6% for Au recovery,86.3% for Cu recovery and87.0% for Ag recovery - SW Zone
82.1% for Au recovery,87.1% for Cu recovery and87.1% for Ag recovery
- 87 Zone
- AuEq equivalents were calculated as follows:
- 87 Zone AuEq = Au grade + 1.3365 * Cu grade + 0.0136 * Ag grade
- J Zone AuEq = Au grade + 1.3618 * Cu grade + 0.0137 * Ag grade
- SW Zone AuEq = Au grade + 1.3856 * Cu grade + 0.0141 * Ag grade
- X22 Zone AuEq = Au grade + 1.3168 * Cu grade + 0.0136 * Ag grade
- Capping of grades varied between 0.70 g/t Au and 23.00 g/t Au; between 0.03 %Cu and 0.70 %Cu, and between 0.80 g/t Ag and 29.50 g/t Ag; determined on 5 m composite values.
- The density (excluding overburden and fill) varies between 2.64 g/cm3 and 2.93 g/cm3, depending on lithology.
The Mineral Reserves and Mineral Resources presented, were prepared in accordance with the CIM Standards and Definitions for Mineral Resources and Mineral Reserves (2014). The Qualified Persons who prepared the Mineral Reserve and Mineral Resource estimates are not aware of any known environmental, permitting, legal, title-related, taxation, socio-political, financial, or other relevant issues that could materially affect the mineral resources.
Mining and Processing Summary
The Project is designed as a conventional open-pit operation based on the 87, J, X22 and SW deposits, with the mine plan delivering approximately 478 million tonnes of mill feed grading 0.44 g/t Au,
The processing plant is designed for a 50,000 tpd nameplate throughput using a conventional flowsheet comprising two-stage crushing, two parallel HPGRs, ball milling, gravity concentration and flotation. The Technical Report assumes throughput may increase to as much as 52,000 tpd from Year 3 onward as operating availability improves and the operation matures. Metallurgical testwork supports average recoveries during pre-production and active mining of approximately
The Project benefits from a cyanide-free process flowsheet and non-acid-generating waste rock, supporting a simplified environmental management approach.
Life-of-mine payable production totals approximately 5.63 million ounces of gold, 472 million pounds of copper and 10.88 million ounces of silver, with the annual production profile shown in Figure 2.
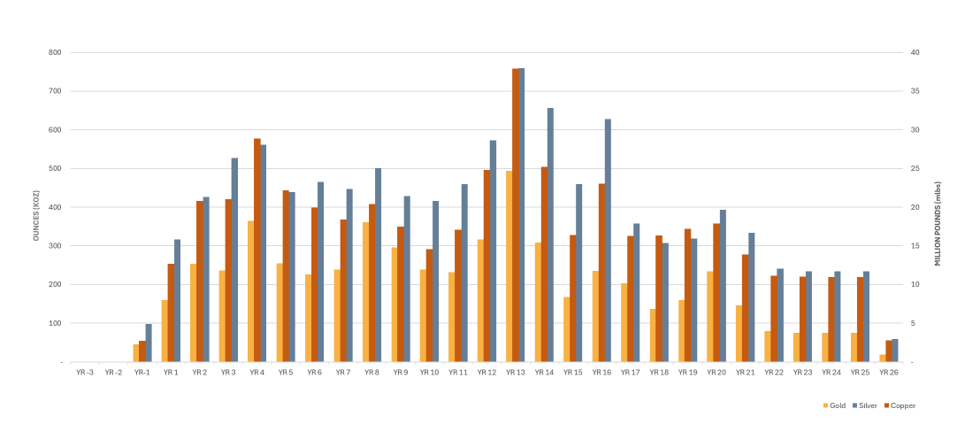
Figure 2. Troilus Production Profile for Gold, Copper and Silver
Site Infrastructure Summary
The Troilus Project benefits from substantial existing infrastructure associated with the former mining operation, including year-round road access, a 137 km Hydro-Québec transmission line, accommodation and administration facilities, maintenance infrastructure and existing water-management facilities, a number of which will be repurposed as part of the future operation. The Project development plan supplements these existing assets with new processing, mining and site infrastructure required for the planned 50,000 tpd operation.
In June 2026, Troilus secured a 70 MW hydroelectric power allocation from Hydro-Québec and Québec’s Ministry of Economy, Innovation and Energy, securing a major component of the Project’s anticipated power supply and providing long-term access to competitively priced renewable power. The Technical Report assumes an electricity price of approximately US
A site-wide water management plan and water balance model were advanced through Basic Engineering to support efficient mine operations and long-term environmental performance. The Project also benefits from the ability to reuse and expand the existing tailings storage facility (“TSF”), limiting additional surface disturbance. The TSF is expected to accommodate approximately the first 12 years of mine production, after which tailings are planned to be progressively deposited in the mined-out SW, 87 and J pits. Waste rock will also be incorporated along the TSF containment dyke to enhance stability and safety while limiting additional surface disturbance. The combined TSF and in-pit storage capacity is expected to be sufficient for the life-of-mine Reserve.
Project Location and Access
The Troilus Project is located in central Québec, Canada, approximately 170 km north of Chibougamau, and is accessible year-round by road via Highway 167, the Route du Nord and the Troilus Mine Road. The drive from Chibougamau to site is approximately two hours.
The Project benefits from its proximity to established regional communities and mining services. Mistissini, a Cree community, is located approximately 90 km southeast of the site, while Chibougamau is a well-established mining town that provides access to supplies, fuel, services and an experienced mining workforce. The Project is also connected to Québec’s hydroelectric grid through an existing 137 km, 161 kV transmission line.
Troilus is a past-producing mine site, having produced more than 2 million ounces of gold and approximately 70,000 tonnes of copper between 1996 and 2010, before operations ceased. This operating history, together with existing infrastructure and established regional access, provides a meaningful brownfield advantage as the Project advances toward redevelopment.
Exploration Potential
Beyond the 87, J, X22 and SW deposits that underpin the current mine plan, Troilus controls approximately 435 km2 containing numerous near-mine and regional exploration targets, including Allongé, Cressida, Testard, Freegold-Bullseye, Pallador, West Rim and Bear Lake. Recent drilling continues to demonstrate opportunities for resource growth and new discoveries across the broader property, providing multiple avenues to further unlock the potential of this highly prospective district.
Project Execution and Next Steps
With Basic Engineering complete, Troilus continued to advance through Detailed Engineering and execution planning, supporting the Project’s transition toward development. The Project is being advanced under an integrated EPCM delivery model, with BBA leading engineering and procurement, EBC Inc. providing construction management services, and Troilus maintaining overall ownership and oversight of Project execution.
Detailed Engineering, procurement and construction planning are progressing in parallel to support an efficient path toward construction. More than 60 procurement packages have been issued or are under evaluation, with long-lead equipment procurement already underway. The recent selection of Metso Corporation for the first phase of major process equipment has enabled early supplier integration into Detailed Engineering, advancing equipment interfaces, plant layout, 3D modelling and construction sequencing.
The execution strategy contemplates multiple concurrent construction work fronts, with engineering and procurement integrated directly into the construction schedule. Commissioning and operational-readiness planning are also being advanced alongside engineering to support an efficient transition from construction into operations.
In parallel, Troilus continues to advance the Project through the federal and provincial permitting processes and project financing, while progressing site-readiness activities and the remaining engineering and procurement required to support a construction decision. Subject to required approvals and financing, construction is anticipated to begin in 2027, with first ore targeted for September 2029 and commercial production in March 2030.
The Company’s near-term focus is therefore firmly on execution: advancing Detailed Engineering, securing critical equipment, progressing permitting and financing, and preparing the Project for construction.
Technical Report
The Technical Report entitled “Technical Report: Troilus Gold – Copper Project, Québec Canada” was prepared in accordance with National Instrument 43-101 – Standards of Disclosure for Mineral Projects (“NI 43-101”) for Troilus with contributions by BBA Inc. (“BBA”), WSP Canada Inc. (“WSP”) and AGP Mining Consultants Inc. (“AGP”), with a report date of September 8, 2026. The Technical Report can be found on the Company’s profile on SEDAR+ at www.sedarplus.ca.
The Technical Report is intended to be read as a whole and will provide additional detail regarding the assumptions, qualifications, methodologies, risks and other technical information supporting the results presented herein, including the Mineral Resource and Mineral Reserve estimates, mine plan, processing assumptions, capital and operating costs and economic analysis.
Qualified Persons
The scientific and technical information in this news release relating to the Technical Report has been reviewed and approved by the applicable authors of the Technical Report listed in Table 8, including representatives of BBA Inc., WSP Canada Inc. and AGP Mining Consultants Inc., each of whom is a Qualified Person as defined under NI 43-101 independent of the Company.
Table 8. 2026 Technical Report Qualified Persons
| QP Name/Title | Company | Main Area of Responsibility |
| Colin Hardie, P.Eng.; Senior Consultant | BBA | Capital and Operating Costs, Economic Analysis, Environment, Marketing Studies and Contracts |
| Ricardo Esteban, P.Eng.; Process Engineer | BBA | Mineral Processing |
| Paul Daigle, P.Geo; Principal Resource Geologist | AGP | Geology, Data Verification, Mineral Resources |
| Gordon Zurowski, P.Eng.; Principal Mining Engineer | AGP | Mine Planning and Mineral Reserves |
| Carl Pednault, P.Eng.; Senior Tailings Engineer | WSP | Tailings Management Facility |
| Mathieu Gosselin, P.Eng.; Senior Geological Engineer | WSP | Surface Water and Hydrogeology |
| Patrick Couture, P.Eng.; Senior Process Engineer | WSP | Water Treatment |
| Marc Rougier, P.Eng.; Senior Principal Geological Engineer | WSP | Open Pit Slope Design (Rock Mechanics) |
The technical and scientific information in this press release has been reviewed and approved by Denis Rivard, P.Eng., EVP Projects, who is a Qualified Person as defined by NI 43-101. Mr. Rivard is an employee of Troilus and is not independent of the Company under NI 43-101.
AuEq Disclosure
The formulas used to calculate equivalent values for resources are as follows, for 87 Pit AuEq = Au + 1.3365*Cu +0.0136 *Ag, for J Pit AuEq = Au + 1.3618*Cu +0.0137 *Ag, for SW Pit AuEq = Au + 1.3856*Cu +0.01141 *Ag, for X22 Pit AuEq = Au + 1.3168*Cu +0.0136 *Ag. AuEq was calculated using metal prices of
Non-GAAP Financial Measures
Certain financial measures referred to in this press release are not measures recognized under IFRS and are referred to as non-GAAP financial measures or ratios. These measures have no standardized meaning under IFRS and may not be comparable to similar measures presented by other companies. These measures are intended to provide additional information and should not be considered in isolation or as a substitute for measures prepared in accordance with IFRS.
Cash cost consists of mining, processing, tailings management, General and Administrative, transportation, refining and smelting, and royalty costs, net of credits from payable copper and silver. Cash cost per ounce is calculated as cash cost divided by payable gold ounces.
All-in sustaining costs consist of cash costs, as defined above, plus sustaining capital expenditures and closure and reclamation costs. All-in sustaining cost per ounce is calculated as all-in sustaining cost divided by payable gold ounces. As the Project is not in production, there are no historical non-GAAP financial measures nor historical comparable measures under IFRS, and therefore the foregoing prospective non-GAAP financial measures or ratio presented may not be reconciled to the nearest comparable measure under IFRS.
About Troilus Mining Corp.
Troilus Mining Corp. is a Canadian development-stage mining company focused on the systematic advancement of the former gold and copper Troilus Mine towards production. Troilus is located in the tier-one mining jurisdiction of Quebec, Canada, where it holds a large land position of 435 km² in the Frôtet-Evans Greenstone Belt. The Technical Report outlines a large-scale, approximately 26-year, 50ktpd open-pit mining operation, positioning it as a cornerstone project in North America.
For more information:
Caroline Arsenault
VP Corporate Communications
+1 (647) 276-0050
info@troilusmining.com
Cautionary Note Regarding Forward-Looking Statements and Information
This press release contains “forward-looking statements” within the meaning of applicable Canadian securities legislation. Forward-looking statements include, but are not limited to, statements regarding the Technical Report and the results, assumptions and conclusions contained therein, including various Project economics, financial and operational parameters such as the timing and amount of future production from the Project, expectations with respect to IRR, NPV, payback, capital and operating costs, anticipated mining and processing methods, proposed infrastructure, anticipated mine life, expected recoveries and grades, and the realization of Mineral Resource and Mineral Reserve estimates; the potential for future resource and reserve growth and mine-plan optimization; the timing and results of ongoing and future exploration and drilling programs; the advancement of Detailed Engineering, procurement, construction planning and operational readiness; the timing and receipt of required federal and provincial permits and approvals; the Company’s project financing strategy and availability of financing for Project development; the timing of a potential construction decision and future development of the Project; and the potential for the Troilus Project to become a significant gold-copper producer in North America.
Generally, forward-looking statements can be identified by the use of forward-looking terminology such as “plans”, “expects” or “does not expect”, “is expected”, “budget”, “scheduled”, “estimates”, “forecasts”, “intends”, “continue”, “anticipates” or “does not anticipate”, or “believes”, or variations of such words and phrases or statements that certain actions, events or results “may”, “could”, “would”, “will”, “might” or “will be taken”, “occur” or “be achieved”. Forward-looking statements are made based upon certain assumptions and other important facts that, if untrue, could cause the actual results, performances or achievements of Troilus to be materially different from future results, performances or achievements expressed or implied by such statements. Such statements and information are based on numerous assumptions regarding present and future business strategies and the environment in which Troilus will operate in the future. Certain important factors that could cause actual results, performances or achievements to differ materially from those in the forward-looking statements include, amongst others, currency fluctuations, the global economic climate, dilution, share price volatility and competition. Forward-looking statements are subject to known and unknown risks, uncertainties and other important factors that may cause the actual results, level of activity, performance or achievements of Troilus to be materially different from those expressed or implied by such forward-looking statements, including but not limited to: there being no assurance that the exploration program or programs of the Company will result in expanded mineral resources; risks and uncertainties inherent to mineral resource and reserve estimates; the high degree of uncertainties inherent to feasibility studies and other mining and economic studies which are based to a significant extent on various assumptions; variations in gold prices and other metals, exchange rate fluctuations; variations in cost of supplies and labour; receipt of necessary approvals; availability of financing for project development; uncertainties and risks with respect to developing mining projects; general business, economic, competitive, political and social uncertainties; future gold and other metal prices; accidents, labour disputes and shortages; environmental and other risks of the mining industry, including without limitation, risks and uncertainties discussed in the Company’s latest Annual Information Form, its technical reports and other continuous disclosure documents of the Company available under the Company’s profile at www.sedarplus.ca. Although Troilus has attempted to identify important factors that could cause actual results to differ materially from those contained in forward-looking statements, there may be other factors that cause results not to be as anticipated, estimated or intended. There can be no assurance that such statements will prove to be accurate, as actual results and future events could differ materially from those anticipated in such statements. Accordingly, readers should not place undue reliance on forward-looking statements. Troilus does not undertake to update any forward-looking statements, except in accordance with applicable securities laws.
Photos accompanying this announcement is available at:
https://www.globenewswire.com/NewsRoom/AttachmentNg/cd8056ca-fa9e-4dc7-a031-2bf6e3a63fbd
https://www.globenewswire.com/NewsRoom/AttachmentNg/de20e1df-581f-4d53-b585-6a68eec65d7b

FAQ
AI-generated questions and answers. How Rhea-AI works. Not financial advice.
What metal price assumptions underpin the updated Troilus Project economics?
The base case uses long-term prices of US$3,600/oz gold, US$5.00/lb copper and US$50.00/oz silver. At US$4,500/oz gold, the company reports after-tax NPV(5%) increasing to approximately US$4.7 billion, IRR to 28%, and payback shortening to about 3.0 years.
How does the updated Technical Report change the reserve base and mine plan?
The mine plan is based on 478 million tonnes of Proven and Probable Reserves grading 0.44 g/t gold, 0.05% copper and 0.92 g/t silver, a reserve tonnage increase of about 26% versus the 2024 Feasibility Study. The 26-year life includes roughly one year of pre-production, 21 years of active mining and a stockpile processing phase.
What are the planned production rates and throughput for the Troilus Project?
The operation is designed as a conventional open pit with a 50,000 tpd nameplate processing rate and annual mill throughput of 18.3 million tonnes. During the 21-year active mining period, average annual payable production is approximately 251,000 oz gold, 20.1M lb copper and 466,000 oz silver.
What processing flowsheet and key plant features are included in the updated design?
The flowsheet uses conventional crushing, two parallel 35,000 tpd HPGR units, ball milling, gravity concentration and flotation to produce a gold-rich copper concentrate and gold-silver doré. The gold room has been moved into initial construction, enabling doré production from start-up.
How were capital and operating cost estimates developed and de-risked?
Capital and operating costs were refined through Basic Engineering, totaling about 95,000 engineering hours. Roughly 90% of pricing inputs were validated with current market quotations, including firm pricing for key equipment, and the estimates meet AACE Class 3 (+15%/‑10%) accuracy. Operating costs use detailed equipment, productivity, reagent, power and Québec labour benchmarks.