
DICK'S Sporting Goods, Inc. Reports Second Quarter Results
DICK'S Sporting Goods (NYSE: DKS) reported second quarter 2026 consolidated net sales of $5.59 billion, up 53.2% year over year, reflecting inclusion of the acquired Foot Locker business.
Sentiment and the balance of points
Rhea-AI Sentiment reads the wording of the document, how positive or negative its language is on a 1 to 5 scale. The balance of points shown with the takes weighs what the document actually discloses, so the two can disagree, for example when a trial that missed its main goal is described in upbeat language.
Rhea-AI Summary
DICK'S Sporting Goods (NYSE: DKS) reported second quarter 2026 consolidated net sales of $5.59 billion, up 53.2% year over year, reflecting inclusion of the acquired Foot Locker business. GAAP earnings per diluted share were $3.50 versus $4.71 a year ago; non-GAAP EPS was $3.53 versus $4.38, with current results diluted by 9.6 million shares issued for the Foot Locker acquisition.
The DICK'S Business delivered 4.9% comparable sales growth, while proforma comparable sales for the Foot Locker Business declined 3.6%, contributing to a Foot Locker segment loss of $31.9 million. Consolidated operating margin fell to 7.9% from 12.4%. For full year 2026, the company now expects consolidated net sales of $21.9–$22.2 billion and GAAP EPS of $10.94–$11.94, and lowered operating income outlooks for both businesses while maintaining DICK'S comparable sales growth guidance of 2.5%–4.0% and projecting Foot Locker proforma comps between -2.0% and 0.0%.
Positive
- Q2 2026 net sales $5.59B, up 53.2% year over year including Foot Locker
- DICK'S Business Q2 comps +4.9%, with segment profit rising to $485.2M
- Consolidated proforma comparable sales grew 2.1% in Q2 2026
- Full-year 2026 net sales guidance set at $21.9B–$22.2B
- DICK'S segment 2026 profit outlook of $1.54B–$1.60B, margin 10.6%–10.9%
- $3.0B remaining under share repurchase authorizations; $1.25 per-share quarterly dividend in 2026
Negative
- Q2 2026 GAAP EPS $3.50, down 26% from $4.71 in prior-year quarter
- Q2 operating margin 7.9%, down 451 basis points year over year
- Foot Locker Q2 segment loss of $31.9M and proforma comps down 3.6%
- Full-year 2026 Foot Locker outlook segment loss of $40M–$80M, margin -1.1% to -0.5%
- Inventories $5.57B, up 63% year over year including Foot Locker
- Full-year 2026 operating income outlook lowered for both DICK'S and Foot Locker businesses
News Explained
At August 1, the combined company reported its cash, inventory, and long-term debt and lease obligations.
The second-quarter report covers the combined company after the Foot Locker acquisition.
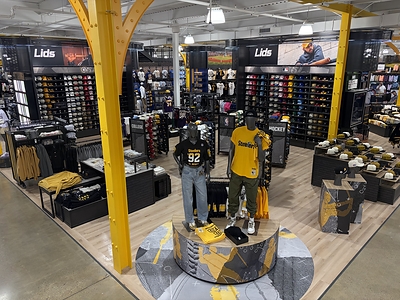
The acquired operations had become a substantial separately reported footprint: the Foot Locker Business had 2,478 stores as of
The next defined measurement milestone is the fourth quarter of fiscal 2026, when Foot Locker will enter quarterly comparable-sales calculations after its stores reach their 14th full month following the acquisition; until then, the company uses pro forma comparisons.
Details
Market move: DKS -30.68% in the Aug 25 session. Q2 2026 earnings report
On Aug 25, the day this news came out, DKS closed 30.68% below the previous close. Argus tracked a trough of -27.8% from its starting point during tracking. Our momentum scanner recorded 360 alerts for this stock that day. Relative volume reached 1659.6x the daily average during tracking.
Data tracked by StockTitan Argus for the Aug 25 session.
Key Figures
- DICK'S comp sales
- 4.9%
- Second quarter 2026
- Foot Locker proforma comps
- -3.6%
- Second quarter 2026
- GAAP EPS
- $3.50 per diluted share
- Q2 2026 vs. $4.71 prior-year quarter
- Non-GAAP EPS
- $3.53 per diluted share
- Q2 2026 vs. $4.38 prior-year quarter
- Consolidated net sales
- $5.587 billion
- Q2 2026 vs. $3.647 billion prior-year quarter
- Operating margin
- 7.9%
- GAAP Q2 2026 vs. 12.4% prior-year quarter
- DICK'S comparable sales outlook
- 2.5% to 4.0% growth
- Full-year 2026 outlook
- Foot Locker comparable sales outlook
- -2.0% to 0.0%
- Full-year 2026 proforma outlook
Previous Earnings Reports
-
Raised 2026 outlook while DICK'S comps grew and Foot Locker returned to profitability.
-
Reported record-setting DICK'S sales, issued guidance, and completed the Foot Locker acquisition.
-
Raised DICK'S outlook after 5.7% comps and completed the Foot Locker acquisition.
-
Raised 2025 guidance despite strong results and announced pending Foot Locker acquisition.
-
Delivered record sales and 4.5% comps while announcing Foot Locker acquisition terms.
24h Move is the share-price change in the day after each event; other market factors may also have contributed.
Key Terms
non-gaap financial
proforma comparable sales financial
operating margin financial
dilutive impact financial
AI-generated analysis. How Rhea-AI works. Not financial advice.




– Delivers
– 2026 Outlook Revised Due to Challenging Athletic Footwear and Apparel Marketplace –
Reported earnings per diluted share of
$3.50 $3.53 $4.71 $4.38 DICK'S Business delivered
4.9% comp sales growth, driven by broad-based growth across categories, including strong results from the 2026 FIFA World Cup, and growth in average ticket and transactionsProforma comps for the Foot Locker Business (C) declined
3.6% , impacted by challenging conditions in the athletic footwear marketplaceRevises full year 2026 outlook
- Maintains DICK'S Business comparable sales outlook of
2.5% to4.0% growth - Lowers Foot Locker Business proforma comparable sales outlook to a range of negative
2.0% to0.0% - Lowers operating income outlook for both DICK'S and Foot Locker Businesses
- Maintains DICK'S Business comparable sales outlook of
"The DICK'S Business delivered a strong second quarter with broad-based growth across categories. As the quarter progressed, conditions across portions of the athletic footwear and apparel marketplace became increasingly promotional, and we took action to remain competitively priced to protect and grow our leadership position. This environment had a more significant impact on the Foot Locker Business given its greater exposure to legacy footwear silhouettes and greater dependence on footwear launch and retro product. Not only were there fewer launches in the second quarter, but those launches performed below both industry and our expectations. As a result, we are taking a more cautious view of the balance of the year. While these near-term dynamics have led us to revise our expectations for 2026, our confidence in the long-term opportunities ahead for both DICK'S and Foot Locker remains unchanged." |
Ed Stack, Executive Chairman |
"We're proud of our second quarter performance in the DICK'S Business, where we delivered comp sales growth of |
Lauren Hobart, President and Chief Executive Officer |
(A) | Results described by management for the "DICK'S Business" represent the existing DICK'S Sporting Goods operations, which includes the DICK'S Sporting Goods, Golf Galaxy, Going Going Gone! and Public Lands banners, as well as GameChanger. The results for the "Foot Locker Business" refer to our acquired operations, including the Foot Locker, Kids Foot Locker, Champs Sports, WSS and atmos banners. Profitability for the DICK'S and Foot Locker Businesses represents segment profit, or operating income, for a respective segment. |
(B) | For additional information, see the section of this release titled "Non-GAAP Financial Measures" and GAAP to non-GAAP reconciliations included in tables later in this release under the heading "GAAP to Non-GAAP Reconciliations." |
(C) | Comparable sales for the Foot Locker Business are represented on a proforma basis and are calculated as if Foot Locker had been acquired at the beginning of the periods presented. Foot Locker will not be included in quarterly comparable sales until the fourth quarter of fiscal 2026 and full year comparable sales in fiscal 2027. |
DICK'S SPORTING GOODS, INC. AND SUBSIDIARIES SUPPLEMENTAL FINANCIAL INFORMATION - UNAUDITED | |||||||
Information below represents consolidated supplemental financial results for the 13 and 26 weeks ended August 1, 2026, which includes the DICK'S and Foot Locker Businesses. Prior period results reflect the DICK'S Business on a stand-alone basis. | |||||||
Second Quarter Consolidated Operating Results (in millions, except percentage and per share data) | 13 Weeks Ended | Change (9) | |||||
August 1, 2026 | August 2, 2025 | ||||||
GAAP | |||||||
Net sales | $ | 5,587 | $ | 3,647 | $ | 1,940 | 53.2 % |
Operating income (% of net sales) (1) | 7.9 % | 12.4 % | (451) bps | ||||
Effective tax rate | 28.0 % | 25.2 % | 286 bps | ||||
Net income | $ | 315 | $ | 381 | $ | (66) | (17) % |
Weighted average diluted shares outstanding (2) | 90 | 81 | 9 | 11 % | |||
Earnings per diluted share (2) | $ | 3.50 | $ | 4.71 | $ | (1.21) | (26) % |
Non-GAAP (3) | |||||||
Operating income (% of net sales) (1) | 8.1 % | 13.0 % | (491) bps | ||||
Effective tax rate | 28.1 % | 24.9 % | 316 bps | ||||
Net income | $ | 319 | $ | 355 | $ | (36) | (10) % |
Earnings per diluted share (2) | $ | 3.53 | $ | 4.38 | $ | (0.85) | (19) % |
Year-to-Date Consolidated Operating Results (in millions, except percentage and per share data) | 26 Weeks Ended | Change (9) | |||||
August 1, 2026 | August 2, 2025 | ||||||
GAAP | |||||||
Net sales | $ | 10,751 | $ | 6,821 | $ | 3,930 | 57.6 % |
Operating income (% of net sales) (1) | 8.3 % | 12.0 % | (371) bps | ||||
Effective tax rate | 28.2 % | 24.7 % | 349 bps | ||||
Net income | $ | 635 | $ | 646 | $ | (10) | (2) % |
Weighted average diluted shares outstanding (2) | 90 | 81 | 9 | 11 % | |||
Earnings per diluted share (2) | $ | 7.04 | $ | 7.95 | $ | (0.91) | (11) % |
Non-GAAP (3) | |||||||
Operating income (% of net sales) (1) | 7.7 % | 12.2 % | (451) bps | ||||
Effective tax rate | 28.4 % | 24.5 % | 387 bps | ||||
Net income | $ | 581 | $ | 629 | $ | (49) | (8) % |
Earnings per diluted share (2) | $ | 6.43 | $ | 7.75 | $ | (1.32) | (17) % |
Balance Sheet (in millions) | As of August 1, 2026 | As of August 2, 2025 | $ Change (9) | % Change (9) | |||
Cash and cash equivalents | $ | 914 | $ | 1,231 | $ | (317) | (26) % |
Inventories, net (4) | $ | 5,565 | $ | 3,404 | $ | 2,161 | 63 % |
Long-term debt and financing lease obligations (5) | $ | 1,906 | $ | 1,485 | $ | 422 | 28 % |
Capital Allocation (in millions) | 26 Weeks Ended | $ Change (9) | % Change (9) | ||||
August 1, 2026 | August 2, 2025 | ||||||
Share repurchases (6) | $ | 141 | $ | 299 | $ | (157) | (53) % |
Dividends paid (7) | $ | 225 | $ | 196 | $ | 29 | 15 % |
Gross capital expenditures (8) | $ | 743 | $ | 526 | $ | 217 | 41 % |
Net capital expenditures (3) (8) | $ | 614 | $ | 455 | $ | 159 | 35 % |
Notes
(1) | Also referred to by management as operating margin. |
(2) | Current year weighted average diluted shares outstanding and earnings per diluted share include the dilutive effect of the 9.6 million shares issued in connection with the Foot Locker acquisition. |
(3) | For additional information, see the section of this release titled "Non-GAAP Financial Measures" and GAAP to non-GAAP reconciliations included in tables later in this release under the heading "GAAP to Non-GAAP Reconciliations." |
(4) | Inventories, net as of August 1, 2026 includes |
(5) | Current year balance includes |
(6) | During the 26 weeks ended August 1, 2026, the Company repurchased 0.7 million shares of its common stock under its previously announced share repurchase program at an average price of |
(7) | The Company declared and paid quarterly dividends of |
(8) | During the 26 weeks ended August 1, 2026, gross and net capital expenditures totaled |
(9) | Column may not recalculate due to rounding. |
DICK'S SPORTING GOODS, INC. AND SUBSIDIARIES SUPPLEMENTAL FINANCIAL INFORMATION - UNAUDITED (Continued) | |||||||
Information below represents supplemental financial results for the DICK'S and Foot Locker Businesses for the periods presented. Prior period results reflect the DICK'S Business on a stand-alone basis, with the exception of proforma comparable sales information. Refer to Proforma Comparable Sales section for additional information. | |||||||
13 Weeks Ended | 26 Weeks Ended | ||||||
(in thousands) | August 1, 2026 | August 2, 2025 | August 1, 2026 | August 2, 2025 | |||
Net sales | |||||||
DICK'S Sporting Goods | $ 3,849,887 | $ 3,646,616 | $ 7,227,327 | $ 6,821,293 | |||
Foot Locker | 1,736,928 | — | 3,523,992 | — | |||
Total net sales | $ 5,586,815 | $ 3,646,616 | $ 10,751,319 | $ 6,821,293 | |||
Gross profit | |||||||
DICK'S Sporting Goods | $ 1,457,029 | $ 1,351,272 | $ 2,684,350 | $ 2,516,358 | |||
Foot Locker | 445,769 | — | 944,435 | — | |||
Corporate and other income (expense) (1) | 40,473 | — | (2,252) | — | |||
Total gross profit | $ 1,943,271 | $ 1,351,272 | $ 3,626,533 | $ 2,516,358 | |||
Segment profit | |||||||
DICK'S Sporting Goods | $ 485,204 | $ 474,952 | $ 846,179 | $ 835,361 | |||
Foot Locker | (31,876) | — | (14,414) | — | |||
Reconciliation to pre-tax income | |||||||
Corporate and other expense (income) (2) | 12,572 | 22,767 | (59,641) | 17,059 | |||
Interest expense | 17,846 | 16,118 | 35,387 | 28,256 | |||
Other (income) expense | (15,504) | (73,749) | (28,670) | (67,493) | |||
Pre-tax income | $ 438,414 | $ 509,816 | $ 884,689 | $ 857,539 | |||
Proforma Comparable Sales | 13 Weeks Ended | 26 Weeks Ended | |||||
August 1, 2026 | August 2, 2025 | August 1, 2026 | August 2, 2025 | ||||
DICK'S Sporting Goods | 4.9 % | 5.0 % | 5.4 % | 4.7 % | |||
Proforma Foot Locker (3) (4) | (3.6) % | (2.2) % | (1.6) % | (2.5) % | |||
Proforma consolidated comparable sales (3) | 2.1 % | 2.5 % | 3.0 % | 2.1 % | |||
(1) | Corporate and other income (expense) within gross profit includes IEEPA tariff refunds received attributable to tariff costs incurred in the prior year and charges to write down and liquidate inventory from the Company's review of the Foot Locker Business. |
(2) | Corporate and other expense (income) includes IEEPA tariff refunds received attributable to tariff costs incurred in the prior year and income from litigation and other settlements, offset by Foot Locker acquisition-related costs, charges incurred to redesign the store operating model for the DICK'S Business and changes in the fair value of employee deferred compensation plan investments held in rabbi trusts. |
(3) | Proforma comparable sales are calculated as if Foot Locker had been acquired at the beginning of the periods presented. Sales have been adjusted to conform to the Company's method of reporting comparable sales. Comparable sales are calculated on a constant currency basis, which translates the current year's results using the prior year periods' exchange rates. |
(4) | Includes Foot Locker International proforma comparable sales decreases of ( |
Full Year 2026 Outlook
The Company's Full Year Outlook for 2026 is presented below.
Consolidated Outlook
Metric | Consolidated Full Year 2026 Outlook |
Net sales |
|
Operating income |
|
Earnings per diluted share |
|
Capital expenditures |
|
(1) | Refer to the section of this release titled "Non-GAAP Financial Measures" and GAAP to non-GAAP reconciliations included in tables later in this release under the heading "GAAP to Non-GAAP Reconciliations." |
(2) | Effective tax rate includes the unfavorable mix of our earnings in foreign jurisdictions and the effect of purchase accounting adjustments, particularly in |
Segment Outlook
The Company is providing the following segment outlook for the DICK'S and Foot Locker Businesses to provide visibility into segment-level performance that is included in the consolidated outlook above. The information below does not include corporate and other activities, which for fiscal 2026, primarily include income received as part of tariff refunds, litigation and other settlements, partially offset by Foot Locker acquisition-related costs and charges incurred to redesign the store operating model for the DICK'S Business.
Metric | Full Year 2026 Outlook | |
DICK'S Business | Foot Locker Business | |
Net sales |
|
|
Comparable sales (1) |
|
|
Segment profit (loss) (2) |
|
|
Segment profit (loss) (2) (% of net sales) |
|
|
Capital expenditures |
|
|
(1) | Comparable sales outlook for the Foot Locker Business is on a proforma basis, as Foot Locker will be included in the quarterly comparable store calculation beginning in the fourth quarter of fiscal 2026, which is when these stores will commence their 14th full month of operations following the date of acquisition. |
(2) | Segment profit represents operating income for a respective segment. Corporate and other activities, which represent costs or income not specifically related to the recurring operations of our segments, are not included in these results as they are not used by the Company to evaluate segment performance. |
Store Count and Square Footage
As of August 1, 2026, the Company operated 3,104 store locations across the DICK'S and Foot Locker Businesses. The following tables summarize store activity for fiscal 2026:
DICK'S Business | Beginning Stores | New Stores | Closed Stores | Relocated / Converted (6) | Ending Stores | Gross Square Footage (7) (in millions) | |
Beginning | Ending | ||||||
DICK'S | 644 | — | (2) | (12) | 630 | 34.4 | 33.5 |
DICK'S Field House | 42 | 4 | — | 6 | 52 | 2.4 | 2.9 |
DICK'S House of Sport | 35 | — | — | 6 | 41 | 3.8 | 4.5 |
Total DICK'S | 721 | 4 | (2) | — | 723 | 40.6 | 41.0 |
Other Specialty Concepts | |||||||
Golf Galaxy (1) | 113 | 1 | — | — | 114 | 2.5 | 2.5 |
Going Going Gone! | 51 | 2 | (1) | — | 52 | 2.3 | 2.4 |
Public Lands | 3 | — | — | — | 3 | 0.1 | 0.1 |
Total Other Specialty Concepts | 167 | 3 | (1) | — | 169 | 4.9 | 5.0 |
Total DICK'S Business | 888 | 7 | (3) | — | 892 | 45.5 | 46.0 |
Foot Locker Business | Beginning Stores | New Stores | Closed Stores (5) | Relocated / Converted (5) | Ending Stores | Gross Square Footage (7) (in millions) | |
Beginning | Ending | ||||||
Foot Locker North America | 734 | 1 | (20) | — | 715 | 4.4 | 4.3 |
Champs Sports | 371 | 1 | (8) | — | 364 | 2.2 | 2.1 |
Kids Foot Locker | 362 | 3 | (12) | — | 353 | 1.3 | 1.2 |
WSS | 143 | — | (44) | — | 99 | 1.8 | 1.3 |
1,610 | 5 | (84) | — | 1,531 | 9.7 | 8.9 | |
Foot Locker Europe (3) | 573 | 2 | (16) | — | 559 | 2.3 | 2.3 |
Foot Locker Asia Pacific | 94 | — | (2) | — | 92 | 0.4 | 0.4 |
atmos | 30 | 2 | (2) | — | 30 | — | — |
International | 697 | 4 | (20) | — | 681 | 2.8 | 2.7 |
Total Owned Stores | 2,307 | 9 | (104) | — | 2,212 | 12.4 | 11.6 |
Licensed stores (4) | 254 | 18 | (6) | — | 266 | 1.1 | 1.2 |
Total Foot Locker Business | 2,561 | 27 | (110) | — | 2,478 | 13.5 | 12.8 |
(1) | As of August 1, 2026, includes 37 Golf Galaxy Performance Centers, with four new openings during fiscal 2026, three of which were conversions of prior Golf Galaxy store locations. |
(2) | Represents store locations in |
(3) | Represents Foot Locker store locations in |
(4) | Reflects licensed stores operating in the |
(5) | Store closures for the Foot Locker Business during fiscal 2026 includes 67 Foot Locker stores identified as part of the Company's review of unproductive assets. Additionally, the Foot Locker Business relocated or remodeled 41 stores during the current year period consisting of 13 Foot Locker, three Champs Sports, seven Kids Foot Locker and six WSS store locations in |
(6) | Reflects stores converted between concept or prototype through store relocations or remodels as part of the Company's strategy to reposition its store portfolio. In addition to stores that converted between concepts, the Company relocated or remodeled four stores during the current year period, consisting of three Golf Galaxy and one DICK'S House of Sport store locations. |
(7) | Columns may not recalculate due to rounding. |
Quarterly Dividend
On August 24, 2026, the Company's Board of Directors authorized and declared a quarterly dividend in the amount of
Acquisition of Foot Locker
On September 8, 2025, the Company acquired all of the issued and outstanding shares of Foot Locker, Inc. ("Foot Locker"), a leading footwear and apparel retailer, pursuant to the definitive merger agreement executed on May 15, 2025. Total consideration exchanged for the acquisition was
As previously announced, the Company has initiated a review of unproductive assets, which includes optimizing inventory, closing underperforming stores, and right-sizing assets that do not align with our go-forward vision for the Foot Locker Business. The Company incurred
Tariff Refunds
As a result of a recent order by
Non-GAAP Financial Measures
In addition to reporting the Company's financial results for the second quarter in accordance with generally accepted accounting principles ("GAAP"), the Company also reports certain non-GAAP financial measures. These non-GAAP financial measures include non-GAAP gross margin, non-GAAP operating income, non-GAAP operating margin, non-GAAP effective tax rate, non-GAAP net income, non-GAAP earnings per diluted share and net capital expenditures. Management believes these non-GAAP financial measures provide investors with meaningful supplemental information to assist in evaluating the Company's ongoing operations and comparing results across reporting periods.
Management further believes that excluding non‑cash changes in the fair value of deferred compensation plan investments – which fluctuate with market performance and are offset within other income – enhances investors' understanding of underlying trends in selling, general and administrative expenses. The Company also uses these non‑GAAP financial measures internally for budgeting, forecasting and assessing operating performance. These non‑GAAP financial measures should be considered in addition to, and not as a substitute for, the Company's GAAP financial results. Because the methods used by the Company to calculate its non‑GAAP measures may differ from those used by other companies, the non‑GAAP measures presented herein may not be comparable to similarly titled measures of other companies. Reconciliations of the Company's non‑GAAP financial measures to the most directly comparable GAAP measures are provided below and are available on the Company's website at investors.DICKS.com.
Forward-Looking Statements Involving Known and Unknown Risks and Uncertainties
This release contains forward-looking statements made pursuant to the safe harbor provisions of the Private Securities Litigation Reform Act of 1995. Forward-looking statements can be identified as those that may predict, forecast, indicate or imply future results or performance and by forward-looking words such as "believe", "anticipate", "expect", "estimate", "predict", "intend", "plan", "project", "goal", "will", "will be", "will continue", "will result", "could", "may", "might" or any variations of such words or other words with similar meanings. Any statements about the Company's plans, objectives, expectations, strategies, beliefs, or future performance or events constitute forward-looking statements. These statements are subject to known and unknown risks, uncertainties, assumptions, estimates, and other important factors that change over time, many of which may be beyond the Company's control. The Company's future performance and actual results may differ materially from those expressed or implied in such forward-looking statements. Forward-looking statements should not be relied upon as a prediction of actual results. Forward-looking statements include statements regarding, among other things, the Company's future performance, including 2026 outlook and guidance and revisions thereto, continued comparable sales growth, and improved gross margin, the ongoing impact of the combination of DICK'S Sporting Goods and Foot Locker (the "Transaction"), including the incurrence of certain pre-tax charges in connection with a review of certain assets, the optimization of inventory, the closure of underperforming stores, the right-sizing of assets, merger and integration costs, deferred financing amortization, future financial and operating results and the combined company's plans, objectives, expectations, intentions, growth strategies and culture that are not historical facts.
Factors that could cause actual results to differ materially from those expressed or implied in any forward-looking statements include, but are not limited to, macroeconomic conditions, including inflation, and/or prolonged inflationary pressures, elevated interest rates and recessionary pressures, changes in consumer disposable income and confidence, perception of global economic conditions, including as a result of new and shifting economic policies, geopolitical conflicts and tensions, the threat or outbreak of further conflicts, war, terrorism or public unrest, wage and unemployment levels, consumer debt, and public health concerns; intense competition in the sporting goods industry and in retail, including competition for talent and the level of competitive promotional activity and technological innovation; product cost and availability fluctuations due to a variety of factors; risks and costs inherent with international operations; our dependence on consumer discretionary spending and ability to predict or effectively react to changes in consumer demand, lifestyle changes or shopping patterns; risks associated with our vertical brand offerings, including competition, innovation, brand strategy and marketing, improved space in-store, expanding product categories, product safety and labeling, product liability and recalls, third party liability and proprietary rights, and specialty concept stores; risks related to athlete experiences and associated costs; our ability to protect the reputation of our Company and our brands; short-term impacts of our strategic plans and initiatives, or such plans and initiatives not achieving the desired results within the anticipated time frame or at all; our ability to successfully grow our DICK'S House of Sport, DICK'S Field House and Golf Galaxy Performance Center stores and execute our overall real estate strategy and optimization of our store portfolio for DICK'S and Foot Locker; potential disruptions in or failures to optimize our global distribution and fulfillment network; our ability to effectively and efficiently deliver merchandise to our stores and athletes; unauthorized access to, use or disclosure of sensitive or confidential athlete, teammate, vendor or Company information; disruptions, delays, downtime or other problems with our information systems, including our eCommerce platform and GameChanger, caused by high volumes, design or implementation deficiencies, or platform enhancements as well as associated disruptions to our operations; our ability to attract, train, engage and retain athletes and key teammates, to implement effective succession planning strategies, and to adequately respond to teammate organizing efforts; weather-related risks and seasonal influences resulting from the overall seasonality of certain categories of our business; our issuance of quarterly cash dividends and share repurchases pursuant to our share repurchase programs, if any; our ability to effectively control expenses, manage inventory levels and protect against inventory shrink; the ability of the Foot Locker Business to expand its market share in international markets; the technology enablement required to support our omni-channel capabilities; our ability to meet market expectations and the historical and possible future impacts on the price of our common stock; the influence and control of the holders of our Class B common stock, whose interests may differ from those of our other stockholders; the potential future issuance of Class B common stock and our charter's other current anti-takeover provisions, which could prevent or delay a change in control of the Company; our dependence on key suppliers, distributors, and manufacturers to provide sufficient quantities of quality products in a timely fashion; risks and costs relating to changing global laws, rules, regulations, interpretations and other guidance affecting our business, including with respect to consumer products, tax, cash repatriation, foreign trade and tariffs, labor, data protection, privacy, eCommerce, AI and machine learning, and other matters; product safety and labeling concerns; compliance and litigation risks for which we may not have sufficient insurance or other coverage; our ability to secure and protect our intellectual property rights and defend claims of intellectual property infringement, including with respect to our vertical brands; changes in applicable tax laws, regulations and treaties and their interpretation and application; the effects of the performance of professional sports teams within our core regions of operations and other factors relating to professional sports leagues and key athletes; the impact of evolving environmental, social and governance standards, regulatory requirements, stakeholder expectations and related political and social dynamics; risks related to the Transaction, including effective integration of the Foot Locker Business, and other strategic alliances, acquisitions or investments; obligations and other provisions related to our indebtedness, including our senior notes due 2029, 2032 and 2052; and changes in the market value or liquidity of securities we hold and risks associated with our limited degree of control over certain strategic minority investments. These factors are not necessarily all of the factors that could cause the Company's actual results, performance or achievements to differ materially from those expressed in or implied by any of the forward-looking statements. Other factors, including unknown or unpredictable factors, also could harm our results.
For additional information on these and other factors that could affect our actual results, see the risk factors set forth in our filings with the Securities and Exchange Commission (the "SEC"), including our most recent Annual Report on Form 10-K, filed with the SEC on March 27, 2026, and our other filings with the SEC. The Company disclaims and does not undertake any obligation to update or revise any forward-looking statement in this communication, except as required by applicable law or regulation. Forward-looking statements included in this communication are made as of the date of this communication.
Conference Call Info
The Company will host a conference call today at 8:00 a.m. Eastern Time to discuss the second quarter results. Investors will have the opportunity to listen to the earnings conference call over the internet through the Company's website located at investors.DICKS.com. To listen to the live call, please go to the website at least fifteen minutes early to register, download, and install any necessary audio software. For those who cannot listen to the live webcast, it will be archived on the Company's website for approximately twelve months.
About DICK'S Sporting Goods, Inc.
DICK'S Sporting Goods creates confidence and excitement by inspiring, supporting and personally equipping all athletes to achieve their dreams. Founded in 1948 and headquartered in
Driven by its belief that sports have the power to change lives, DICK'S has been a longtime champion for youth sports and, together with its Foundation, has donated millions of dollars to support under-resourced teams and athletes through the Sports Matter program and other community-based initiatives. Additional information about DICK'S business, corporate giving and employment opportunities can be found on dicks.com, investors.dicks.com, sportsmatter.org, dickssportinggoods.jobs and on Instagram, TikTok, Facebook and X.
Contacts:
Investor Relations:
Nate Gilch, Vice President of Investor Relations
DICK'S Sporting Goods, Inc.
investors@dcsg.com
(724) 273-3400
Media Relations:
(724) 273-5552 or press@dcsg.com
Category: Earnings
DICK'S SPORTING GOODS, INC. AND SUBSIDIARIES CONSOLIDATED STATEMENTS OF INCOME - UNAUDITED (In thousands, except per share data) | ||||||||
13 Weeks Ended | ||||||||
August 1, 2026 | % of Sales (1) | August 2, 2025 | % of Sales | |||||
Net sales | $ 5,586,815 | 100.00 % | $ 3,646,616 | 100.00 % | ||||
Cost of goods sold, including occupancy and distribution costs | 3,643,544 | 65.22 | 2,295,344 | 62.94 | ||||
GROSS PROFIT | 1,943,271 | 34.78 | 1,351,272 | 37.06 | ||||
Selling, general and administrative expenses | 1,447,422 | 25.91 | 878,737 | 24.10 | ||||
Merger and integration costs | 31,605 | 0.57 | 8,028 | 0.22 | ||||
Pre-opening expenses | 23,488 | 0.42 | 12,322 | 0.34 | ||||
OPERATING INCOME | 440,756 | 7.89 | 452,185 | 12.40 | ||||
Interest expense | 17,846 | 0.32 | 16,118 | 0.44 | ||||
Other (income) expense | (15,504) | (0.28) | (73,749) | (2.02) | ||||
PRE-TAX INCOME | 438,414 | 7.85 | 509,816 | 13.98 | ||||
Provision for income taxes | 122,953 | 2.20 | 128,414 | 3.52 | ||||
NET INCOME | $ 315,461 | 5.65 % | $ 381,402 | 10.46 % | ||||
EARNINGS PER COMMON SHARE: | ||||||||
Basic | $ 3.55 | $ 4.82 | ||||||
Diluted | $ 3.50 | $ 4.71 | ||||||
WEIGHTED AVERAGE COMMON SHARES OUTSTANDING: | ||||||||
Basic | 88,829 | 79,147 | ||||||
Diluted | 90,131 | 81,041 | ||||||
(1) Column does not add due to rounding | ||||||||
DICK'S SPORTING GOODS, INC. AND SUBSIDIARIES CONSOLIDATED STATEMENTS OF INCOME - UNAUDITED (In thousands, except per share data) | ||||||||
26 Weeks Ended | ||||||||
August 1, 2026 | % of Sales | August 2, 2025 | % of Sales (1) | |||||
Net sales | $ 10,751,319 | 100.00 % | $ 6,821,293 | 100.00 % | ||||
Cost of goods sold, including occupancy and distribution costs | 7,124,786 | 66.27 | 4,304,935 | 63.11 | ||||
GROSS PROFIT | 3,626,533 | 33.73 | 2,516,358 | 36.89 | ||||
Selling, general and administrative expenses | 2,611,350 | 24.29 | 1,664,265 | 24.40 | ||||
Merger and integration costs | 85,420 | 0.79 | 8,028 | 0.12 | ||||
Pre-opening expenses | 38,357 | 0.36 | 25,763 | 0.38 | ||||
OPERATING INCOME | 891,406 | 8.29 | 818,302 | 12.00 | ||||
Interest expense | 35,387 | 0.33 | 28,256 | 0.41 | ||||
Other (income) expense | (28,670) | (0.27) | (67,493) | (0.99) | ||||
PRE-TAX INCOME | 884,689 | 8.23 | 857,539 | 12.57 | ||||
Provision for income taxes | 249,406 | 2.32 | 211,849 | 3.11 | ||||
NET INCOME | $ 635,283 | 5.91 % | $ 645,690 | 9.47 % | ||||
EARNINGS PER COMMON SHARE: | ||||||||
Basic | $ 7.16 | $ 8.15 | ||||||
Diluted | $ 7.04 | $ 7.95 | ||||||
WEIGHTED AVERAGE COMMON SHARES OUTSTANDING: | ||||||||
Basic | 88,682 | 79,244 | ||||||
Diluted | 90,269 | 81,259 | ||||||
(1) Column does not add due to rounding | ||||||||
DICK'S SPORTING GOODS, INC. AND SUBSIDIARIES CONSOLIDATED BALANCE SHEETS - UNAUDITED (In thousands) | ||||||
August 1, 2026 | August 2, 2025 | January 31, 2026 | ||||
ASSETS | ||||||
CURRENT ASSETS: | ||||||
Cash and cash equivalents | $ 913,736 | $ 1,231,022 | $ 1,353,226 | |||
Accounts receivable, net | 457,634 | 223,879 | 475,852 | |||
Income taxes receivable | 92,989 | 29,792 | 68,455 | |||
Inventories, net | 5,565,341 | 3,403,914 | 4,907,823 | |||
Prepaid expenses and other current assets | 290,104 | 165,440 | 299,435 | |||
Total current assets | 7,319,804 | 5,054,047 | 7,104,791 | |||
Property and equipment, net | 3,989,714 | 2,431,782 | 3,512,776 | |||
Operating lease assets | 4,749,410 | 2,424,625 | 4,594,670 | |||
Intangible assets, net | 763,252 | 58,598 | 768,575 | |||
Goodwill | 837,019 | 245,857 | 864,047 | |||
Deferred income taxes | 63,060 | 3,387 | 82,501 | |||
Other assets | 523,163 | 472,475 | 484,139 | |||
TOTAL ASSETS | $ 18,245,422 | $ 10,690,771 | $ 17,411,499 | |||
LIABILITIES AND STOCKHOLDERS' EQUITY | ||||||
CURRENT LIABILITIES: | ||||||
Accounts payable | $ 2,245,630 | $ 1,401,800 | $ 1,986,990 | |||
Accrued expenses | 1,169,329 | 666,451 | 1,115,306 | |||
Operating lease liabilities | 970,819 | 504,975 | 1,004,909 | |||
Income taxes payable | 54,994 | 34,391 | 7,533 | |||
Deferred revenue and other liabilities | 488,453 | 371,900 | 528,820 | |||
Total current liabilities | 4,929,225 | 2,979,517 | 4,643,558 | |||
LONG-TERM LIABILITIES: | ||||||
Revolving credit borrowings | — | — | — | |||
Long-term debt and financing lease obligations | 1,906,348 | 1,484,707 | 1,905,299 | |||
Long-term operating lease liabilities | 5,085,984 | 2,619,090 | 4,836,435 | |||
Deferred income taxes | 287,872 | 40,535 | 203,920 | |||
Other long-term liabilities | 310,271 | 211,836 | 282,167 | |||
Total long-term liabilities | 7,590,475 | 4,356,168 | 7,227,821 | |||
COMMITMENTS AND CONTINGENCIES | ||||||
STOCKHOLDERS' EQUITY: | ||||||
Common stock | 656 | 556 | 653 | |||
Class B common stock | 236 | 236 | 236 | |||
Additional paid-in capital | 3,664,839 | 1,502,184 | 3,724,836 | |||
Retained earnings | 7,238,506 | 6,843,448 | 6,827,900 | |||
Accumulated other comprehensive (loss) income | (5,996) | (426) | 17,813 | |||
Treasury stock, at cost | (5,172,519) | (4,990,912) | (5,031,318) | |||
Total stockholders' equity | 5,725,722 | 3,355,086 | 5,540,120 | |||
TOTAL LIABILITIES AND STOCKHOLDERS' EQUITY | $ 18,245,422 | $ 10,690,771 | $ 17,411,499 | |||
DICK'S SPORTING GOODS, INC. AND SUBSIDIARIES CONSOLIDATED STATEMENTS OF CASH FLOWS - UNAUDITED (In thousands) | ||||
26 Weeks Ended | ||||
August 1, 2026 | August 2, 2025 | |||
CASH FLOWS FROM OPERATING ACTIVITIES: | ||||
Net income | $ 635,283 | $ 645,690 | ||
Adjustments to reconcile net income to net cash provided by operating activities: | ||||
Depreciation and amortization | 313,351 | 203,522 | ||
Amortization of deferred financing fees and debt discount | 3,034 | 5,774 | ||
Deferred income taxes | 85,356 | 89,832 | ||
Stock-based compensation | 53,851 | 37,948 | ||
Other, net | (5,508) | (32,591) | ||
Changes in assets and liabilities: | ||||
Accounts receivable | 13,359 | (11,670) | ||
Inventories | (662,488) | (54,084) | ||
Prepaid expenses and other assets | (2,766) | (17,185) | ||
Accounts payable | 254,701 | (88,601) | ||
Accrued expenses | 9,231 | (22,748) | ||
Income taxes payable / receivable | 90,553 | (21,199) | ||
Construction allowances provided by landlords | 129,263 | 70,583 | ||
Deferred revenue and other liabilities | (39,843) | (20,016) | ||
Operating lease assets and liabilities | (85,103) | (49,614) | ||
Net cash provided by operating activities | 792,274 | 735,641 | ||
CASH FLOWS FROM INVESTING ACTIVITIES: | ||||
Capital expenditures | (743,470) | (526,076) | ||
Other investing activities | (10,399) | (122,794) | ||
Net cash used in investing activities | (753,869) | (648,870) | ||
CASH FLOWS FROM FINANCING ACTIVITIES: | ||||
Payment of bridge facility financing fees | — | (7,863) | ||
Payments on financing lease obligations | (2,021) | — | ||
Proceeds from exercise of stock options | 7,598 | 969 | ||
Minimum tax withholding requirements | (121,436) | (32,059) | ||
Cash paid for treasury stock | (141,208) | (303,671) | ||
Cash dividends paid to stockholders | (224,750) | (196,052) | ||
Increase (decrease) in bank overdraft | 9,285 | (7,342) | ||
Net cash used in financing activities | (472,532) | (546,018) | ||
EFFECT OF EXCHANGE RATE CHANGES ON CASH AND CASH EQUIVALENTS | (5,363) | 329 | ||
NET DECREASE IN CASH AND CASH EQUIVALENTS | (439,490) | (458,918) | ||
CASH AND CASH EQUIVALENTS, BEGINNING OF PERIOD | 1,353,226 | 1,689,940 | ||
CASH AND CASH EQUIVALENTS, END OF PERIOD | $ 913,736 | $ 1,231,022 | ||
DICK'S SPORTING GOODS, INC. GAAP to NON-GAAP RECONCILIATIONS - UNAUDITED | |||||||
Non-GAAP Net Income and Earnings Per Share Reconciliations | |||||||
(dollars in thousands, except per share amounts) | |||||||
13 Weeks Ended August 1, 2026 | |||||||
Gross profit | Selling, general and administrative expenses | Operating income | Other (income) expense | Pre-tax income | Net income (5) | Earnings per diluted share | |
GAAP Basis | $ 1,943,271 | $ 1,447,422 | $ 440,756 | $ (15,504) | $ 438,414 | $ 315,461 | $ 3.50 |
% of Net Sales | 34.78 % | 25.91 % | 7.89 % | (0.28) % | 7.85 % | 5.65 % | |
Foot Locker acquisition- related costs (1) | (2,336) | — | 29,269 | — | 29,269 | 22,000 | |
Tariff refunds (2) | (38,137) | — | (38,137) | 2,091 | (40,228) | (30,311) | |
Store operating model redesign (3) | — | (15,349) | 15,349 | — | 15,349 | 11,384 | |
Deferred compensation plan adjustments (4) | — | (6,091) | 6,091 | 6,091 | — | — | |
Non-GAAP Basis | $ 1,902,798 | $ 1,425,982 | $ 453,328 | $ (7,322) | $ 442,804 | $ 318,534 | $ 3.53 |
% of Net Sales | 34.06 % | 25.52 % | 8.11 % | (0.13) % | 7.93 % | 5.70 % | |
(1) Foot Locker acquisition-related costs of Foot Locker Business, offset by merger and integration costs of costs, store closing charges, legal and professional fees, and other costs related to the Foot Locker acquisition. | |||||||
(2) Includes IEEPA tariff refunds received attributable to tariff costs incurred in the prior year, including related interest income. | |||||||
(3) Includes severance, training and other costs incurred in redesigning our store operating model for the DICK'S Business to better serve our athletes. | |||||||
(4) Includes non-cash changes in fair value of employee deferred compensation plan investments held in rabbi trusts. | |||||||
(5) The provision for income taxes for non-GAAP adjustments was tax effected at the statutory rate of the applicable tax jurisdiction, which approximates | |||||||
26 Weeks Ended August 1, 2026 | |||||||
Gross profit | Selling, general and administrative expenses | Operating income | Other (income) expense | Pre-tax income | Net Income (6) | Earnings per diluted share | |
GAAP Basis | $ 3,626,533 | $ 2,611,350 | $ 891,406 | $ (28,670) | $ 884,689 | $ 635,283 | $ 7.04 |
% of Net Sales | 33.73 % | 24.29 % | 8.29 % | (0.27) % | 8.23 % | 5.91 % | |
Foot Locker acquisition- related costs (1) | 40,389 | — | 125,809 | — | 125,809 | 95,528 | |
Litigation and other settlements (2) | — | 174,464 | (174,464) | — | (174,464) | (131,169) | |
Tariff refunds (3) | (38,137) | — | (38,137) | 2,091 | (40,228) | (30,311) | |
Store operating model redesign (4) | — | (15,349) | 15,349 | — | 15,349 | 11,384 | |
Deferred compensation plan adjustments (5) | — | (11,802) | 11,802 | 11,802 | — | — | |
Non-GAAP Basis | $ 3,628,785 | $ 2,758,663 | $ 831,765 | $ (14,777) | $ 811,155 | $ 580,715 | $ 6.43 |
% of Net Sales | 33.75 % | 25.66 % | 7.74 % | (0.14) % | 7.54 % | 5.40 % | |
(1) Foot Locker acquisition-related costs of Company's review of the Foot Locker Business and merger and integration costs of other employee-related costs, store closing charges, legal and professional fees, and other costs related to the Foot Locker acquisition. | |||||||
(2) Represents and | |||||||
(3) Includes IEEPA tariff refunds received attributable to tariff costs incurred in the prior year, including related interest income. | |||||||
(4) Includes severance, training and other costs incurred in redesigning our store operating model for the DICK'S Business to better serve our athletes. | |||||||
(5) Includes non-cash changes in fair value of employee deferred compensation plan investments held in rabbi trusts. | |||||||
(6) Except for approximately adjustments was tax effected at the statutory rate of the applicable tax jurisdiction, which approximates | |||||||
13 Weeks Ended August 2, 2025 | |||||||
Selling, general and administrative expenses | Operating income | Interest expense | Other (income) expense | Pre-tax income | Net income (4) | Earnings per diluted share | |
GAAP Basis | $ 878,737 | $ 452,185 | $ 16,118 | $ (73,749) | $ 509,816 | $ 381,402 | $ 4.71 |
% of Net Sales | 24.10 % | 12.40 % | 0.44 % | (2.02) % | 13.98 % | 10.46 % | |
Investment gains (1) | — | — | — | 49,745 | (49,745) | (36,812) | |
Foot Locker acquisition- related costs (2) | — | 8,028 | (4,508) | — | 12,536 | 10,337 | |
Deferred compensation plan adjustments (3) | (14,739) | 14,739 | — | 14,739 | — | — | |
Non-GAAP Basis | $ 863,998 | $ 474,952 | $ 11,610 | $ (9,265) | $ 472,607 | $ 354,927 | $ 4.38 |
% of Net Sales | 23.69 % | 13.02 % | 0.32 % | (0.25) % | 12.96 % | 9.73 % | |
(1) Included non-cash gains from non-operating investment in Foot Locker equity securities. | |||||||
(2) Represents legal and regulatory fees, other professional services and deferred financing amortization on a bridge facility related to the Foot Locker acquisition. | |||||||
(3) Included non-cash changes in fair value of employee deferred compensation plan investments held in rabbi trusts. | |||||||
(4) Except for calculated at | |||||||
26 Weeks Ended August 2, 2025 | |||||||
Selling, general and administrative expenses | Operating income | Interest expense | Other (income) expense | Pre-tax income | Net income (4) | Earnings per diluted share | |
GAAP Basis | $ 1,664,265 | $ 818,302 | $ 28,256 | $ (67,493) | $ 857,539 | $ 645,690 | $ 7.95 |
% of Net Sales | 24.40 % | 12.00 % | 0.41 % | (0.99) % | 12.57 % | 9.47 % | |
Investment gains (1) | — | — | — | 35,865 | (35,865) | (26,539) | |
Foot Locker acquisition- related costs (2) | — | 8,028 | (4,508) | — | 12,536 | 10,337 | |
Deferred compensation plan adjustments (3) | (9,031) | 9,031 | — | 9,031 | — | — | |
Non-GAAP Basis | $ 1,655,234 | $ 835,361 | $ 23,748 | $ (22,597) | $ 834,210 | $ 629,488 | $ 7.75 |
% of Net Sales | 24.27 % | 12.25 % | 0.35 % | (0.33) % | 12.23 % | 9.23 % | |
(1) Included non-cash gains from non-operating investment in Foot Locker equity securities. | |||||||
(2) Represents legal and regulatory fees, other professional services and deferred financing amortization on a bridge facility related to the Foot Locker acquisition. | |||||||
(3) Included non-cash changes in fair value of employee deferred compensation plan investments held in rabbi trusts. | |||||||
(4) Except for calculated at | |||||||
Gross Capital Expenditures to Net Capital Expenditures Reconciliation (in thousands) | ||||||||||||
The following table represents a reconciliation of the Company's gross capital expenditures to its capital expenditures, net of construction allowances. | ||||||||||||
26 Weeks Ended August 1, 2026 | 26 Weeks Ended August 2, 2025 | |||||||||||
DICK'S | Foot Locker | Consolidated | DICK'S | Foot Locker | Consolidated | |||||||
Gross capital expenditures | $ (603,225) | $ (140,245) | $ (743,470) | $ (526,076) | $ — | $ (526,076) | ||||||
Construction allowances provided by landlords | 128,962 | 301 | 129,263 | 70,583 | — | 70,583 | ||||||
Net capital expenditures | $ (474,263) | $ (139,944) | $ (614,207) | $ (455,493) | $ — | $ (455,493) | ||||||
Reconciliation of Non-GAAP Operating Income and Earnings Per Diluted Share Guidance (dollars in millions, except per share amounts) | |||||
52 Weeks Ended January 30, 2027 | |||||
Low End | High End | ||||
Operating income | Earnings per diluted share | Operating income | Earnings per diluted share | ||
GAAP Basis | $ 1,448 | $ 10.94 | $ 1,553 | $ 11.94 | |
Foot Locker acquisition-related costs (1) | 200 | 1.68 | 200 | 1.68 | |
Litigation and other settlements (2) | (174) | (1.46) | (174) | (1.46) | |
Tariff refunds (3) | (38) | (0.33) | (38) | (0.33) | |
Store operating model redesign (4) | 21 | 0.17 | 21 | 0.17 | |
Non-GAAP Basis | $ 1,457 | $ 11.00 | $ 1,562 | $ 12.00 | |
(1) | Adjustment eliminates the impact of future Foot Locker acquisition-related charges. Refer to "Acquisition of Foot Locker" section above for additional information. |
(2) | Represents income received, net of legal fees, as a result of settlement on credit and debit card interchange fees and from a landlord for early lease termination of a store location. |
(3) | Includes IEEPA tariff refunds received attributable to tariff costs incurred in the prior year, including related interest income. |
(4) | Includes severance, training and other costs incurred in redesigning our store operating model for the DICK'S Business to better serve our athletes. |
 View original content to download multimedia:https://www.prnewswire.com/news-releases/dicks-sporting-goods-inc-reports-second-quarter-results-302859323.html
SOURCE DICK'S Sporting Goods, Inc.
FAQ
AI-generated questions and answers. How Rhea-AI works. Not financial advice.