
i-80 Gold Announces Positive Feasibility Study and Initial Mineral Reserves for Granite Creek Underground; After-Tax NPV(5%) of $118 Million at $2,750/oz Au Increasing to $598 Million at $4,500/oz Au
Granite Creek’s new feasibility study boosts reserves, mine life and mid‑term output for i-80 Gold, with NPV highly sensitive to gold prices.
Rhea-AI Summary
i-80 Gold (IAUX) released a positive feasibility study and initial mineral reserve estimate for the Granite Creek underground gold project in Nevada, defining after-tax NPV(5%) of $118 million at a base gold price of $2,750/oz.
The study outlines proven and probable mineral reserves of 2.20 Mt grading 7.87 g/t Au, containing 556,500 oz of gold, and an 8.5-year mine life. Measured and indicated underground mineral resources increased 229% versus the March 2025 PEA to 3.73 Mt at 7.17 g/t Au for 859,500 oz, while inferred resources decreased 38% to 0.89 Mt at 7.06 g/t Au for 202,800 oz as material converted to higher confidence categories.
At $4,500/oz gold, after-tax NPV(5%) rises to $598 million, and at $6,000/oz to $985 million. Average annual production is projected at about 75,000 oz from 2028–2032, with estimated cash costs of $1,827/oz and AISC of $1,915/oz in that period, excluding Lone Tree Plant refurbishment capital. Total capital and closure costs are estimated at $144.9 million.
Positive
- After-tax NPV(5%) $118M and $153M after-tax cash flow at $2,750/oz Au
- Reserves 556,500 oz at 7.87 g/t Au over 2.20 Mt
- Measured & indicated resources +229% vs March 2025 PEA to 859,500 oz
- Average 75,100 oz/year production 2028–2032 after Lone Tree comes online
- Cash costs $1,827/oz and AISC $1,915/oz in 2028–2032 period
- Sustaining capital $82.9M, lower than prior PEA despite higher tonnage and development
Negative
- LOM cash costs $2,076/oz and AISC $2,273/oz, indicating high cost base
- Total capital and closure $144.9M, including $49.3M Lone Tree allocation
- 2026 production only 30,000–40,000 oz as the mine ramps up
- Project economics rely on processing optimization and timely Lone Tree commissioning in Q4 2027
News Explained
Granite Creek is already ramping, but its modeled 2028–2032 production plan relies on Lone Tree commissioning in the fourth quarter of 2027.
i-80 Gold announced the Granite Creek study while the underground is already ramping, with
The same technical work is classified as a feasibility study under NI 43-101 but as a pre-feasibility study under S-K 1300, so the study label differs by reporting regime rather than by underlying project data.
Granite Creek is expected to use third-party processing through mid-
The stated follow-up checkpoints are the ongoing
Key Figures
- After-tax NPV
- $118 million at $2,750/oz Au
- Granite Creek Underground feasibility study base case
- After-tax NPV sensitivity
- $598 million at $4,500/oz Au
- Granite Creek Underground illustrative gold-price sensitivity
- Proven and probable reserves
- 556,500 oz Au at 7.87 g/t Au
- Initial Granite Creek Underground mineral reserve estimate
- Measured and indicated resources
- 3.73 Mt containing 859,500 oz Au
- Increased 229% compared with the PEA
- Mine life
- 8.5 years
- Granite Creek Underground feasibility study
- Annual gold production
- 75,000 oz
- Average annual production for 2028-2032
- All-in sustaining costs
- $1,915/oz
- 2028-2032 steady-state period, excluding Lone Tree refurbishment capital
- Sustaining capital
- $82.9 million
- Granite Creek Underground feasibility study
Historical Context
-
High-grade assays supported planned Q4 2026 first gold and Granite Creek study timing
-
Plant refurbishment remained on schedule and on budget ahead of planned commissioning
24h Move is the share-price change in the day after each event; other market factors may also have contributed.
Key Terms
ni 43-101 regulatory
s-k 1300 regulatory
npv(5%) financial
aisc financial
AI-generated analysis. How Rhea-AI works. Not financial advice.




Unless otherwise stated, all amounts referred to herein are in
The results announced in this press release are supported by two technical reports prepared for Granite Creek Underground: (1) a technical report prepared under National Instrument 43-101 – Standards of Disclosure for Mineral Projects ("NI 43-101") which, in the opinion of the qualified persons, constitutes a feasibility study under NI 43-101 (the "NI 43-101 FS" or the "FS"); and (2) a technical report summary prepared under Subpart 1300 of Regulation S-K ("S-K 1300") which, in the opinion of the qualified persons, constitutes a pre-feasibility study under S-K 1300 (the "S-K 1300 PFS" and, together with the NI 43-101 FS, the "Technical Reports"). The Technical Reports are based on the same underlying technical and economic data and analysis but have different study classifications resulting from differences in the substantive criteria applied under each of S-K 1300 and NI 43-101. As a result, the same body of technical work satisfies the definition of a feasibility study under NI 43-101 but constitutes a pre-feasibility study under S-K 1300. The mineral resource and mineral reserve estimates and the project economics presented in the Technical Reports are derived from the same underlying technical and economic work.
"The Granite Creek Underground Feasibility Study outlines robust project economics based on a significantly expanded mineral resource base, increased production rate, and longer mine life relative to the preliminary economic assessment ("PEA")(1) published in March 2025, despite over a year of mining depletion and only a modest drilling program focused primarily on infill drilling to support the FS," stated Richard Young, President & CEO. "The drill program successfully delineated and expanded the mineralized zones, demonstrated continuity within the mineralized structures, and identified a number of additional prospective targets that suggest the potential for further mineral resource growth. The Project is expected to be a key source of feed for our wholly owned Lone Tree autoclave and carbon-in-leach processing plant for many years to come, together with mineralized material from Archimedes underground where production mining is expected to commence later this year. With the Lone Tree Plant anticipated to be operational by the end of 2027, these assets are expected to support i-80 Gold's transformation into a
Granite Creek Underground Feasibility Study Highlights
- Initial Proven and Probable Mineral Reserves of 2.20 million tonnes ("Mt") grading 7.87 grams per tonne ("g/t") gold ("Au") containing 556,500 ounces ("oz") of gold ("Au").
- Measured and Indicated underground Mineral Resources increased by
229% to 3.73 Mt grading 7.17 g/t Au containing 859,500 oz Au, compared to the PEA(1); Inferred Mineral Resources decreased by38% to 0.89 Mt grading 7.06 g/t Au containing 202,800 oz Au as the infill program converted a portion of Inferred Mineral Resources into the higher classification categories.(2) - Mine life of approximately 8.5 years (the "LOM") supported by successful South Pacific Zone drill results and improved resource definition, after accounting for 15 months of mining since the PEA.(3)
- At a base case gold price of
$2,750 $153 million 5% ) ("NPV") of$118 million - At an illustrative spot gold price sensitivity of
$4,500 $744 million 5% ) of$598 million - At an illustrative gold price sensitivity of
$6,000 $1.2 billion 5% ) of$985 million - Annual gold production of approximately 75,000 oz for the five-year period from 2028 to 2032, following completion of the Company's Lone Tree Plant refurbishment, representing an increase of approximately 15,000 oz Au per year compared to the PEA.(1)
- Estimated cash costs(4) of
$1,827 $1,915 - Lower sustaining capital of
$83 million - Optimized processing strategy whereby refractory and oxide ores are expected to be processed by a third-party through mid-2027, followed by approximately six months of stockpiling prior to the planned fourth quarter 2027 commissioning of the Company's wholly owned Lone Tree autoclave and carbon-in-leach plant at significantly lower processing costs.
- Ongoing 2026 infill and step-out drilling supports continued reserve development and resource growth in the South Pacific, Rangefront, Otto and Ogee zones, with the high-grade portion of CX Zone targeted for further evaluation as part of an anticipated extensive multi-year drill program planned to commence in 2027.
Table 1: Granite Creek Underground FS Key Operating and Financial Metrics
|
Project Economics |
Unit |
|
|
Gold Price |
$/oz |
|
|
Pre-Tax NPV( |
$M |
|
|
After-Tax NPV( |
$M |
|
|
After-Tax Cash Flow(3) |
$M |
|
|
Production Profile |
|
|
|
Mine Life |
years |
8.5 |
|
Total Ore Mined |
000s tonnes |
2,172 |
|
Mined Ore Grade |
g/t Au |
7.88 |
|
Total Stockpile Processed |
000s tonnes |
26 |
|
Total Ore Processed |
000s tonnes |
2,198 |
|
Gold Grade Processed |
g/t Au |
7.87 |
|
Total Gold Contained |
000s oz |
556 |
|
Average Gold Recovery |
% |
87 % |
|
Total Gold Recovered |
000s oz |
485 |
|
Average Annual Gold Production (2028-2032) |
000s oz |
75.1 |
|
Average Annual Gold Production (LOM) |
000s oz |
53.9 |
|
Unit Operating Costs |
|
|
|
LOM Operating Cost |
|
|
|
Mining (ore and waste) |
$/t mined |
|
|
Processing (refractory and oxide) |
$/t milled |
|
|
Transportation & Power Costs |
$/t milled |
|
|
Surface Op Costs |
$/t mined |
|
|
G&A, Taxes and Royalties(7) |
$/t milled |
|
|
Total Cash Costs - LOM(4) |
$/oz |
|
|
Total Cash Costs - (2028-2032)(4) |
$/oz |
|
|
All-in Sustaining Costs - LOM(4,5) |
$/oz |
|
|
All-in Sustaining Costs - (2028-2032)(4,5) |
$/oz |
|
|
Total Capital Costs |
|
|
|
Sustaining Capital |
$M |
|
|
Lone Tree Autoclave Capital Allocation |
$M |
|
|
Closure Costs |
$M |
|
|
Total Capital & Closure Costs |
$M |
|
For detailed metrics presented on an annual basis, see the Granite Creek Underground Detailed Cash Flow Model in Table 1 in the Appendix.
"The FS incorporates several improvements relative to the PEA,(1) including an optimized mine design, improved geological definition, increased mining flexibility, and additional working faces particularly within the Ogee Zone," stated Paul Chawrun, EVP & COO. "Successful infill and definition drilling within the South Pacific Zone closed mineralized gaps, improved continuity, and upgraded the existing mineral resources into higher-confidence categories, supporting a larger mineable inventory and longer mine life following over a year of mining. Improved geological definition also increased the number of available ore faces and increased total ore mined, contributing to higher planned production and reduced waste development. These improvements are further supported by ongoing infrastructure upgrades, including increased water treatment and dewatering capacity, and ventilation optimization."
Mr. Chawrun added, "The Study also incorporates an optimized processing strategy which includes stockpiling the Project's sulfide and oxide ore ahead of the planned commissioning of the Lone Tree Plant in the fourth quarter of 2027. This strategy is expected to increase the amount of Granite Creek ore processed at the Lone Tree Plant at more favorable processing costs, while reducing reliance on third-party processing."
Initial Mineral Reserve Estimate and Updated Mineral Resource Estimate
The updated underground mineral resource estimate included in the FS incorporates approximately 36,470 meters of drilling from 164 core holes conducted between 2023 through the end of 2025, relative to the resource estimate that formed the basis of the PEA published in March 2025.(1) Numerous step-out drill holes have resulted in a larger mineralized envelope, while infill drilling increased definition and confidence in the mineral resource and supported conversion of a majority of the resource to mineral reserves. Relative to the PEA mineable resources, and accounting for mining depletion in 2025 and a portion of 2026, approximately 65,000 ounces have been added to mineral inventory (see Figures 1 and 2).(3)
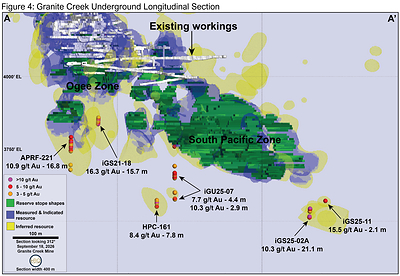
The FS includes an initial mineral reserve estimate of 556,500 oz Au at 7.87 g/t Au in the proven and probable categories (see Table 2). The updated underground mineral resource estimate includes 859,500 oz Au at 7.17 g/t Au in the measured and indicated categories, and an additional 202,800 oz at 7.06 g/t Au in the inferred category (see Table 3).(2) These mineral resources are hosted within the Ogee, Otto and South Pacific zones (see Figures 3 and 4). Relative to the PEA,(1) measured and indicated resources increased by
The resource estimate was prepared using stope optimization software which is in line with industry recommended best practices for the assessment of the in-situ mineralization which satisfies the reporting criteria of the Reasonable Prospects for Eventual Economic Extraction (RPEEE). Additionally, a more conservative approach was applied to establish the creation of grade shell domains to match current mining methods, resulting in lower grades than in the previously published PEA. These updated grades are in line with the average grade currently mined at Granite Creek and are believed to more accurately reflect the expected grades of the orebody.
Exploration
The ongoing 2026 exploration program includes a combination of infill drilling to support continued reserve development for optimized ongoing mine operations and step-out drilling to expand the current and known mineralization within the South Pacific Zone, which remains open to the north and at depth, and the Rangefront, Otto, and Ogee zones.
Additional near-mine exploration targets include the CX Zone beneath the historical CX pit, which is not currently included in the underground mineral resource. Previous drilling in the CX Zone includes high-grade intercepts from legacy holes, including 18.0 g/t Au over 9.1 m in hole HPR 078 and 15.3 g/t Au over 9.1 m in RHC-1763, and i-80 hole of 36.4 g/t Au over 9.1 m in iGM21-06.(9) A successful drill program in the CX Zone has the potential to add high-grade ounces to the mineral resource and near-term mine plan. The Company intends to evaluate the high-grade portion of the CX Zone as an underground target as part of an anticipated extensive multi-year drill program planned to commence in 2027. Multiple near-mine targets are still to be evaluated over a multi-year drill program with the potential to extend the mine life.
Table 2: Granite Creek Underground Mineral Reserve Estimate as of March 31, 2026(2)
|
Mineral Reserve Estimates |
||||
|
Classification |
Domain |
Tonnage (000s tonnes) |
Au Grade (g/t) |
Au Contained (000s oz) |
|
Proven |
Ogee |
71 |
9.34 |
21.2 |
|
Otto |
171 |
7.04 |
38.7 |
|
|
South Pacific |
40 |
11.21 |
14.5 |
|
|
Stockpile |
26 |
7.33 |
6.2 |
|
|
Total |
308 |
8.13 |
80.6 |
|
|
Probable |
Ogee |
88 |
7.95 |
22.4 |
|
Otto |
366 |
6.70 |
78.8 |
|
|
South Pacific |
1,437 |
8.11 |
374.7 |
|
|
Total |
1,890 |
7.83 |
475.9 |
|
|
Proven and Probable |
Ogee |
158 |
8.57 |
43.6 |
|
Otto |
537 |
6.81 |
117.6 |
|
|
South Pacific |
1,477 |
8.19 |
389.2 |
|
|
Stockpile |
26 |
7.33 |
6.2 |
|
|
Total |
2,198 |
7.87 |
556.5 |
|
|
Notes:
All reported underground mineral reserves are fully attributable to the Company. |
||||
Table 3: Granite Creek Underground Mineral Resource Estimate as of March 31, 2026.(2)
|
Mineral Resource Estimate |
||||||
|
Classification |
Zone |
Tonnage (000s tonnes) |
Attributable Tonnage (000s tonnes) |
Au Grade (g/t) |
Contained Au (000s oz) |
Attributable Contained Au (000s oz) |
|
Measured |
Ogee |
231 |
231 |
7.88 |
58.6 |
58.5 |
|
Otto |
310 |
310 |
6.69 |
66.6 |
66.6 |
|
|
South Pacific |
65 |
65 |
9.85 |
20.7 |
20.7 |
|
|
Total |
606 |
606 |
7.49 |
145.9 |
145.8 |
|
|
Indicated |
Ogee |
322 |
321 |
7.06 |
73.0 |
72.9 |
|
Otto |
746 |
746 |
6.26 |
150.2 |
150.2 |
|
|
South Pacific |
2,055 |
2,055 |
7.42 |
490.4 |
490.4 |
|
|
Total |
3,122 |
3,122 |
7.11 |
713.6 |
713.5 |
|
|
Measured & Indicated |
Ogee |
553 |
552 |
7.40 |
131.6 |
131.4 |
|
Otto |
1,056 |
1,056 |
6.39 |
216.8 |
216.8 |
|
|
South Pacific |
2,120 |
2,120 |
7.50 |
511.1 |
511.1 |
|
|
Total |
3,729 |
3,728 |
7.17 |
859.5 |
859.3 |
|
|
Inferred |
Ogee |
39 |
38 |
6.70 |
8.3 |
8.3 |
|
Otto |
425 |
425 |
7.63 |
104.4 |
104.4 |
|
|
South Pacific |
429 |
418 |
6.53 |
90.1 |
87.4 |
|
|
Total |
893 |
882 |
7.06 |
202.8 |
200.1 |
|
|
Notes: 1. Mineral Resources, which are not Mineral Reserves, do not have demonstrated economic viability. The estimate of Mineral Resources may be materially affected by environmental, permitting, legal, title, market or other relevant issues. The deposit has been classified as Measured, Indicated and Inferred based on confidence in the geological model and drill spacing. The quantity and grade of reported Inferred resources are uncertain in nature, and there has not been sufficient work to define these Inferred Mineral Resources as Indicated or Measured resources. There is no certainty that any part of a mineral resource will ever be converted into mineral reserves. 2. Mineral Resources are reported on an inclusive basis with units reported in in Metric Tonnes, grade is reported in grams/tonnes, and metal in 000's troy ounces. 3. Mineral Resources are reported within mineable stopes which have been defined based on metal price assumptions,* variable metallurgical recovery assumptions, mining costs, processing costs, shipping, G&A costs. Metal Pricing is based on Gold ( * Mining Costs (US$/t 190.18); * Autoclave Processing Cost (US$/t 131.13), Low-grade Oxide (US$/t 59.94) * Autoclave Recoveries ranging * Shipping Costs (US$/t 16.04) and G&A Costs (US$/t 22.29); * Totaling US$/t 281.45 – 359.64 for underground mining and processing; * Based on the variable recoveries an average cut-off grade of 3.75 - 9.81 g/t (0.286 oz/st) has been used reporting. 4. Mineral Resources have been depleted for previous underground mining activity, and reported on an attributable basis. 5. Mineral Resources are based on validated data, which have been subjected to quality analysis/quality control (QA/QC) analysis, using capped, composited samples at 2 m (5ft) intervals. Estimation has been completed using a combination of OK and IDW estimation methodologies and classified based on confidence in the underlying data and drill spacing. Mineral resource tonnages have been rounded to reflect the precision of the estimate. 6. The Mineral Resources were estimated by Benjamin Parsons, BSc, MSc Geology, MAusIMM (CP#222568) of SRK Consulting, 7. Rounding of some figures may lead to minor discrepancies in totals. Reported underground and open pit mineral resources for the Granite Creek Property are |
||||||
Figure 1: PEA vs FS Mineral Resource Comparison(3)
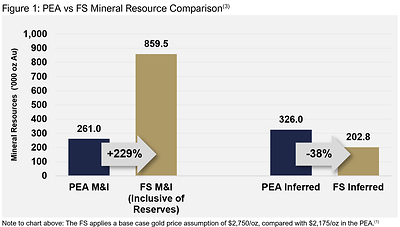
Figure 2: Granite Creek Underground Mineral Resource Reconciliation (PEA to FS)(3)
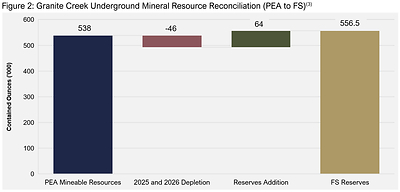
Figure 3: Granite Creek Underground Project Plan View
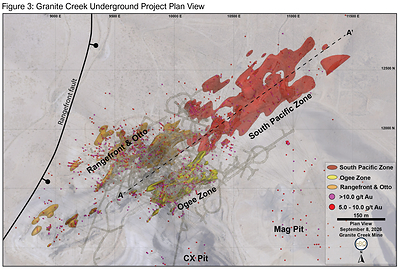
Figure 4: Granite Creek Underground Longitudinal Section
Economic Analysis
The Project leverage to the gold price is included in Table 4, which outlines the after-tax valuation in relation to fluctuations in the gold price. These selected gold price cases are illustrative sensitivities and not forecasts, and hold the reserve estimate, mine plan and other material assumptions constant.
Table 4: Granite Creek Underground Gold Price Sensitivity After-Tax Analysis
|
|
|
Gold Price ($/oz) |
|||||||
|
|
|
|
|
|
|
|
|
|
|
|
After-Tax NPV |
$M |
|
|
|
|
|
|
|
|
|
Undiscounted Cash Flow |
$M |
|
|
|
|
|
|
|
|
|
Net Profit Interest(7) |
$M |
0 |
0 |
0 |
|
|
|
|
|
|
2028-2032 AISC(4,5) |
$/oz |
|
|
|
|
|
|
|
|
|
LOM AISC(4,5) |
$/oz |
|
|
|
|
|
|
|
|
Project Overview
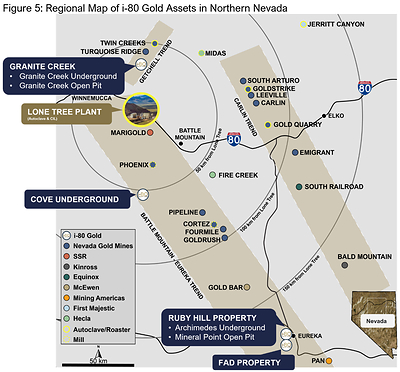
Granite Creek Underground is a fully permitted, constructed and operating gold mine currently ramping up towards steady-state production. It is the first brownfield project to be redeveloped under the Company's development plan. The broader Granite Creek property (the "Property") also hosts the Granite Creek open pit oxide deposit adjacent to the underground mine, which is currently advancing through early-stage permitting and technical work. Situated in the
Since 1980, the Property has produced approximately one million ounces of gold from both underground and open pit mining. The current underground minerals resources are primarily hosted adjacent to, but independent of, the past-producing open pits on the Property. Additionally, the Property hosts the Mag and CX oxide open pit resources.
Figure 5: Regional Map of i-80 Gold Assets in
Geology and Mineralization
Mineralization at Granite Creek Underground is
Mining
Granite Creek Underground is currently ramping up production and is expected to achieve commercial production in late 2026. The mine currently produces approximately 540 tonnes of ore per day and is operated by a local mining contractor with more than three decades of underground mining experience in northern
Underground access is through portals located in the north wall of the CX pit. The main decline provides personnel and equipment access to all areas of the mine and can accommodate 30-ton haul trucks. Mining will be conducted using underhand drift and fill methods with cemented waste rockfill optimized for the Project's ground conditions. Production drifts are 15 feet x 15 feet with a
Production drift widths will be maintained at 15 feet or less to minimize dilution and enhance recovery. Underhand drift and fill mining is well suited for the ground conditions at the Project and allows for a high degree of selectivity, productivity, and safety for mine personnel. This mining method also results in backfill with superior geotechnical quality compared to the in-situ rock.
Processing
Metallurgical testing has demonstrated that the Ogee, Otto and South Pacific zones at Granite Creek Underground contain predominantly single refractory material and require an oxidation process to increase gold extraction using cyanidation. While samples responded to both alkaline and acid pressure oxidation, significant metallurgical testing has demonstrated that an acidic autoclave environment achieved higher sulfide oxidation and superior gold recovery rates. These results confirm that the Project's ore can be processed via the Lone Tree Plant's acid pressure oxidation ("POX") conditions once the Plant is recommissioned.
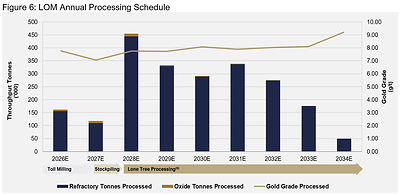
The FS incorporates an updated processing strategy that assumes third-party toll milling arrangements and associated over-the-road trucking costs through to mid-2027. To maximize the proportion of Granite Creek Underground sulfide material processed at the Company's Lone Tree Plant and reduce reliance on third-party processing, the mine plan assumes the stockpiling of sulfide refractory material beginning approximately six months prior to the planned commissioning of the Company's wholly owned Lone Tree Plant in late 2027. Beginning in 2028, the FS incorporates the anticipated lower processing costs associated with hauling refractory ore and processing it through the Lone Tree Plant.(6) The acidic environment has higher operating costs versus alkaline, however, the higher costs are mostly offset by higher recoveries. The PEA envisaged a combination of acidic and alkaline operating environment.
Oxide mineralization is present in all zones within all deposits. Mine operations to date have encountered a higher proportion of oxide ore than what has been defined in the resource estimate and FS. The oxide mineralization not accounted for in the FS presents an opportunity to process this material in the Lone Tree Plant throughout the LOM with lower overall operating costs. Work is underway to determine the cost benefit. The FS only incorporates a small component of oxide mineralization in the Ogee Zone. Oxide ore will be sold to a third party under an existing sales agreement until mid-2027 and then stockpiled similarly to the refractory ore. The oxide ore will be processed directly by the carbon-in-leach ("CIL") circuit at the Lone Tree Plant, bypassing the POX circuit.
Ore at Granite Creek Underground is screened before shipping to remove oversize material, reducing the tonnes shipped and processed while increasing the grade delivered for processing. The potential economic benefits of this practice continue to be evaluated and were not incorporated into the FS Study, representing a potential opportunity for future optimization.
A LOM processing schedule is illustrated in Figure 6.
Table 5: LOM Mining and Processing Unit Costs
|
LOM Mining and Processing Unit Costs |
||
|
Mining (ore and waste) |
$/t mined |
|
|
Surface Op Costs |
$/t mined |
|
|
Processing - Lone Tree Autoclave |
$/t milled |
|
|
Processing - Lone Tree Oxide |
$/t milled |
|
|
Transportation |
$/t milled |
|
|
Power Costs |
$/t milled |
|
|
G&A |
$/t milled |
|
|
Taxes and Royalties(7) |
$/t milled |
|
|
Total |
$/t milled |
|
|
Note to table above: |
||
Figure 6: LOM Annual Processing Schedule
Hydrology Update
Water inflow volumes to the mine have stabilized and continue to be managed well using the current underground pumping system, which presently operates near capacity. Work on an enhanced pumping system, that includes expanded sumps at lower levels and higher-capacity pumps, continues to advance. Pump installation will continue throughout the remainder of 2026 to increase overall water discharge capacity as the mine progresses at depth.
The current dewatering model estimates residual passive inflow into Granite Creek will exceed 2,500 to 2,700 gallons per minute until the additional dewatering wells advance below the current workings. The second water treatment plant has been constructed and is currently in commissioning, which is expected to increase surface water treatment capacity by approximately 3,500 gallons per minute to support the Company's long-term groundwater management objectives.
Capital Costs
LOM sustaining capital is estimated at
Table 6: LOM Capital Cost Summary
|
LOM Capital |
($Millions) |
|
Underground Mine Capital |
|
|
Surface Mine Capital* |
|
|
Sustaining Capital |
|
|
Lone Tree Plant Refurbishment Capital Allocation |
|
|
Closure and Reclamation Costs |
|
|
Total Capital |
|
|
*Surface mine capital includes approximately |
|
Figure 7: LOM Annual Cash Flow at a Gold Price of
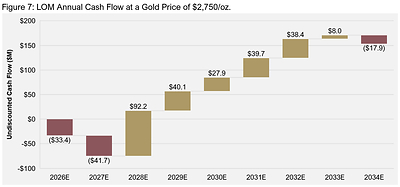
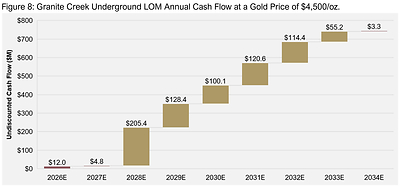
Figure 8: Granite Creek Underground LOM Annual Cash Flow at a Gold Price of
Operating Costs
During the five years of steady-state production following the commissioning of the Company's wholly-owned Lone Tree Plant (2028 to 2032), the FS estimates cash costs(4) of
During the LOM, the FS estimates cash costs(1) of
Table 7 outlines the operating costs during the first five years of steady-state production following the commencement of processing at the Lone Tree Plant, excluding the earlier years of third-party toll processing and the final two years of the LOM.
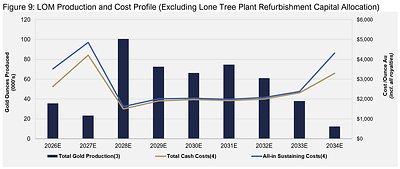
The annual cash waterfall above in Figures 7 and 8 demonstrates the importance of the planned refurbishment of the Company's Lone Tree Plant and the ending of third-party toll milling, which is expected to increase production and cash flow beginning in 2028 once commissioned. Figure 9 illustrates operating costs over the Project's estimated production profile.
Table 7: Total and Unit Operating Cost Summary: Five-Year Steady-State Period Following Lone Tree Plant Commissioning
|
2028 - 2032 |
Total Costs |
Unit Cost |
Cost per Ounce |
|
Cost Analysis |
($Millions) |
($/t) |
($/oz Au) |
|
Mining (Ore and Waste) |
|
|
|
|
Processing (Refractory and Oxide) |
|
|
|
|
Transportation & Power Costs |
|
|
|
|
Surface Op Costs |
|
|
|
|
G&A, Taxes and Royalties(7) |
|
|
|
|
Total Operating Cost/Cash Costs(4) |
|
|
|
|
Sustaining Capital |
|
|
|
|
Lone Tree Plant Refurbishment Capital Allocation |
|
|
|
|
Closure Costs |
|
|
|
|
All-in Sustaining Costs(4) |
|
|
|
|
All-in Sustaining Costs(4,5) |
|
|
|
|
Notes to table above: *Based solely on tonnes milled through the Lone Tree autoclave. |
|||
Table 8: Total and Unit Operating Cost Summary: LOM
|
LOM |
Total Costs |
Unit Cost |
Cost per Ounce |
|
Cost Analysis |
($Millions) |
($/t ) |
($/oz Au) |
|
Mining (Ore and Waste) |
|
|
|
|
Processing (Refractory and Oxide) |
|
|
|
|
Transportation & Power Costs |
|
|
|
|
Surface Op Costs |
|
|
|
|
G&A, Taxes and Royalties(7) |
|
|
|
|
Total Operating Cost/Cash Costs(4) |
|
|
|
|
Sustaining Capital |
|
|
|
|
Lone Tree Plant Refurbishment Allocation |
|
|
|
|
Closure Costs |
|
|
|
|
All-in Sustaining Costs(4) |
|
|
|
|
All-in Sustaining Costs(4,5) |
|
|
|
|
Notes to table above: |
|||
Figure 9: LOM Production and Cost Profile (Excluding Lone Tree Plant Refurbishment Capital Allocation)
Permitting
The Granite Creek Underground mine is fully permitted. The primary focus for the operations remains compliance and reporting requirements associated with existing site permits. Other than potential minor modifications to existing site permits for operational purposes, no other major permitting actions are expected in the foreseeable future.
Technical Disclosure and Qualified Persons
The Technical Reports focus solely on feasibility-level technical work for Granite Creek Underground. The Technical Reports do not update the work in the March 2025 PEA in respect of the Granite Creek open pit other than an updated mineral resource estimate , which remains subject to separate ongoing technical studies and permitting activities. The updated Granite Creek open pit mineral resource estimate included in the Technical Reports accounted for an increase in gold price resulting in a larger optimized pit shell, equating to an increase in the overall open pit mineral resource inventory. The Technical Reports include an updated open pit resource estimate of 1,591,000 oz Au grading 0.97 g/t Au in the Measured and Indicated categories, and an additional 99,800 oz Au grading at 0.81 g/t Au in the Inferred category. There are no reserves for the open pit portion of the Technical Studies. These mineral resources are hosted within the A, B, CX and Mag pits. Relative to the PEA(1), Measured and Indicated resources increased by
The NI 43-101 FS technical report titled NI 43-101 Technical Report Feasibility Study for Granite Creek will be filed under the Company's issuer profile on SEDAR+ at www.sedarplus.ca; and (ii) the S-K 1300 PFS technical report summary titled SEC Technical Report Summary Pre-Feasibility Study for Granite Creek will be filed on EDGAR at www.sec.gov. Both reports will be available on the Company's website at www.i80gold.com.
The scientific and technical information contained in this press release has been prepared under the supervision of, and has been reviewed and approved by Benjamin Parsons, BSc, MSc Geology, MAusIMM (CP#222568) for Mineral Resources and Anton Chan, B.Eng (Mining), MS (Earth Science), P.Eng., MMSAQP (#01546QP) for Mineral Reserves, both of SRK Consulting (
The Technical Reports will contain detailed descriptions of data verification, sampling and assay procedures, quality assurance and quality control measures, key assumptions, parameters, risks and other factors supporting the mineral resource and mineral reserve estimates and the economic analysis.
Inferred mineral resources are too speculative geologically to have economic considerations applied to them that would enable them to be categorized as mineral reserves. Mineral resources that are not mineral reserves do not have demonstrated economic viability, and there is no certainty that the results of the NI 43-101 FS or the S-K 1300 PFS will be realized.
Updated Timing of Cove Underground Project Technical Study
The upcoming feasibility-level technical study for the Company's Cove underground project is now expected to be completed in the fourth quarter of 2026. The Company expects to announce the results and file the corresponding technical reports during the same quarter.
Endnotes
|
(1) |
A Preliminary Economic Assessment ("PEA") on the Granite Creek Property was previously prepared by the Company in accordance with NI 43-101 and the corresponding S-K 1300, each filed in March 2025. The FS focuses solely on feasibility-level technical work for Granite Creek Underground and does not update the previous work in the PEA in respect of the Granite Creek open pit, which remains subject to separate ongoing technical studies and permitting activities by the Company. |
|
|
|
|
(2) |
All reported mineral reserves for Granite Creek underground are fully attributable to the Company. All reported underground and open pit mineral resources are |
|
|
|
|
(3) |
The Mineral Reserve estimate is based on the Mineral Resource estimate depleted through March 31, 2026. The associated reserve mine plan therefore begins April 1, 2026. For purposes of the economic analysis, the reserve schedule was shifted one month such that the economic model begins May 1, 2026. This timing adjustment does not change the Mineral Reserve inventory, mine plan, or scheduled quantities, and does not result in double counting of production. |
|
|
|
|
(4) |
This is a non-GAAP measure. Please see the section titled "Non-GAAP Financial Performance Measures" below. |
|
|
|
|
(5) |
All-in sustaining costs presented exclude the allocation of Lone Tree Plant autoclave refurbishment capital. The Lone Tree autoclave capital allocation of |
|
|
|
|
(6) |
Pending the successful completion of the refurbishment and commissioning of the Company's Lone Tree autoclave and carbon-in-leach Plant. |
|
|
|
|
(7) |
Calculated based on a Base Case scenario of |
|
|
|
|
(8) |
Turquoise Ridge Complex measured and indicated mineral gold resources are estimated at approximately 19.3 million ounces (approximately 117 Mt at 5.14 g/t Au), and inferred mineral gold resources are estimated at approximately 2.4 million ounces (approximately 29 Mt at 2.6 g/t Au) as at December 31, 2025, derived from Barrick Mining Corporation's reported |
|
|
|
|
(9) |
These historical drill results were generated by Homestake Mining Company in 1997 and Pinson Mining Company in 1995 and were not generated by i-80 Gold. The results have been reviewed by Tyler Hill, VP Geology for the Company. No QA/QC data is available for these results, however these holes were found to be acceptable for use in the 2026 Granite Creek open pit resource estimate as conducted by Global Resource Engineering (GRE). |
About i-80 Gold Corp.
i-80 Gold Corp. is a Nevada-focused mining company committed to building a mid-tier gold producer through a funded three-phase development plan to advance its high-quality asset portfolio. The Company is one of the largest mineral resource holders in the state with a pipeline of high-grade multi-stage projects strategically located in Nevada's most prolific gold-producing trends. Leveraging its central processing facility following an anticipated refurbishment, i-80 Gold is executing a hub-and-spoke regional mining and processing strategy to maximize efficiency and growth. i-80 Gold's shares are listed on the NYSE (NYSE: IAUX) and the Toronto Stock Exchange (TSX: IAU). For more information, visit www.i80gold.com.
Cautionary Statement Regarding Forward-Looking Information
Certain statements in this release constitute "forward-looking statements" or "forward-looking information" within the meaning of applicable securities laws, including but not limited to, statements regarding the updated results of the Technical Studies, such as future estimates of internal rates of return, net present value, future production, estimates of cash cost, proposed mining plans and methods, mine life estimates, cash flow forecasts, metal recoveries, estimates of capital and operating costs, timing for permitting and environmental assessments, timing, completion and results of feasibility studies, and the size and timing of phased development of the Project. Furthermore, forward-looking statements are necessarily based upon a number of estimates and assumptions that, while considered reasonable by the Company as of the date of such statements, are inherently subject to significant business, economic and competitive uncertainties and contingencies. With respect to this specific forward-looking information concerning the development of the Project, the Company has based its assumptions and analysis on certain factors that are inherently uncertain. Uncertainties include: (i) the adequacy of infrastructure; (ii) geological characteristics; (iii) metallurgical characteristics of the mineralization; (iv) the ability to develop adequate processing capacity; (v) the price of gold, silver and other commodities; (vi) the availability of equipment and facilities necessary to complete development; (vii) the cost of consumables and mining and processing equipment; (viii) unforeseen technological and engineering problems; (ix) natural disasters and/or accidents; (x) currency fluctuations; (xi) changes in regulations; (xii) the compliance by and/or key suppliers with terms of agreements; (xiii) the availability and productivity of skilled labour; (xiv) the regulation of the mining industry by various governmental agencies, including permitting and environmental assessments; (xv) the ability to raise sufficient capital to develop such projects; (xiv) changes in project scope or design; and (xv) political factors.
All statements other than statements of historical fact are forward-looking statements. Often, but not always, forward-looking statements can be identified by the use of words such as "plans", "expects", "is expected", "budget", "scheduled", "estimates", "continues", "forecasts", "projects", "predicts", "intends", "anticipates" or "believes", or variations of, or the negatives of, such words and phrases, or state that certain actions, events or results "may", "could", "would", "should", "might" or "will" be taken, occur or be achieved. Readers are cautioned that the assumptions used in the preparation of information, although considered reasonable at the time of preparation, may prove to be inaccurate and, as such, reliance should not be placed on forward-looking statements. The Company's actual results, performance or achievement could differ materially from those expressed in, or implied by, these forward-looking statements and, accordingly, no assurance can be given that any of the events anticipated by the forward-looking statements will transpire or occur, or if any of them do so, what benefits, if any, that the Company will derive therefrom. By their nature, forward looking statements are subject to numerous risks and uncertainties, some of which are beyond the Company's control, including general economic and industry conditions, volatility of commodity prices, title risks and uncertainties, uncertainty in geological, metallurgical and geotechnical studies and opinions, and ability to access sufficient capital from internal and external sources such as selling assets, restructuring debt or obtaining additional equity capital on terms that may be onerous or highly dilutive.
This release also contains references to estimates of mineral resources. The estimation of mineral resources is inherently uncertain and involves subjective judgments about many relevant factors. Mineral resources that are not mineral reserves do not have demonstrated economic viability. The accuracy of any such estimates is a function of the quantity and quality of available data, and of the assumptions made and judgments used in engineering and geological interpretation (including estimated future production from the Project, the anticipated tonnages and grades that will be mined and the estimated level of recovery that will be realized), which may prove to be unreliable and depend, to a certain extent, upon the analysis of drilling results and statistical inferences that may ultimately prove to be inaccurate. Mineral resource estimates may have to be re-estimated based on: (i) fluctuations in commodities prices; (ii) results of drilling, (iii) metallurgical testing and other studies; (iv) proposed mining operations, including dilution; (v) the evaluation of mine plans subsequent to the date of any estimates; and (vi) the possible failure to receive required permits, approvals and licenses or changes to existing mining licenses.
Forward-looking statements and information involve significant known and unknown risks and uncertainties, should not be read as guarantees of future performance or results and will not necessarily be accurate indicators of whether or not such results will be achieved. A number of factors could cause actual results to differ materially from the results expressed or implied by such forward-looking statements or information, including, but not limited to: the Company's ability to finance the development of its mineral properties; assumptions and discount rates being appropriately applied to the FS and S-K 1300 Report, uncertainty as to whether there will ever be production at the Company's mineral exploration and development properties; risks related to the Company's ability to commence production at the Project and generate material revenues or obtain adequate financing for its planned exploration and development activities; uncertainties relating to the assumptions underlying resource and reserve estimates; mining and development risks, including risks related to infrastructure, accidents, equipment breakdowns, labor disputes, bad weather, non-compliance with environmental and permit requirements or other unanticipated difficulties with or interruptions in development, construction or production; the geology, grade and continuity of the Company's mineral deposits; the uncertainties involving success of exploration, development and mining activities; permitting timelines; government regulation of mining operations; environmental risks; unanticipated reclamation expenses; prices for energy inputs, labor, materials, supplies and services; uncertainties involved in the interpretation of drilling results and geological tests and the estimation of reserves and resources; unexpected cost increases in estimated capital and operating costs; the need to obtain permits and government approvals; material adverse changes, unexpected changes in laws, rules or regulations, or their enforcement by applicable authorities; the failure of parties to contracts with the Company to perform as agreed; social or labor unrest; changes in commodity prices; and the failure of exploration programs or studies to deliver anticipated results or results that would justify and support continued exploration, studies, development or operations. For a more detailed discussion of such risks and other factors that could cause actual results to differ materially from those expressed or implied by such forward-looking statements, refer to i-80 Gold's filings with Canadian securities regulators, including the most recent Annual Information Form, available on SEDAR+ at www.sedarplus.ca.
Cautionary Note to U.S. Investors
The Company prepares its disclosure in accordance with the requirements of securities laws in effect in Canada, including NI 43-101. NI 43-101 and the U.S. Securities and Exchange Commission's Regulation S-K 1300 have similar goals but at times embody different approaches and definitions. Accordingly, scientific and technical information contained in this press release, including any references to mineral resources and mineral reserves, may not be comparable to similar information disclosed by U.S. companies subject to the SEC's disclosure requirements. Under Regulation S-K 1300, mineral resources are generally disclosed exclusive of mineral reserves, while NI 43-101 may permit inclusive presentation in a technical report if that treatment is clearly stated. Mineral resources that are not mineral reserves do not have demonstrated economic viability, and U.S. investors are cautioned not to assume that all or any part of the mineral resources referenced herein will be converted into mineral reserves. Please see "Risks Factors" in the Form 10-K for the fiscal year ended December 31, 2025 for more information regarding risks pertaining to the Company, which is available on EDGAR at www.sec.gov/edgar and SEDAR+ at www.sedarplus.ca. Readers are encouraged to carefully review these risk factors as well as the Company's other filings with the U.S. Securities and Exchange Commission and the Canadian Securities Administrators. All forward-looking statements contained in this press release speak only as of the date of this press release or as of the dates specified in such statements. The Company disclaims any intention or obligation to update or revise any forward-looking statements, whether as a result of new information, future events or otherwise except as required by applicable law.
Additional information relating to i-80 Gold can be found on i-80 Gold's website at www.i80gold.com, SEDAR+ at www.sedarplus.ca, and on EDGAR at www.sec.gov/edgar. The information included on, or accessible through, the Company's website is not incorporated by reference into this press release.
Non-GAAP Financial Performance Measures
The Company has included certain terms or performance measures in this news release commonly used in the gold mining industry that are not defined under United States Generally Accepted Accounting Principles ("US GAAP"). This includes: all-in sustaining costs per ounce and cash cost per ounce – including and excluding the allocated Lone Tree Plant refurbishment capital. Non-IFRS/Non-GAAP financial performance measures do not have any standardized meaning prescribed under US GAAP, and therefore, they may not be comparable to similar measures employed by other companies. The data presented is intended to provide additional information and should not be considered in isolation or as a substitute for measures prepared in accordance with US GAAP and should be read in conjunction with the Company's financial statements. Because the Company has provided these measures on a forward-looking basis, it is unable to present a quantitative reconciliation to the most directly comparable financial measure calculated and presented in accordance with US GAAP without unreasonable efforts. This is due to the inherent difficulty of forecasting the timing or amount of various reconciling items that would impact the most directly comparable forward-looking US GAAP measure that have not yet occurred, are outside of the Company's control and/or cannot be reasonably predicted. The cost build-ups in the accompanying tables show the principal components used to calculate the disclosed measures.
Definitions
"All-in sustaining costs" is a non-GAAP financial measure calculated based on guidance published by the World Gold Council ("WGC"). The WGC is a market development organization for the gold industry and is an association whose membership comprises leading gold mining companies. Although the WGC is not a mining industry regulatory organization, it worked closely with its member companies to develop these metrics. Adoption of the all-in sustaining cost metric is voluntary and not necessarily standard, and therefore, this measure presented by the Company may not be comparable to similar measures presented by other issuers. The Company believes that the all-in sustaining cost measure complements existing measures and ratios reported by the Company. All-in sustaining cost includes both operating and capital costs required to sustain gold production on an ongoing basis. Sustaining operating costs represent expenditures expected to be incurred at the Project that are considered necessary to maintain production. Sustaining capital represents expected capital expenditures comprising mine development costs, including capitalized waste, and ongoing replacement of mine equipment and other capital facilities, and does not include expected capital expenditures for major growth projects or enhancement capital for significant infrastructure improvements. The Company's presentation of AISC excluding the allocated Lone Tree Plant refurbishment capital is an additional non-GAAP measure and should be read together with the accompanying cost build-up. "Cash cost per gold ounce" is a common financial performance measure in the gold mining industry but has no standard meaning under US GAAP. The Company believes that, in addition to conventional measures prepared in accordance with US GAAP, certain investors use this information to evaluate the Company's performance and ability to generate cash flow. Cash cost figures are calculated in accordance with a standard developed by The Gold Institute. The Gold Institute ceased operations in 2002, but the standard is considered the accepted standard of reporting cash cost of production in North America. Adoption of the standard is voluntary, and the cost measures presented may not be comparable to other similarly titled measures of other companies.
For a more detailed breakdown on how these measures were calculated, please see the Tables 7 and 8.
APPENDIX
Table 1: Granite Creek Underground Project Detailed Cash Flow Model
|
Granite Creek Underground |
UNITS |
TOTAL LOM |
2028 - 2032 |
2026E(2) |
2027E |
2028E |
2029E |
2030E |
2031E |
2032E |
2033E |
2034E |
|
|
|
|
|
|
|
|
|
|
|
|
|
|
|
MINING |
|
|
|
|
|
|
|
|
|
|
|
|
|
Mine Life |
Years |
8.5 |
5 |
|
|
|
|
|
|
|
|
|
|
Refractory Ore Mined |
k tonnes |
2,139 |
1,560 |
161.8 |
192.0 |
330.3 |
329.9 |
289.0 |
336.7 |
273.6 |
175.9 |
50.2 |
|
Refractory Ore Mined Grade |
g/t |
7.85 |
7.86 |
7.52 |
7.42 |
7.67 |
7.71 |
8.06 |
7.88 |
8.04 |
8.09 |
9.20 |
|
|
|
|
|
|
|
|
|
|
|
|
|
|
|
Oxide Ore Mined |
k tonnes |
33 |
13 |
7.7 |
11.7 |
4.7 |
3.3 |
2.5 |
2.6 |
0.3 |
- |
- |
|
Oxide Ore Mined Grade |
g/t |
10.02 |
10.43 |
11.8 |
8.4 |
12.1 |
9.1 |
10.8 |
9.7 |
3.1 |
- |
- |
|
|
|
|
|
|
|
|
|
|
|
|
|
|
|
Total Ore Mined |
k tonnes |
2,172 |
1,573 |
169.6 |
203.7 |
335.0 |
333.2 |
291.5 |
339.3 |
274.0 |
175.9 |
50.2 |
|
|
|
|
|
|
|
|
|
|
|
|
|
|
|
Daily Mining Rate |
tpd |
724 |
874 |
465 |
558 |
918 |
913 |
799 |
930 |
751 |
482 |
137 |
|
|
|
|
|
|
|
|
|
|
|
|
|
|
|
Stockpile Used in Processing |
k tonnes |
26 |
- |
26.2 |
|
|
|
|
|
|
|
|
|
Stockpile Grade |
g/t |
7.33 |
|
7.3 |
|
|
|
|
|
|
|
|
|
|
|
|
|
|
|
|
|
|
|
|
|
|
|
PROCESSING |
|
|
|
|
|
|
|
|
|
|
|
|
|
Total Material for Processing |
k tonnes |
2,198 |
1,692 |
162 |
118 |
454 |
333 |
292 |
339 |
274 |
176 |
50 |
|
Gold Average Grade |
g/t Au |
7.87 |
7.9 |
7.77 |
7.07 |
7.75 |
7.73 |
8.08 |
7.89 |
8.04 |
8.09 |
9.20 |
|
Contained Gold |
'000 oz Au |
556.5 |
429 |
40.5 |
26.8 |
113.2 |
82.8 |
75.7 |
86.1 |
70.8 |
45.8 |
14.8 |
|
|
|
|
|
|
|
|
|
|
|
|
|
|
|
Toll Mill Processing (3rd party processing) |
|
|
|
|
|
|
|
|
|
|
|
|
|
Total Tonnes Processed |
k tonnes |
266 |
- |
156 |
110 |
|
|
|
|
|
|
|
|
Gold Grade |
g/t Au |
7.33 |
0.00 |
7.59 |
6.96 |
|
|
|
|
|
|
|
|
Contained Gold |
'000 oz Au |
63 |
- |
38 |
25 |
|
|
|
|
|
|
|
|
Gold Average Recovery |
% |
90 % |
0 % |
90 % |
90 % |
|
|
|
|
|
|
|
|
Recovered Gold |
'000 oz Au |
56 |
- |
34.4 |
22.1 |
|
|
|
|
|
|
|
|
|
|
|
|
|
|
|
|
|
|
|
|
|
|
Lone Tree Autoclave Processing |
|
|
|
|
|
|
|
|
|
|
|
|
|
Total Tonnes Processed |
k tonnes |
1,899 |
1,673 |
|
|
444 |
330 |
289 |
337 |
274 |
176 |
50 |
|
Gold Grade |
g/t Au |
7.91 |
7.85 |
|
|
7.70 |
7.71 |
8.06 |
7.88 |
8.04 |
8.09 |
9.20 |
|
Contained Gold |
'000 oz Au |
483 |
423 |
|
|
110 |
82 |
75 |
85 |
71 |
46 |
15 |
|
Gold Average Recovery |
% |
87 % |
87 % |
|
|
87 % |
87 % |
87 % |
87 % |
87 % |
87 % |
87 % |
|
Recovered Gold |
'000 oz Au |
422 |
371 |
|
|
98.2 |
71.8 |
65.8 |
74.2 |
61.2 |
38.2 |
12.4 |
|
|
|
|
|
|
|
|
|
|
|
|
|
|
|
Oxide Processing |
|
|
|
|
|
|
|
|
|
|
|
|
|
(Third-party ore purchase agreement until 2028) |
|
|
|
|
|
|
|
|
|
|
|
|
|
Total Tonnes Processed |
k tonnes |
33 |
19 |
5.6 |
8.1 |
10.4 |
3.3 |
2.5 |
2.6 |
0.3 |
- |
- |
|
Gold Grade |
g/t Au |
10.02 |
9.85 |
12.93 |
8.43 |
10.12 |
9.08 |
10.77 |
9.71 |
3.14 |
- |
- |
|
Silver Grade |
g/t Ag |
0.00 |
0.00 |
|
- |
- |
- |
- |
- |
- |
- |
- |
|
Contained Gold |
'000 oz Au |
10.6 |
6.1 |
2.3 |
2.2 |
3.4 |
1.0 |
0.9 |
0.8 |
0.0 |
- |
- |
|
Gold Payability / Recovery |
% |
69 % |
76 % |
60 % |
60 % |
76 % |
75 % |
74 % |
75 % |
66 % |
- |
- |
|
Recovered Gold |
'000 oz Au |
7.3 |
4.6 |
1.4 |
1.3 |
2.6 |
0.7 |
0.6 |
0.6 |
0.0 |
- |
- |
|
|
|
|
|
|
|
|
|
|
|
|
|
|
|
Total Tonnes Processed |
k tonnes |
2,198 |
1,692 |
162.1 |
118.0 |
454.4 |
333.2 |
291.5 |
339.3 |
274.0 |
175.9 |
50.2 |
|
Total Gold Production(3) |
'000 oz Au |
485.4 |
375.7 |
35.7 |
23.5 |
100.8 |
72.5 |
66.4 |
74.8 |
61.2 |
38.2 |
12.4 |
|
Recoverable Ag ounces remaining (BOP) |
|
|
|
|
|
|
|
|
|
|
|
|
|
REVENUE |
|
|
|
|
|
|
|
|
|
|
|
|
|
Gold Price |
US$/oz Au |
|
|
|
|
|
|
|
|
|
|
|
|
Revenues (@ |
US$M |
|
|
|
|
|
|
|
|
|
|
|
|
|
|
|
|
|
|
|
|
|
|
|
|
|
|
OPERATING COSTS |
|
|
|
|
|
|
|
|
|
|
|
|
|
Mining Costs (Mineralized Material incl. Backfill) |
US$M |
|
|
|
|
|
|
|
|
|
|
|
|
Surface Op Costs |
US$M |
|
|
|
|
|
|
|
|
|
|
|
|
Processing - Refractory / Autoclave |
US$M |
|
|
- |
- |
|
|
|
|
|
|
|
|
Processing - Refractory / Third party |
US$M |
|
|
|
|
- |
- |
- |
- |
- |
- |
- |
|
Processing - Oxide (2028 Onwards) |
US$M |
|
|
- |
- |
|
|
|
|
|
- |
- |
|
Transportation |
US$M |
|
|
|
|
|
|
|
|
|
|
|
|
Power Costs |
US$M |
|
|
|
|
|
|
|
|
|
|
|
|
G&A |
US$M |
|
|
|
|
|
|
|
|
|
|
|
|
Total Operating Cost |
US$M |
|
|
|
|
|
|
|
|
|
|
|
|
|
|
|
|
|
|
|
|
|
|
|
|
|
|
Refining |
US$M |
|
|
|
|
|
|
|
|
|
|
|
|
Royalties & State Taxes(4) |
US$M |
|
|
|
|
|
|
|
|
|
|
|
|
NPI(4) |
US$M |
|
|
- |
- |
- |
- |
- |
- |
- |
- |
- |
|
|
|
|
|
|
|
|
|
|
|
|
|
|
|
Unit Costs ($/t) |
|
|
|
|
|
|
|
|
|
|
|
|
|
Mining Costs (Ore & Waste ) |
US$/t mined |
|
|
|
|
|
|
|
|
|
|
|
|
Surface Op Costs |
US$/t mined |
|
|
|
|
|
|
|
|
|
|
|
|
Processing - Refractory / Autoclave |
US$/t milled |
|
|
- |
- |
|
|
|
|
|
|
|
|
Processing - Refractory / Third party |
US$/t milled |
|
|
|
|
- |
- |
- |
- |
- |
- |
- |
|
Processing - Oxide (2028 Onwards) |
US$/t milled |
|
|
- |
- |
|
|
|
|
|
- |
- |
|
Transportation |
US$/t milled |
|
|
|
|
|
|
|
|
|
|
|
|
Power Costs |
US$/t milled |
|
|
|
|
|
|
|
|
|
|
|
|
G&A |
US$/t milled |
|
|
|
|
|
|
|
|
|
|
|
|
|
|
|
|
|
|
|
|
|
|
|
|
|
|
Total |
US$/t milled |
|
|
|
|
|
|
|
|
|
|
|
|
|
|
|
|
|
|
|
|
|
|
|
|
|
|
CAPITAL EXPENDITURES |
|
|
|
|
|
|
|
|
|
|
|
|
|
Lone Tree Capital Allocation |
US$M |
|
|
- |
|
|
|
|
|
|
|
|
|
Mine Capex |
US$M |
|
|
|
|
|
|
|
|
|
|
- |
|
Surface Capitalized Costs |
US$M |
|
|
|
|
|
|
|
|
|
- |
- |
|
Closure Costs |
US$M |
|
|
- |
- |
- |
- |
- |
- |
- |
- |
|
|
Total Capital |
US$M |
|
|
|
|
|
|
|
|
|
|
|
|
|
|
|
|
|
|
|
|
|
|
|
|
|
|
CASH COSTS & AISC |
|
|
|
|
|
|
|
|
|
|
|
|
|
Total Cash Costs (Inc. Royalties)(1) |
US$/oz |
|
|
|
|
|
|
|
|
|
|
|
|
All-in Sustaining Costs(1)(5) |
US$/oz |
|
|
|
|
|
|
|
|
|
|
|
|
All-in Sustaining Costs, Excluding Lone Tree Capital Allocation(1)(5) |
US$/oz |
|
|
|
|
|
|
|
|
|
|
|
|
|
|
|
|
|
|
|
|
|
|
|
|
|
|
CASH FLOW ANALYSIS |
|
|
|
|
|
|
|
|
|
|
|
|
|
Revenue net of Refining |
US$M |
|
|
|
|
|
|
|
|
|
|
|
|
Royalty and NPI(4) |
US$M |
( |
( |
( |
( |
( |
( |
( |
( |
( |
( |
( |
|
Operating Costs |
US$M |
( |
( |
( |
( |
( |
( |
( |
( |
( |
( |
( |
|
Depreciation |
US$M |
( |
( |
( |
( |
( |
( |
( |
( |
( |
( |
( |
|
Net Operating Income |
US$M |
|
|
|
( |
|
|
|
|
|
|
( |
|
|
|
|
|
|
|
|
|
|
|
|
|
|
|
Income Taxes |
US$M |
( |
( |
( |
( |
( |
( |
( |
( |
( |
( |
( |
|
|
|
|
|
|
|
|
|
|
|
|
|
|
|
Net Income |
US$M |
|
|
|
( |
|
|
|
|
|
|
( |
|
Depreciation |
US$M |
|
|
|
|
|
|
|
|
|
|
|
|
Working Capital |
US$M |
|
( |
( |
|
( |
( |
( |
( |
|
( |
|
|
Operating Cash Flow |
US$M |
|
|
( |
( |
|
|
|
|
|
|
( |
|
|
|
|
|
|
|
|
|
|
|
|
|
|
|
Capital Expenditures (incl. closure costs) |
US$M |
( |
( |
( |
( |
( |
( |
( |
( |
( |
( |
( |
|
NET CASH FLOW(2) |
US$M |
|
|
( |
( |
|
|
|
|
|
|
( |
|
|
|
|
|
|
|
|
|
|
|
|
|
|
|
Cumulative CF |
|
|
|
|
|
|
|
|
|
|
|
|
|
After-tax NPV |
US$M |
|
|
|
|
|
|
|
|
|
|
|
|
Notes to table above:
|

 View original content to download multimedia:https://www.prnewswire.com/news-releases/i-80-gold-announces-positive-feasibility-study-and-initial-mineral-reserves-for-granite-creek-underground-after-tax-npv5-of-118-million-at-2-750oz-au-increasing-to-598-million-at-4-500oz-au-302885287.html
SOURCE i-80 Gold Corp
FAQ
AI-generated questions and answers. How Rhea-AI works. Not financial advice.
What is the planned production profile for Granite Creek over the life of mine?
The feasibility study outlines an approximately 8.5-year mine life with total ore processed of 2,198 kt at an average processed grade of 7.87 g/t Au, containing 556,000 oz of gold and yielding 485,000 oz recovered at 87% average recovery. Average annual gold production is projected at about 53,900 oz over the life of mine, with a higher average of about 75,100 oz per year between 2028 and 2032.
How will ore from Granite Creek be processed over time?
The company plans to process Granite Creek refractory and oxide ores through third-party facilities until around mid-2027, followed by approximately six months of stockpiling. From the planned fourth quarter 2027 commissioning of the wholly owned Lone Tree autoclave and carbon-in-leach plant, a greater portion of Granite Creek ore is expected to be treated in-house at lower processing costs, reducing reliance on third-party processing.
What exploration and resource growth opportunities remain at Granite Creek?
The 2026 program includes infill drilling to support reserve growth and step-out drilling in the South Pacific, Rangefront, Otto and Ogee zones. The South Pacific Zone remains open to the north and at depth. The CX Zone beneath the historical CX pit, which currently is not in the underground resource, has historic and recent high-grade intercepts and is targeted for evaluation as an underground target in a planned multi-year drill program starting in 2027.
How did the new feasibility study change the resource classifications compared to the PEA?
Relative to the March 2025 PEA, measured and indicated underground resources increased by 229% to 3.73 Mt grading 7.17 g/t Au for 859,500 oz, while inferred resources decreased by 38% to 0.89 Mt at 7.06 g/t Au for 202,800 oz. The shift reflects conversion of inferred material into higher-confidence categories through approximately 36,470 m of drilling and improved geological definition.