
NRSInsights’ July 2026 Retail Same-Store Sales Report
IDT (NYSE: IDT) subsidiary NRSInsights reported July 2026 retail same-store sales for the National Retail Solutions POS network.
Rhea-AI Summary
IDT (NYSE: IDT) subsidiary NRSInsights reported July 2026 retail same-store sales for the National Retail Solutions POS network. Same-store sales rose 3.3% year-over-year, while units sold fell 0.7% and baskets (transactions) per store declined 1.1%, all on a per-calendar-day basis.
Compared to June 2026, July same-store sales increased 0.2%, units sold decreased 0.5%, and baskets decreased 1.0%. For the three months ended July 31, 2026, same-store sales rose 3.2% versus the prior year period. The dollar-weighted average price of the top 500 items increased 1.7% year-over-year, versus a 1.3% increase in June, which NRS characterizes as relatively subdued inflation.
Prepared cocktails and wine-based cocktails led category growth, while coconut water, sparkling water, and non-alcoholic beer outpaced soft drinks. During July, NRS terminals processed $2.4 billion in sales across 155 million transactions through approximately 40,400 active terminals serving about 34,700 independent retailers nationwide.
Positive
- Same-store sales +3.3% year-over-year in July 2026
- Three-month same-store sales +3.2% vs year-ago period ended July 31, 2026
- Average prices +1.7% YoY on top 500 items, indicating modest reported inflation
- $2.4 billion in July 2026 sales across 155 million transactions on NRS terminals
Negative
- Units sold −0.7% year-over-year in July 2026
- Baskets (transactions) per store −1.1% year-over-year in July 2026
- Month-over-month baskets −1.0% in July 2026 versus June 2026
Details
News Market Reaction – IDT
On Aug 10, the day this news came out, IDT closed 0.35% below the previous close.
Data tracked by StockTitan Argus for the Aug 10 session.
Key Figures
- Same-store sales growth
- 3.3% year-over-year
- July 2026 versus July 2025
- Three-month same-store sales growth
- 3.2%
- Three months ended July 31, 2026 versus prior-year period
- Units sold
- -0.7% year-over-year
- July 2026 versus July 2025
- Baskets per store
- -1.1% year-over-year
- July 2026 versus July 2025
- Average price increase
- 1.7% year-over-year
- Dollar-weighted top 500 items in July 2026
- NRS terminal sales
- $2.4 billion
- Sales processed during July 2026
- Transactions processed
- 155 million transactions
- NRS terminals during July 2026
Historical Context
-
BOSS Money ranked the leading digital cross-border transfer provider for 2026
-
Same-store sales rose while units and baskets declined
-
Investor presentation announcement preceded a negative 24-hour reaction
-
Revenue, profit, and EBITDA growth accompanied raised full-year guidance
-
Same-store sales and units increased, but baskets declined
24h Move is the share-price change in the day after each event; other market factors may also have contributed.
Key Terms
same-store sales financial
point-of-sale technical
consumer packaged goods financial
AI-generated analysis. How Rhea-AI works. Not financial advice.




July same-store sales increased
The average price paid for the top 500 items in July increased
NEWARK, N.J., Aug. 10, 2026 (GLOBE NEWSWIRE) -- NRSInsights, a provider of sales data and analytics drawn from retail transactions processed through the National Retail Solutions (NRS) point-of-sale (POS) platform, today announced comparative retail same-store sales results for July 2026.
As of July 31, 2026, the NRS retail network comprised approximately 40,400 active terminals nationwide, scanning purchases at approximately 34,700 independent retailers, including convenience stores, bodegas, liquor stores, grocers, and tobacco and sundries sellers, predominantly serving urban consumers.
July Highlights
(Same-store sales, unit sales, transactions, and average price data refer to July 2026 and are compared to July 2025 unless otherwise noted. All comparisons are provided on a “per calendar day” basis to remove from consideration variability in the number of days per month or three-month period.)
- SALES
- Same-store sales increased
3.3% year-over-year. In the previous month (June 2026), same-store sales increased3.4% year-over-year.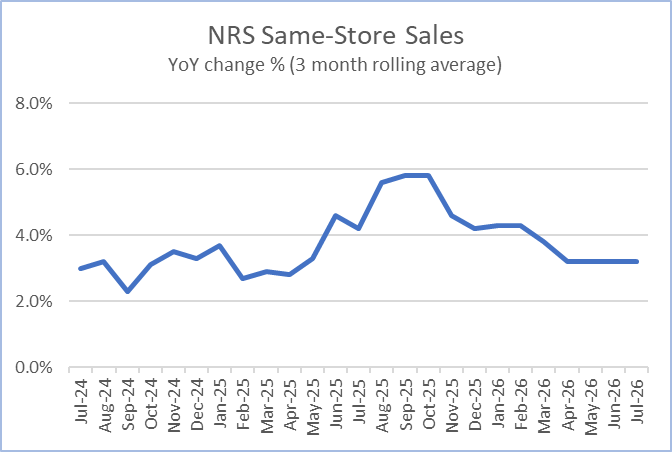
- Same-store sales increased
0.2% compared to the previous month (June 2026). Same-store sales in June 2026 decreased0.6% compared to the previous month (May 2026). - For the three months ended July 31, 2026, same-store sales increased
3.2% compared to the corresponding three months a year ago.
- Same-store sales increased
- UNITS SOLD
- Units sold decreased
0.7% year-over-year. In the previous month (June 2026), units sold decreased1.5% year over year. - Units sold decreased
0.5% compared to the previous month (June 2026). Units sold in June 2026 decreased1.3% compared to the previous month (May 2026).
- Units sold decreased
- BASKETS (TRANSACTIONS) PER STORE
- Baskets decreased
1.1% year-over-year. In the previous month (June 2026), baskets decreased0.4% year-over-year. - Baskets decreased
1.0% compared to the previous month (June 2026). Baskets in June 2026 increased0.8% compared to the previous month (May 2026).
- Baskets decreased
- AVERAGE PRICES
- A dollar-weighted average of prices for the top 500 items purchased in July 2026 increased
1.7% year-over-year, compared to the1.3% year-over-year increase in June 2026.
- A dollar-weighted average of prices for the top 500 items purchased in July 2026 increased
Commentary from Brandon Thurber (VP, Data Sales & Client Success at NRS)
“Same-store sales in July 2026 increased
“The prepared cocktails and wine-based cocktails again posted out-sized year-over-year gains to lead growth. Hydration and refreshment categories also outperformed, with coconut water, sparkling water and non-alcoholic beer again outpacing soft drinks.
Regionally, sales in the Raleigh-Durham metro area once again outpaced the nation, with Detroit and Chicago highlighting continued strength in the Great Lakes region.”
NRSInsights Reports
The NRSInsights monthly Retail Same-Store Sales Reports are intended to provide timely topline data reflective of sales at NRS’ network of independent, predominantly urban, retail stores.
Same-store data comparisons of July 2026 with July 2025 are derived from approximately 251 million transactions processed through the approximately 26,100 stores on the NRS network that scanned transactions in both months. Same-store data comparisons of July 2026 with June 2026 are derived from approximately 300 million transactions processed through approximately 33,700 stores.
Same-store data comparisons for the three months ended July 31, 2026 with the year-ago three months are derived from approximately 724 million transactions processed through stores that scanned transactions in both three-month periods.
NRS POS Platform
The NRS platform predominantly serves small-format, independent, retail stores nationwide including convenience stores, bodegas, liquor stores, grocers, and tobacco and sundries sellers. These independent retailers operate in all 50 states and the District of Colombia, including 206 of the 210 designated market areas (DMAs) in the United States, and in several Canadian markets. During July 2026, NRS’ POS terminals processed
About National Retail Solutions (NRS):
National Retail Solutions operates a leading point-of-sale (POS) terminal-based platform and digital payment processing service for independent retailers nationwide. Retailers utilize NRS offerings to process transactions, effectively manage their businesses, and integrate with leading online order and delivery platforms. Consumer packaged goods (CPG) suppliers, brokers, analytics firms, and advertisers access the terminal’s digital display network to reach these retailers’ predominantly urban, multi-cultural shopper base, and to harness transaction data-based learnings to identify growth opportunities and measure both execution and returns on marketing investment. NRS is a subsidiary of IDT Corporation (NYSE: IDT).
All statements above that are not purely about historical facts, including, but not limited to, those in which we use the words “believe,” “anticipate,” “expect,” “plan,” “intend,” “estimate,” “target” and similar expressions, are forward-looking statements within the meaning of the Private Securities Litigation Reform Act of 1995. While these forward-looking statements represent our current judgment of what may happen in the future, actual results may differ materially from the results expressed or implied by these statements due to numerous important factors. Our filings with the SEC provide detailed information on such statements and risks, and should be consulted along with this release. To the extent permitted under applicable law, IDT assumes no obligation to update any forward-looking statements.
NRSInsights Contact:
Brandon Thurber
VP, Data Sales & Client Success at NRS
National Retail Solutions
Brandon.Thurber@nrsplus.com
IDT Corporation Contact:
Bill Ulrey
william.ulrey@idt.net
# # #

FAQ
AI-generated questions and answers. How Rhea-AI works. Not financial advice.