
Karman Space & Defense Reports First Quarter Fiscal Year 2026 Financial Results
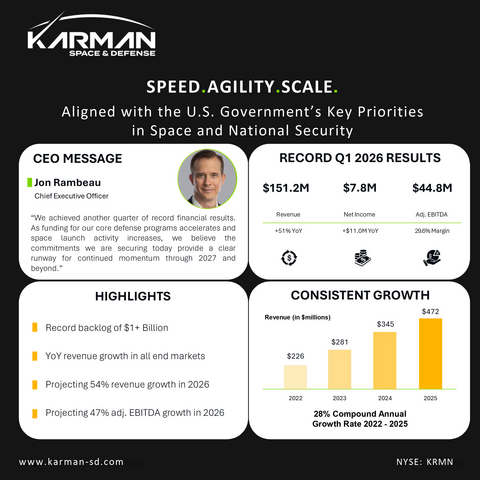
Karman Space & Defense (NYSE: KRMN) reported record Q1 FY2026 results, with revenue of $151.2 million, up 51% year over year.
Sentiment and the balance of points
Rhea-AI Sentiment reads the wording of the document, how positive or negative its language is on a 1 to 5 scale. The balance of points shown with the takes weighs what the document actually discloses, so the two can disagree, for example when a trial that missed its main goal is described in upbeat language.




Karman Space & Defense Reports Record First Quarter Earnings
First Quarter Fiscal Year 2026 and subsequent highlights
-
Produced record quarterly revenue of
$151.2 million 51.0% year over year -
Generated record quarterly net income of
$7.8 million $0.06 $4.8 million $0.04
-
Delivered record quarterly non-GAAP adjusted EBITDA of
$44.8 million 47.7% year over year increase, and non-GAAP adjusted earnings per fully diluted share of$0.11 -
Achieved record backlog of
$1.0 billion 61% compared to the end of the first quarter of 2025 - Acquired Seemann Composites and MSC in January 2026 to expand maritime defense market access and deepen capabilities in composites and resin systems
-
Upsized the revolving credit facility from
$50 million $150 million -
Raising 2026 outlook to
$720 $735 million $208.5 $219.5 million
“We achieved another quarter of record financial results, with revenue up 51 percent year-over-year and adjusted EBITDA growing nearly 50 percent. Space and Launch led growth across all end markets, expanding 29 percent, and we introduced our new Maritime Defense Systems end market,” said Jon Rambeau, chief executive officer of Karman Space & Defense. “We have excellent visibility into our full fiscal year 2026 revenue outlook, with first quarter revenue and backlog expected to convert to revenue this year representing
“Record backlog of more than
“We are seeing generational demand for our solutions unfolding in a rapidly expanding pipeline and substantially increased proposal volume, which we expect to translate into growing bookings later this year. As funding for our core defense programs accelerates and space launch activity increases, the commitments we are securing today provide a clear runway for continued momentum through 2027 and beyond,” Rambeau added.
First Quarter Fiscal Year 2026 Financial Results
|
|
Three Months Ended March 31, |
|
|
|
|||||
(unaudited, in thousands, except percentage) |
|
2026 |
|
|
2025 |
|
|
Year Over Year |
||
Hypersonics and Strategic Missile Defense |
|
$ |
35,688 |
|
|
$ |
30,056 |
|
|
up |
Space and Launch |
|
|
43,854 |
|
|
|
33,871 |
|
|
up |
Tactical Missiles and Integrated Defense Systems |
|
|
45,260 |
|
|
|
36,197 |
|
|
up |
Maritime Defense Systems1 |
|
|
26,408 |
|
|
|
— |
|
|
* |
Total Revenue |
|
$ |
151,210 |
|
|
$ |
100,124 |
|
|
up |
|
|
|
|
|
|
|
|
|
||
1. Revenue in Maritime Defense Systems for the three months ended March 31, 2025 was previously included within other end markets. |
||||||||||
* not a meaningful figure |
||||||||||
The increase in total revenue reflects growth across all end-markets and our diversified portfolio of more than 80 customers and over 130 programs.
Growth in Hypersonics and Strategic Missile Defense revenue for the three months ended March 31, 2026 from the comparable period in the prior year, was primarily driven by increases in strategic programs.
Growth in Space and Launch revenue for the three months ended March 31, 2026 from the comparable periods in the prior year, was primarily driven by the timing of orders for critical content supporting both legacy and emerging launch providers and spacecraft.
Growth in Tactical Missiles and Integrated Defense Systems for the three months ended March 31, 2026 from the comparable period in the prior year, was primarily driven by demand associated with the continued adoption of advanced drone and loitering munitions technologies and an increase in production output for GMLRS.
Growth in Maritime Defense Systems for the three months ended March 31, 2026 from the comparable period in the prior year was primarily driven by the Seemann and MSC acquisition and associated submarine and LCAC programs.
Backlog
As of March 31, 2026, total backlog was
Business Outlook for the Full Year 2026
For the full fiscal year 2026, the Company increases its expectations for total revenue to between
Non-GAAP adjusted EBITDA is provided in the full year 2026 Outlook on a forward-looking basis. The Company does not provide a reconciliation of such forward-looking measures to the most directly comparable financial measures calculated and presented in accordance with GAAP, because to do so could be misleading and not practical given the difficulty of projecting event driven transactional and other non-core operating items in any future period. The magnitude of these items, however, may be significant.
The foregoing estimates are forward-looking and reflect management’s view of current and future market conditions, subject to certain risks and uncertainties, including certain assumptions with respect to our ability to efficiently and on a timely basis integrate acquisitions, obtain and retain contracts, react to changes in the timing and/or amount of government spending, changes in the demand for our products, activities of competitors, changes in the regulatory environment, and general economic and business conditions in
Conference Call and Live Webcast
In conjunction with this release, Karman Space & Defense Inc. will host a conference call and live webcast today, Tuesday, May 12, 2026, at 1:30 pm Pacific Time. Hosting the call and webcast to review results for the first quarter of fiscal year 2026 will be Jon Rambeau, Chief Executive Officer; Mike Willis, Chief Financial Officer; Jonathan Beaudoin, Chief Operating Officer; and Steven Gitlin, Senior Vice President, Investor Relations and Corporate Communications.
Investors may dial into the call using the following telephone numbers: +1 (833) 461-5787 (
Investors with Internet access may listen to the live audio webcast via the Investor Relations page of the Karman Space & Defense website, https://investors.karman-sd.com/overview/default.aspx. Please allow ten minutes prior to the call to download and install any necessary audio software. A replay of the audio webcast will be available for one year.
A supplemental investor presentation for the first quarter fiscal year 2026 may be accessed at https://investors.karman-sd.com/News--Events/events-and-presentations/default.aspx.
Audio Replay
An audio replay of the event will be archived on the Investor Relations section of the Company's website at https://investors.karman-sd.com.
About Karman Space & Defense
Karman Space & Defense is a leader in the rapid design, development and production of critical, next-generation system solutions that align with the
Non-GAAP Supplemental Information
We present in this press release certain financial information based on our Adjusted EBITDA, Adjusted EBITDA Margin, and Adjusted Earnings Per Share (Adjusted EPS). We believe the non-GAAP financial measures will help investors understand our financial condition and operating results and assess our future prospects. We believe these non-GAAP financial measures, each of which is discussed in greater detail below, are important supplemental measures because they exclude unusual or non-recurring items as well as non-cash items that are unrelated to or may not be indicative of our ongoing operating results. Further, when read in conjunction with our
We recognize that these non-GAAP financial measures have limitations, including that they may be calculated differently by other companies or may be used under different circumstances or for different purposes, thereby affecting their comparability from company to company. In order to compensate for these and the other limitations discussed below, management does not consider these measures in isolation from or as alternatives to the comparable financial measures determined in accordance with
We define these non-GAAP financial measures as:
EBITDA refers to net income before income taxes, depreciation and amortization and interest expense.
Adjusted EBITDA refers to EBITDA plus, as applicable for each period, adjustments for certain items management believes are not indicative of ongoing operations. Adjusted EBITDA excludes non-cash share-based compensation expenses. Additionally, Adjusted EBITDA excludes certain nonrecurring costs that management excludes in contemplation of budget decisions and are not costs of operating the business, such as entity wide re-branding initiatives or acquisition integration costs, and lender and administrative agent fees associated with one-off amendments. Lastly, Adjusted EBITDA excludes other non-recurring costs including gains or losses from disposition of assets, non-cash impairment losses, non-recurring transaction expenses and other charges or gains that the Company believes are not part of the ongoing operations of its business. The resulting expense or benefit from these other non-recurring costs is inconsistent in amount and frequency.
Adjusted EBITDA Margin - Adjusted EBITDA Margin is calculated by dividing Adjusted EBITDA by revenue. Adjusted EBITDA and Adjusted EBITDA Margin are not measures calculated in accordance with
Adjusted EBITDA and Adjusted EBITDA Margin are used to facilitate a comparison of the ordinary, ongoing and customary course of our operations on a consistent basis from period to period and provide an additional understanding of factors and trends affecting our business. Adjusted EBITDA and Adjusted EBITDA Margin are driven by changes in volume, performance, contract mix and general and administrative expenses and investment levels. Performance, as used in this definition, refers to changes in profitability and is primarily based on adjustments to estimates at completion on individual contracts. These adjustments result from increases or decreases to the estimated value of the contract, the estimated costs to complete the contract, or both. These measures therefore assist management and our board and may be useful to investors in comparing our operating performance consistently over time as they remove the impact of our capital structure, asset base and items outside the control of the management team and expenses that do not relate to our core operations. Adjusted EBITDA and Adjusted EBITDA Margin may not be comparable to similarly titled non-GAAP measures used by other companies as other companies may have calculated the measures differently.
Adjusted EPS represents GAAP net income (loss) per fully diluted share, excluding transaction related expenses, integration expenses and non-recurring costs, lender and administrative agent fees, share-based compensation and other non-recurring costs as they are not representative of our operating performance.
Forward-Looking Statements
This announcement may contain “forward-looking statements” within the meaning of Section 27A of the Securities Act of 1933 and Section 21E of the Securities Exchange Act of 1934. We intend all forward-looking statements to be covered by the safe harbor provisions of the Private Securities Litigation Reform Act of 1995. Forward-looking statements generally can be identified by the fact that they do not relate strictly to historical or current facts and by the use of forward-looking words such as “expect,” “expectation,” “believe,” “anticipate,” “may,” “could,” “intend,” “belief,” “plan,” “estimate,” “target,” “predict,” “likely,” “seek,” “project,” “model,” “ongoing,” “will,” “should,” “forecast,” “outlook” or similar terminology. These statements are based on and reflect our current expectations, estimates, assumptions and/ or projections, our perception of historical trends and current conditions, as well as other factors that we believe are appropriate and reasonable under the circumstances. Forward-looking statements are neither predictions nor guarantees of future events, circumstances or performance and are inherently subject to known and unknown risks, uncertainties and assumptions that could cause our actual results to differ materially from those indicated by those statements. There can be no assurance that our expectations, estimates, assumptions and/or projections, including with respect to the future earnings and performance or capital structure of Karman, will prove to be correct or that any of our expectations, estimates or projections will be achieved.
Numerous factors could cause our actual results and events to differ materially from those expressed or implied by forward-looking statements, including, without limitation, that a significant portion of our revenue is generated from contracts with
The forward-looking statements included in this announcement are only made as of the date of this announcement. Factors or events that could cause our actual results to differ may emerge from time to time, and it is not possible for us to predict all of them. We may not actually achieve the plans, intentions or expectations disclosed in our forward-looking statements and you should not place undue reliance on our forward-looking statements. We undertake no obligation to publicly update or review any forward-looking statement, whether as a result of new information, future developments or otherwise, except as may be required by any applicable law.
Karman Holdings, Inc. Condensed Consolidated Balance Sheets (in thousands, except par value and share data) (unaudited) |
||||||||
|
|
March 31, |
|
December 31, |
||||
|
|
2026 |
|
2025 |
||||
ASSETS |
|
|
|
|
||||
Current assets |
|
|
|
|
||||
Cash and cash equivalents |
|
$ |
73,798 |
|
|
$ |
33,959 |
|
Accounts receivable, net |
|
|
98,614 |
|
|
|
78,716 |
|
Contract assets |
|
|
169,370 |
|
|
|
156,298 |
|
Inventory |
|
|
16,140 |
|
|
|
10,662 |
|
Prepaid and other current assets |
|
|
12,370 |
|
|
|
11,768 |
|
Total current assets |
|
|
370,292 |
|
|
|
291,403 |
|
Property, plant and equipment |
|
|
150,149 |
|
|
|
134,793 |
|
Less accumulated depreciation |
|
|
(42,831 |
) |
|
|
(39,384 |
) |
Net property, plant and equipment |
|
|
107,318 |
|
|
|
95,409 |
|
Other assets |
|
|
|
|
||||
Goodwill |
|
|
439,210 |
|
|
|
352,513 |
|
Intangible assets, net |
|
|
400,459 |
|
|
|
285,888 |
|
Operating lease right-of-use assets |
|
|
10,727 |
|
|
|
6,021 |
|
Finance lease right-of-use assets |
|
|
81,706 |
|
|
|
66,193 |
|
Other assets |
|
|
8,026 |
|
|
|
6,669 |
|
Total other assets |
|
|
940,128 |
|
|
|
717,284 |
|
Total assets |
|
$ |
1,417,738 |
|
|
$ |
1,104,096 |
|
|
|
|
|
|
||||
LIABILITIES AND EQUITY |
|
|
|
|
||||
Current liabilities |
|
|
|
|
||||
Accounts payable |
|
$ |
38,425 |
|
|
$ |
31,632 |
|
Accrued payroll and related expenses |
|
|
12,901 |
|
|
|
13,776 |
|
Contract liabilities |
|
|
25,752 |
|
|
|
22,814 |
|
Current portion of operating lease liabilities |
|
|
2,254 |
|
|
|
1,815 |
|
Current portion of finance lease liabilities |
|
|
4,553 |
|
|
|
4,401 |
|
Short term notes payable, net of debt issuance costs |
|
|
5,610 |
|
|
|
3,836 |
|
Income taxes payable |
|
|
5,106 |
|
|
|
5,299 |
|
Other current liabilities |
|
|
10,195 |
|
|
|
5,094 |
|
Total current liabilities |
|
|
104,796 |
|
|
|
88,667 |
|
Long-term liabilities |
|
|
|
|
||||
Revolving line of credit |
|
|
— |
|
|
|
— |
|
Long-term notes payable, net of current portion and net of debt issuance costs |
|
|
752,180 |
|
|
|
495,312 |
|
Noncurrent operating lease liabilities, net of current portion |
|
|
9,200 |
|
|
|
4,949 |
|
Noncurrent finance lease liabilities, net of current portion |
|
|
93,195 |
|
|
|
76,995 |
|
Other liabilities |
|
|
6,928 |
|
|
|
7,650 |
|
Deferred tax liabilities |
|
|
45,748 |
|
|
|
47,832 |
|
Total long-term liabilities |
|
|
907,251 |
|
|
|
632,738 |
|
Total liabilities |
|
|
1,012,047 |
|
|
|
721,405 |
|
Equity: |
|
|
|
|
||||
Preferred stock, |
|
|
— |
|
|
|
— |
|
Common stock; |
|
|
133 |
|
|
|
132 |
|
Additional paid in capital |
|
|
388,660 |
|
|
|
373,455 |
|
Accumulated other comprehensive income |
|
|
75 |
|
|
|
75 |
|
Retained earnings |
|
|
16,823 |
|
|
|
9,029 |
|
Stockholders' equity |
|
|
405,691 |
|
|
|
382,691 |
|
Total liabilities and stockholders' equity |
|
$ |
1,417,738 |
|
|
$ |
1,104,096 |
|
Karman Holdings, Inc. Condensed Consolidated Statements of Income (Loss) (in thousands, except per share amounts) (unaudited) |
||||||||
|
|
Three Months Ended March 31, |
||||||
|
|
2026 |
|
2025 |
||||
Revenue |
|
$ |
151,210 |
|
|
$ |
100,124 |
|
Cost of goods sold |
|
|
87,345 |
|
|
|
60,673 |
|
Gross profit |
|
|
63,865 |
|
|
|
39,451 |
|
Operating expenses |
|
|
|
|
||||
General and administrative expenses |
|
|
28,637 |
|
|
|
23,288 |
|
Depreciation and amortization expense |
|
|
13,776 |
|
|
|
6,200 |
|
Operating expenses |
|
|
42,413 |
|
|
|
29,488 |
|
Net operating income |
|
|
21,452 |
|
|
|
9,963 |
|
Interest expense, net |
|
|
(12,646 |
) |
|
|
(11,373 |
) |
Other income |
|
|
(174 |
) |
|
|
(80 |
) |
Income (loss) before provision for income taxes |
|
|
8,632 |
|
|
|
(1,490 |
) |
Provision for income taxes |
|
|
(838 |
) |
|
|
(3,308 |
) |
Net income (loss) |
|
|
7,794 |
|
|
|
(4,798 |
) |
Net income (loss) per common share, basic and diluted |
|
$ |
0.06 |
|
|
$ |
(0.04 |
) |
Weighted-average common share, basic and diluted |
|
|
132,526 |
|
|
|
132,175 |
|
Karman Holdings, Inc. Reconciliation of GAAP to Non-GAAP Financial Measures (unaudited) |
||||||||
|
Three Months Ended March 31, |
|||||||
(unaudited, in thousands, except percent) |
2026 |
|
2025 |
|||||
GAAP net income |
$ |
7,794 |
|
|
$ |
(4,798 |
) |
|
Income tax provision |
|
838 |
|
|
|
3,308 |
|
|
Depreciation and amortization1 |
|
16,632 |
|
|
|
8,869 |
|
|
Interest expense, net |
|
12,646 |
|
|
|
11,373 |
|
|
EBITDA |
|
37,910 |
|
|
|
18,752 |
|
|
Transaction-related expenses2 |
|
2,263 |
|
|
|
1,962 |
|
|
Integration expenses and non-recurring restructuring costs3 |
|
1,410 |
|
|
|
261 |
|
|
Lender and administrative agent fees4 |
|
735 |
|
|
|
1,260 |
|
|
Share-based Compensation5 |
|
— |
|
|
|
8,084 |
|
|
Other non-recurring costs6 |
|
2,468 |
|
|
|
— |
|
|
Adjusted EBITDA |
$ |
44,786 |
|
|
$ |
30,319 |
|
|
Revenue |
$ |
151,210 |
|
|
$ |
100,124 |
|
|
Net income margin |
|
5.2 |
% |
|
|
(4.8 |
%) |
|
Adjusted EBITDA margin |
|
29.6 |
% |
|
|
30.3 |
% |
|
|
|
Three months ended March 31, |
||||||
(unaudited) |
|
2026 |
|
2025 |
||||
GAAP net income (loss) per share |
|
$ |
0.06 |
|
|
$ |
(0.04 |
) |
Transaction-related expenses2 |
|
|
0.02 |
|
|
|
0.02 |
|
Integration expenses and non-recurring restructuring costs3 |
|
|
0.01 |
|
|
|
— |
|
Lender and administrative agent fees4 |
|
|
0.01 |
|
|
|
0.01 |
|
Share-based compensation5 |
|
|
— |
|
|
|
0.06 |
|
Other non-recurring costs6 |
|
|
0.02 |
|
|
|
— |
|
Adjusted EPS7 |
|
$ |
0.11 |
|
|
$ |
0.05 |
|
-
Includes depreciation of property, plant and equipment, amortization of intangible assets and right-of-use assets. Depreciation expense includes allocated depreciation from cost of goods sold of
$2.9 million $2.7 million -
Represents legal and due diligence fees incurred in connection with planned and completed acquisitions, which are required to be expensed as incurred. For the three months ended March 31, 2026, these expenses is primarily related to the Seemann acquisition. Additionally, the Company incurred certain professional service fees related to its IPO that did not meet the requirements to be deferred issuance costs. These costs are considered non-recurring and outside the ordinary course of business, and therefore are not indicative of ongoing operating performance. During the three months ended March 31, 2025, the
$1.9 million - Includes company-wide system implementation expenses company re-branding costs and compliance efforts. This category also includes post-acquisition integration costs, and employee expenses related to acquisitions or restructuring activities.
- Reflects non-recurring lender fees associated with discrete amendments to the Company’s credit agreement, separate from ongoing administrative fees.
- Reflects share-based compensation expenses associated with the Company’s P Units and Phantom Units. These Units were fully vested in connection with the completion of the Company’s IPO in February 2025.
-
Represents item management believes are not indicative of ongoing operating performance. Other non-recurring costs for the three months ended March 31, 2026 includes an estimated
$1.6 million - Total may not sum due to rounding.
For additional media and information, please follow us:
View source version on businesswire.com: https://www.businesswire.com/news/home/20260512004577/en/
Investor contact:
Steven Gitlin
investors@karman-sd.com
Media contact:
press@karman-sd.com
Source: Karman Space & Defense