
Medtronic reports fourth quarter and full year fiscal 2026 results; delivers highest annual revenue growth in 10 years
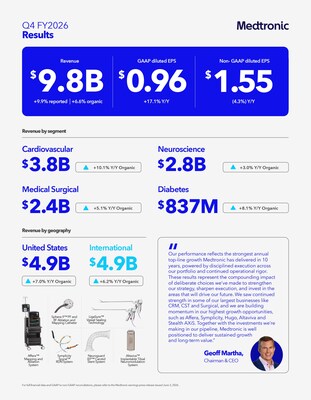
Medtronic (NYSE: MDT) reported Q4 FY26 revenue of $9.8 billion, up 9.9% reported and 6.6% organic, with non-GAAP EPS of $1.55.
Rhea-AI Summary
Medtronic (NYSE: MDT) reported Q4 FY26 revenue of $9.8 billion, up 9.9% reported and 6.6% organic, with non-GAAP EPS of $1.55. FY26 revenue reached $36.4 billion, up 8.4% reported and 5.8% organic, and GAAP EPS was $3.73, up 3.3%.
Cash from operations was $7.3 billion and free cash flow $5.4 billion. The quarterly dividend was raised to $0.72 per share, the 49th consecutive annual increase. FY27 guidance calls for 6.75%-7.25% organic revenue growth and non-GAAP EPS of $5.90-$6.00.
Positive
- Q4 FY26 revenue $9.807 billion, up 9.9% reported and 6.6% organic
- FY26 revenue $36.364 billion, up 8.4% reported and 5.8% organic
- Cardiac Ablation Solutions revenue up 78% globally, 124% in U.S.
- FY26 GAAP operating profit $6.467 billion, up 8.6%
- FY26 free cash flow $5.426 billion, up 4.6%, 76% conversion
- Quarterly dividend raised to $0.72 per share, 49th annual increase
- FY27 organic revenue growth guided to 6.75%-7.25%
- FY27 non-GAAP EPS guided to $5.90-$6.00, 6.7%-8.5% growth
Negative
- Q4 non-GAAP operating margin 25.5%, down 230 basis points
- FY26 non-GAAP operating margin 24.4%, down 130 basis points
- Q4 non-GAAP EPS $1.55, down 4.3% year-over-year
- FY26 non-GAAP EPS $5.53, down 2.0% on constant currency basis
- MiniMed Blackstone payment and tariffs reduced FY26 operating margin by 95 basis points
Details
News Market Reaction – MDT
In the Jun 3 session, MDT gained 5.69%, reflecting a notable positive market reaction.
Data tracked by StockTitan Argus on the day of publication.
Key Figures
- Q4 Revenue
- $9.8 billion
- Q4 FY26 revenue, +9.9% reported, 6.6% organic, ahead of implied guidance
- Q4 GAAP EPS
- $0.96
- Q4 FY26 GAAP diluted EPS
- Q4 non-GAAP EPS
- $1.55
- Q4 FY26 non-GAAP diluted EPS, ahead of guidance
- FY26 Revenue
- $36.4 billion
- FY26 reported revenue; adjusted revenue $36.3 billion, +8.4% reported
- FY26 GAAP EPS
- $3.73
- FY26 GAAP diluted EPS, +3.3% year-over-year
- FY26 non-GAAP EPS
- $5.53
- FY26 non-GAAP diluted EPS, +0.7% year-over-year
- FY26 Cash from Operations
- $7.3 billion
- FY26 cash from operations; free cash flow $5.4 billion
- Annual Dividend
- $2.88 per share
- FY27 implied annual dividend after raising Q1 FY27 dividend to $0.72
Historical Context
-
Plans to acquire SPR Therapeutics to expand chronic pain neuromodulation portfolio.
-
Received CE Mark for Stealth AXiS surgical system for spine and cranial use.
-
Completed CathWorks acquisition, adding AI-driven FFRangio system to portfolio.
-
Announced timing and format of upcoming Q4 and FY26 financial results release.
-
Received FDA clearance for Stealth AXiS system for cranial and ENT procedures.
24h Move is the share-price change in the day after each event; other market factors may also have contributed.
Key Terms
gaap financial
non-gaap financial
basis points financial
free cash flow financial
ce mark regulatory
fda clearance regulatory
form s-3 regulatory
AI-generated analysis. How Rhea-AI works. Not financial advice.




Disciplined execution and portfolio strength position Medtronic for continued momentum into fiscal year 2027
GALWAY,
Q4 Key Highlights
- Revenue of
$9.8 billion 9.9% as reported and6.6% organic, 90 basis points ahead of Q4 implied guidance - GAAP diluted EPS of
$0.96 $1.55 - Cardiac Ablation Solutions revenue increased
78% globally, including124% U.S . growth, gaining an additional 8 points ofU.S . share - Cardiovascular grew
10.1% , led by mid-single-digit growth in Cardiac Rhythm Management driven by continued strength across Cardiac Pacing Therapies and Defibrillation Solutions, including mid-teens growth in Micra™ and a strong OmniaSecure™U.S . launch - Medical Surgical reported strong performance, up
5.1% , led by Acute Care & Monitoring and Endoscopy, which were up low-double-digits and high-single-digits, respectively - Filed submission to
U.S . FDA for Hugo™ RAS for the general surgery and gynecologic indications, as well as LigaSure™ RAS vessel sealer; received FDA clearance for ProGrip™ Advanced - Secured FDA Clearance for Spine, Cranial and ENT indications and CE Mark for Spine and Cranial indications for Stealth AXiS™ Surgical System
- Executed several tuck-in M&A and venture capital transactions to strengthen portfolios, accelerate growth, and expand into high-growth adjacencies: completed CathWorks acquisition in Coronary and Renal Denervation; announced intention to acquire both Scientia Vascular in Neurovascular and SPR Therapeutics in Neuromodulation (in May); entered into agreements with Merit Medical Systems to offer ViaVerte™ system in Neuromodulation; and an investment in Pulnovo Medical in Cardiovascular
- Dividend for Q1 FY27 increased to
$0.72 $2.88
FY26 Key Highlights
- FY26 revenue of
$36.4 billion $36.3 billion 8.4% as reported and5.8% organic - FY26 GAAP diluted EPS of
$3.73 3.3% ; non-GAAP diluted EPS of$5.53 0.7% - FY26 operating margin was flat year-over-year; FY26 non-GAAP operating margin decreased 130 basis points, or 150 basis points constant currency
- FY26 operating profit of
$6.467 billion 8.6% ; FY26 non-GAAP operating profit of$8.856 billion 2.4% , and decreased0.6% constant currency - FY26 cash from operations of
$7.3 billion $5.4 billion $9.2 billion - Company returned
$4.2 billion
"Our performance reflects the strongest annual top-line growth Medtronic has delivered in 10 years, powered by disciplined execution across our portfolio and continued operational rigor," said Geoff Martha, Medtronic chairman and chief executive officer. "These results represent the compounding impact of deliberate choices we've made to strengthen our strategy, sharpen execution, and invest in the areas that will drive our future. We saw continued strength in some of our largest businesses like CRM, CST and Surgical, and we are building momentum in our highest growth opportunities, such as Affera, Symplicity, Hugo, Altaviva and Stealth AXiS. Together with the investments we're making in our pipeline, Medtronic is well positioned to deliver sustained growth and long-term value."
Q4 Financial Results
Medtronic reported Q4 worldwide revenue of
- Other revenue of
$34 million $31 million - Revenue from the Dutch Obesity Clinic (NOK) divestiture with no revenue in the current year and
$17 million - Foreign exchange benefit of
$308 million
Q4 revenue included:
- Cardiovascular Portfolio revenue of
$3.797 billion 13.8% as reported and10.1% organic, with high-teens increase in Cardiac Rhythm & Heart Failure, low-single digit increase in Structural Heart & Aortic, and low-single digit increase in Coronary & Peripheral Vascular, all on an organic basis - Neuroscience Portfolio revenue of
$2.751 billion 5.0% reported and3.0% organic, with low-single digit increase in Neuromodulation, Cranial & Spinal Technologies, and Specialty Therapies, all on an organic basis - Medical Surgical Portfolio revenue of
$2.388 billion 8.0% as reported and5.1% organic, with low-single digit increase in Surgical & Endoscopy, and low-double-digit increase in Acute Care & Monitoring, all on an organic basis - Diabetes business revenue of
$837 million 15.0% as reported and8.1% organic1
Q4 GAAP operating profit and operating margin were
Q4 GAAP net income and diluted earnings per share (EPS) were
FY26 Financial Results
- Medtronic reported FY26 worldwide revenue of
$36.364 billion $36.325 billion 8.4% as reported and5.8% on an organic basis. The FY26 organic revenue growth comparison excludes:- Other revenue of
$174 million $48 million - Revenue from the Dutch Obesity Clinic (NOK) divestiture of
$5 million $48 million - Foreign exchange benefit of
$819 million
- Other revenue of
FY26 GAAP operating profit and operating margin were
FY26 GAAP net income and diluted EPS were
FY26 cash from operations of
Dividend Increase
The company today announced that effective June 3, 2026, the Medtronic board of directors approved an increase in Medtronic's cash dividend for the first quarter of fiscal year 2027, raising the quarterly amount to
Guidance
The company is guiding to FY27 organic revenue growth of
The company is guiding to FY27 diluted non-GAAP EPS in the range of
"We are pleased to have delivered results ahead of expectations on both revenue and EPS," said Thierry Piéton, Medtronic chief financial officer. "As we look to FY27, we are entering the year with strong momentum, a resilient operating foundation, and a clear path to deliver durable growth. With a uniquely robust pipeline, our tuck-in M&A and investment strategy activated, and continued financial discipline, we are poised to build on our FY26 performance."
Video Webcast Information
Medtronic will host a video webcast today, June 3, at 7:45 a.m. EST (6:45 a.m. CST) to provide information about its business for the public, investors, analysts, and news media. This webcast can be accessed by clicking on the Quarterly Earnings icon at investorrelations.medtronic.com, and this earnings release will be archived at news.medtronic.com. Within 24 hours of the webcast, a replay of the webcast and transcript of the company's prepared remarks will be available by clicking on the Past Events and Presentations link under the News & Events drop-down at investorrelations.medtronic.com.
Financial Schedules and Earnings Presentation
The fourth quarter and full year financial schedules and non-GAAP reconciliations can be viewed by clicking on the Quarterly Earnings link at investorrelations.medtronic.com. To view a printable PDF of the financial schedules and non-GAAP reconciliations, click here. To view the earnings presentation, click here.
About Medtronic
Bold thinking. Bolder actions. We are Medtronic. Medtronic plc, headquartered in Galway,
FORWARD LOOKING STATEMENTS
This press release contains forward-looking statements within the meaning of the Private Securities Litigation Reform Act of 1995, which are subject to risks and uncertainties, including risks related to competitive factors, difficulties and delays inherent in the development, manufacturing, marketing and sale of medical products, government regulation, geopolitical conflicts, changing global trade policies, material acquisition and divestiture transactions, general economic conditions, and other risks and uncertainties described in the company's periodic reports on file with the
NON-GAAP FINANCIAL MEASURES
This press release contains guidance and financial measures, including adjusted net income, adjusted diluted EPS, and organic revenue, which are considered "non-GAAP" financial measures under applicable SEC rules and regulations. Certain information in this press release also includes calculations or figures that have been prepared internally and have not been reviewed or audited by our independent registered public accounting firm. Use of different methods for preparing, calculating or presenting information may lead to differences and such differences may be material.
Medtronic management believes that non-GAAP financial measures provide information useful to investors in understanding the company's underlying operational performance and trends and to facilitate comparisons with the performance of other companies in the med tech industry. Non-GAAP net income and diluted EPS exclude the effect of certain charges or gains that contribute to or reduce earnings but that result from transactions or events that management believes may or may not recur with similar materiality or impact to operations in future periods (Non-GAAP Adjustments). Medtronic generally uses non-GAAP financial measures to facilitate management's review of the operational performance of the company and as a basis for strategic planning. Non-GAAP financial measures should be considered supplemental to and not a substitute for financial information prepared in accordance with
Medtronic calculates forward-looking non-GAAP financial measures based on internal forecasts that omit certain amounts that would be included in GAAP financial measures. For instance, forward-looking organic revenue growth guidance excludes the impact of foreign currency fluctuations, revenue in the current and prior year reported as "Other", as well as significant acquisitions, divestitures, or other significant discrete items. Forward-looking diluted non-GAAP EPS guidance also excludes other potential charges or gains that would be recorded as Non-GAAP Adjustments to earnings during the fiscal year. Medtronic does not attempt to provide reconciliations of forward-looking non-GAAP EPS guidance to projected GAAP EPS guidance because the combined impact and timing of recognition of these potential charges or gains is inherently uncertain and difficult to predict and is unavailable without unreasonable efforts. In addition, the company believes such reconciliations would imply a degree of precision and certainty that could be confusing to investors. Such items could have a substantial impact on GAAP measures of financial performance.
FINANCIAL COMPARISONS
References to quarterly or annual figures increasing, decreasing, or remaining flat are in comparison to fiscal year 2025, and references to sequential changes are in comparison to the prior fiscal quarter. Unless stated otherwise, quarterly and annual rates and ranges are given on an organic basis. References to organic revenue growth exclude the impact of foreign currency, fourth quarter and full year revenue in the current and prior year reported as "Other", as well as significant acquisitions, divestitures, or other significant discrete items. Unless stated otherwise, all references to share gains or losses are as of the most recently completed calendar quarter, on a revenue basis, and in comparison, to the same period in the prior year.
TRANSACTION DETAILS
The separation of our Diabetes business is expected to occur through a series of capital markets transactions, which may include a spin-off, split-off, offering, or combination thereof. While an offering and split-off is the company's current preferred separation structure, a final decision has not been reached at this time.
Contacts:
Justin Paquette
Public Relations
+1-612-271-7935
Ingrid Goldberg
Investor Relations
+1-763-505-2696
____________________________________ | |
1 | The Diabetes results presented here may not correspond to the same financial statement information presented by MiniMed Group, Inc. (MiniMed) due to MiniMed's financials being prepared on a carve out basis through the date of the company's initial public offering (IPO) and on a standalone basis post IPO. |
MEDTRONIC PLC | ||||||||||||||||||||||||||||
WORLD WIDE REVENUE(1) | ||||||||||||||||||||||||||||
(Unaudited) | ||||||||||||||||||||||||||||
FOURTH QUARTER | FISCAL YEAR | |||||||||||||||||||||||||||
REPORTED | ORGANIC | REPORTED | ORGANIC | |||||||||||||||||||||||||
(in millions) | FY26 | FY25 | Growth | Currency | FY26(6) | FY25(6) | Growth | FY26 | FY25 | Growth | Currency | FY26(7) | FY25(7) | Growth | ||||||||||||||
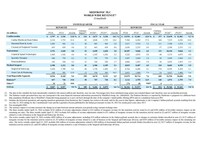
Cardiovascular | $ 3,797 | $ 3,336 | 13.8 % | $ 124 | $ 3,673 | $ 3,336 | 10.1 % | $ 13,976 | $ 12,481 | 12.0 % | $ 337 | $ 13,639 | $ 12,481 | 9.3 % | ||||||||||||||
Cardiac Rhythm & Heart Failure | 2,110 | 1,733 | 21.8 | 62 | 2,048 | 1,733 | 18.2 | 7,504 | 6,392 | 17.4 | 169 | 7,335 | 6,392 | 14.8 | ||||||||||||||
Structural Heart & Aortic | 1,002 | 944 | 6.2 | 40 | 963 | 944 | 2.0 | 3,817 | 3,554 | 7.4 | 111 | 3,706 | 3,554 | 4.3 | ||||||||||||||
Coronary & Peripheral Vascular | 685 | 659 | 4.0 | 22 | 663 | 659 | 0.6 | 2,656 | 2,535 | 4.8 | 57 | 2,598 | 2,535 | 2.5 | ||||||||||||||
Neuroscience | 2,751 | 2,620 | 5.0 | 52 | 2,699 | 2,620 | 3.0 | 10,287 | 9,846 | 4.5 | 133 | 10,154 | 9,846 | 3.1 | ||||||||||||||
Cranial & Spinal Technologies | 1,403 | 1,342 | 4.6 | 18 | 1,385 | 1,342 | 3.3 | 5,222 | 4,973 | 5.0 | 49 | 5,173 | 4,973 | 4.0 | ||||||||||||||
Specialty Therapies | 806 | 759 | 6.2 | 21 | 785 | 759 | 3.4 | 2,997 | 2,940 | 1.9 | 49 | 2,948 | 2,940 | 0.3 | ||||||||||||||
Neuromodulation | 542 | 520 | 4.3 | 13 | 528 | 520 | 1.7 | 2,068 | 1,932 | 7.0 | 36 | 2,033 | 1,932 | 5.2 | ||||||||||||||
Medical Surgical | 2,388 | 2,212 | 8.0 | 81 | 2,306 | 2,195 | 5.1 | 8,815 | 8,407 | 4.9 | 210 | 8,601 | 8,359 | 2.9 | ||||||||||||||
Surgical & Endoscopy | 1,820 | 1,709 | 6.5 | 69 | 1,750 | 1,692 | 3.5 | 6,764 | 6,498 | 4.1 | 176 | 6,585 | 6,450 | 2.1 | ||||||||||||||
Acute Care & Monitoring | 568 | 503 | 12.9 | 12 | 556 | 503 | 10.5 | 2,051 | 1,909 | 7.4 | 34 | 2,017 | 1,909 | 5.6 | ||||||||||||||
Total Reportable Segments | 8,936 | 8,168 | 9.4 | 258 | 8,678 | 8,151 | 6.5 | 33,079 | 30,734 | 7.6 | 680 | 32,394 | 30,686 | 5.6 | ||||||||||||||
Diabetes(2) | 837 | 728 | 15.0 | 50 | 787 | 728 | 8.1 | 3,112 | 2,755 | 12.9 | 140 | 2,972 | 2,755 | 7.9 | ||||||||||||||
Other(3) | 34 | 31 | 10.0 | — | — | — | — | 174 | 48 | NM(4) | 4 | — | — | — | ||||||||||||||
TOTAL | $ 9,807 | $ 8,927 | 9.9 % | $ 308 | $ 9,466 | $ 8,879 | 6.6 % | $ 36,364 | $ 33,537 | 8.4 % | $ 824 | $ 35,366 | $ 33,441 | 5.8 % | ||||||||||||||
(1) | The data in this schedule has been intentionally rounded to the nearest million and, therefore, may not sum. Percentages have been calculated using actual, non-rounded figures and, therefore, may not recalculate precisely. |
(2) | The Diabetes results presented here may not correspond to the same financial statement information presented by MiniMed Group, Inc. (MiniMed). The Diabetes Business as reported by Medtronic is prepared on a different basis than standalone Medtronic due to MiniMed's financials being prepared on a carve out basis through the date of the company's initial public offering (IPO) and on a standalone basis post IPO. |
(3) | Includes the historical operations and ongoing transition agreements from businesses the Company has exited or divested, and for the year-to-date figures, adjustments to the Company's Italian payback accruals resulting from the two July 22, 2024 rulings by the Constitutional Court and the Legislative Decree published by the Italian government on June 30, 2025 for certain prior years since 2015. |
(4) | Not meaningful (NM) |
(5) | The currency impact to revenue measures the change in revenue between current and prior year periods using constant exchange rates. |
(6) | The three months ended April 24, 2026 excludes |
(7) | The twelve months ended April 24, 2026 excludes |
MEDTRONIC PLC | ||||||||||||||||||||||||
U.S. REVENUE(1)(2) | ||||||||||||||||||||||||
(Unaudited) | ||||||||||||||||||||||||
FOURTH QUARTER | FISCAL YEAR | |||||||||||||||||||||||
REPORTED | ORGANIC | REPORTED | ORGANIC | |||||||||||||||||||||
(in millions) | FY26 | FY25 | Growth | FY26 | FY25 | Growth | FY26 | FY25 | Growth | FY26 | FY25 | Growth | ||||||||||||
Cardiovascular | $ 1,775 | $ 1,563 | 13.6 % | $ 1,775 | $ 1,563 | 13.6 % | $ 6,435 | $ 5,804 | 10.9 % | $ 6,435 | $ 5,804 | 10.9 % | ||||||||||||
Cardiac Rhythm & Heart Failure | 1,105 | 875 | 26.3 | 1,105 | 875 | 26.3 | 3,812 | 3,184 | 19.7 | 3,812 | 3,184 | 19.7 | ||||||||||||
Structural Heart & Aortic | 387 | 404 | (4.0) | 387 | 404 | (4.0) | 1,515 | 1,532 | (1.1) | 1,515 | 1,532 | (1.1) | ||||||||||||
Coronary & Peripheral Vascular | 282 | 284 | (0.6) | 282 | 284 | (0.6) | 1,107 | 1,088 | 1.7 | 1,107 | 1,088 | 1.7 | ||||||||||||
Neuroscience | 1,812 | 1,782 | 1.7 | 1,812 | 1,782 | 1.7 | 6,875 | 6,713 | 2.4 | 6,875 | 6,713 | 2.4 | ||||||||||||
Cranial & Spinal Technologies | 1,031 | 999 | 3.2 | 1,031 | 999 | 3.2 | 3,864 | 3,723 | 3.8 | 3,864 | 3,723 | 3.8 | ||||||||||||
Specialty Therapies | 431 | 431 | — | 431 | 431 | — | 1,635 | 1,666 | (1.9) | 1,635 | 1,666 | (1.9) | ||||||||||||
Neuromodulation | 350 | 352 | (0.6) | 350 | 352 | (0.6) | 1,376 | 1,324 | 3.9 | 1,376 | 1,324 | 3.9 | ||||||||||||
Medical Surgical | 1,021 | 946 | 8.0 | 1,021 | 946 | 8.0 | 3,778 | 3,664 | 3.1 | 3,778 | 3,664 | 3.1 | ||||||||||||
Surgical & Endoscopy | 694 | 668 | 3.9 | 694 | 668 | 3.9 | 2,614 | 2,595 | 0.7 | 2,614 | 2,595 | 0.7 | ||||||||||||
Acute Care & Monitoring | 328 | 278 | 17.9 | 328 | 278 | 17.9 | 1,164 | 1,068 | 9.0 | 1,164 | 1,068 | 9.0 | ||||||||||||
Total Reportable Segments | 4,609 | 4,291 | 7.4 | 4,609 | 4,291 | 7.4 | 17,088 | 16,181 | 5.6 | 17,088 | 16,181 | 5.6 | ||||||||||||
Diabetes(3) | 239 | 240 | (0.2) | 239 | 240 | (0.2) | 934 | 923 | 1.2 | 934 | 923 | 1.2 | ||||||||||||
Other(4) | 21 | 17 | 27.6 | — | — | — | 81 | 68 | 19.4 | — | — | — | ||||||||||||
TOTAL | $ 4,869 | $ 4,547 | 7.1 % | $ 4,848 | $ 4,530 | 7.0 % | $ 18,103 | $ 17,171 | 5.4 % | $ 18,022 | $ 17,104 | 5.4 % | ||||||||||||
(1) | |
(2) | The data in this schedule has been intentionally rounded to the nearest million and, therefore, may not sum. Percentages have been calculated using actual, non-rounded figures and, therefore, may not recalculate precisely. |
(3) | The Diabetes results presented here may not correspond to the same financial statement information presented by MiniMed Group, Inc. (MiniMed). The Diabetes Business as reported by Medtronic is prepared on a different basis than standalone Medtronic due to MiniMed's financials being prepared on a carve out basis through the date of the company's initial public offering (IPO) and on a standalone basis post IPO. |
(4) | Includes the historical operations and ongoing transition agreements from businesses the Company has exited or divested. |
MEDTRONIC PLC | ||||||||||||||||||||||||||||
INTERNATIONAL REVENUE(1) | ||||||||||||||||||||||||||||
(Unaudited) | ||||||||||||||||||||||||||||
FOURTH QUARTER | FISCAL YEAR | |||||||||||||||||||||||||||
REPORTED | ORGANIC | REPORTED | ORGANIC | |||||||||||||||||||||||||
(in millions) | FY26 | FY25 | Growth | Currency | FY26(6) | FY25(6) | Growth | FY26 | FY25 | Growth | Currency | FY26(7) | FY25(7) | Growth | ||||||||||||||
Cardiovascular | $ 2,023 | $ 1,773 | 14.1 % | $ 124 | $ 1,898 | $ 1,773 | 7.1 % | $ 7,541 | $ 6,677 | 12.9 % | $ 337 | $ 7,204 | $ 6,677 | 7.9 % | ||||||||||||||
Cardiac Rhythm & Heart Failure | 1,005 | 858 | 17.1 | 62 | 943 | 858 | 9.9 | 3,691 | 3,208 | 15.1 | 169 | 3,522 | 3,208 | 9.8 | ||||||||||||||
Structural Heart & Aortic | 615 | 541 | 13.8 | 40 | 575 | 541 | 6.4 | 2,301 | 2,022 | 13.8 | 111 | 2,190 | 2,022 | 8.3 | ||||||||||||||
Coronary & Peripheral Vascular | 403 | 375 | 7.5 | 22 | 380 | 375 | 1.6 | 1,549 | 1,447 | 7.0 | 57 | 1,491 | 1,447 | 3.1 | ||||||||||||||
Neuroscience | 938 | 838 | 12.0 | 52 | 886 | 838 | 5.8 | 3,412 | 3,133 | 8.9 | 133 | 3,279 | 3,133 | 4.7 | ||||||||||||||
Cranial & Spinal Technologies | 372 | 343 | 8.6 | 18 | 354 | 343 | 3.3 | 1,358 | 1,250 | 8.6 | 49 | 1,309 | 1,250 | 4.7 | ||||||||||||||
Specialty Therapies | 374 | 328 | 14.3 | 21 | 354 | 328 | 8.0 | 1,362 | 1,274 | 6.9 | 49 | 1,313 | 1,274 | 3.1 | ||||||||||||||
Neuromodulation | 191 | 167 | 14.5 | 13 | 178 | 167 | 6.5 | 692 | 608 | 13.8 | 36 | 656 | 608 | 7.9 | ||||||||||||||
Medical Surgical | 1,366 | 1,266 | 7.9 | 81 | 1,285 | 1,249 | 2.9 | 5,037 | 4,744 | 6.2 | 210 | 4,823 | 4,695 | 2.7 | ||||||||||||||
Surgical & Endoscopy | 1,126 | 1,041 | 8.2 | 69 | 1,057 | 1,024 | 3.2 | 4,151 | 3,903 | 6.3 | 176 | 3,971 | 3,855 | 3.0 | ||||||||||||||
Acute Care & Monitoring | 240 | 225 | 6.8 | 12 | 228 | 225 | 1.4 | 887 | 841 | 5.5 | 34 | 853 | 841 | 1.4 | ||||||||||||||
Total Reportable Segments | 4,327 | 3,877 | 11.6 | 258 | 4,069 | 3,860 | 5.4 | 15,991 | 14,553 | 9.9 | 680 | 15,306 | 14,505 | 5.5 | ||||||||||||||
Diabetes(2) | 598 | 489 | 22.4 | 50 | 548 | 489 | 12.2 | 2,178 | 1,832 | 18.9 | 140 | 2,038 | 1,832 | 11.2 | ||||||||||||||
Other(3) | 13 | 14 | (10.4) | — | — | — | — | 93 | (20) | NM(4) | 4 | — | — | — | ||||||||||||||
TOTAL | $ 4,938 | $ 4,380 | 12.8 % | $ 308 | $ 4,618 | $ 4,348 | 6.2 % | $ 18,261 | $ 16,365 | 11.6 % | $ 824 | $ 17,344 | $ 16,337 | 6.2 % | ||||||||||||||
(1) | The data in this schedule has been intentionally rounded to the nearest million and, therefore, may not sum. Percentages have been calculated using actual, non-rounded figures and, therefore, may not recalculate precisely. |
(2) | The Diabetes results presented here may not correspond to the same financial statement information presented by MiniMed Group, Inc. (MiniMed). The Diabetes Business as reported by Medtronic is prepared on a different basis than standalone Medtronic due to MiniMed's financials being prepared on a carve out basis through the date of the company's initial public offering (IPO) and on a standalone basis post IPO. |
(3) | Includes the historical operations and ongoing transition agreements from businesses the Company has exited and divested and for the year-to-date figures, adjustments to the Company's Italian payback accruals resulting from the two July 22, 2024 rulings by the Constitutional Court and the Legislative Decree published by the Italian government on June 30, 2025 for certain prior years since 2015. |
(4) | Not meaningful (NM) |
(5) | The currency impact to revenue measures the change in revenue between current and prior year periods using constant exchange rates. |
(6) | The three months ended April 24, 2026 excludes |
(7) | The twelve months ended April 24, 2026 excludes |
MEDTRONIC PLC | |||||||
CONSOLIDATED STATEMENTS OF INCOME | |||||||
(Unaudited) | |||||||
Three months ended | Fiscal year ended | ||||||
(in millions, except per share data) | April 24, 2026 | April 25, 2025 | April 24, 2026 | April 25, 2025 | |||
Net sales | $ 9,807 | $ 8,927 | $ 36,364 | $ 33,537 | |||
Costs and expenses: | |||||||
Cost of products sold, excluding amortization of intangible assets | 3,398 | 3,147 | 12,721 | 11,632 | |||
Research and development expense | 671 | 684 | 2,873 | 2,732 | |||
Selling, general, and administrative expense | 3,056 | 2,721 | 11,784 | 10,849 | |||
Amortization of intangible assets | 409 | 564 | 1,772 | 1,807 | |||
Restructuring charges, net | 118 | 147 | 249 | 267 | |||
Certain litigation charges, net | 23 | 214 | 113 | 317 | |||
Other operating expense (income), net | 260 | 15 | 386 | (23) | |||
Operating profit | 1,873 | 1,436 | 6,467 | 5,955 | |||
Other non-operating expense (income), net | (138) | 1 | (384) | (402) | |||
Interest expense, net | 176 | 174 | 715 | 729 | |||
Income before income taxes | 1,834 | 1,261 | 6,136 | 5,628 | |||
Income tax provision | 575 | 199 | 1,299 | 936 | |||
Net income | 1,259 | 1,061 | 4,837 | 4,691 | |||
Net income attributable to noncontrolling interests | (16) | (5) | (37) | (29) | |||
Net income attributable to Medtronic | $ 1,243 | $ 1,057 | $ 4,801 | $ 4,662 | |||
Basic earnings per share | $ 0.97 | $ 0.82 | $ 3.75 | $ 3.63 | |||
Diluted earnings per share | $ 0.96 | $ 0.82 | $ 3.73 | $ 3.61 | |||
Basic weighted average shares outstanding | 1,281.5 | 1,282.3 | 1,281.8 | 1,285.6 | |||
Diluted weighted average shares outstanding | 1,288.2 | 1,287.7 | 1,288.1 | 1,289.9 | |||
The data in the schedule above has been intentionally rounded to the nearest million, and therefore, the quarterly amounts may not sum to the fiscal year-to-date amounts. |
MEDTRONIC PLC | |||||||||||||||||
GAAP TO NON-GAAP RECONCILIATIONS(1) | |||||||||||||||||
(Unaudited) | |||||||||||||||||
Three months ended April 24, 2026 | |||||||||||||||||
(in millions, except per share data) | Net | Cost of | Gross | Operating | Operating | Income | Net Income | Diluted | Effective | ||||||||
GAAP | $ 9,807 | $ 3,398 | 65.4 % | $ 1,873 | 19.1 % | $ 1,834 | $ 1,243 | $ 0.96 | 31.3 % | ||||||||
Non-GAAP adjustments: | |||||||||||||||||
Amortization of intangible assets | — | — | — | 409 | 4.2 | 409 | 334 | 0.26 | 18.3 | ||||||||
Restructuring and associated costs(2) | — | — | — | 118 | 1.2 | 118 | 88 | 0.07 | 26.0 | ||||||||
Acquisition and divestiture-related items(3) | — | (5) | 0.1 | 77 | 0.8 | 77 | 64 | 0.05 | 17.7 | ||||||||
Certain litigation charges, net | — | — | — | 23 | 0.2 | 23 | 17 | 0.01 | 27.3 | ||||||||
(Gain)/loss on minority investments(4) | — | — | — | — | — | (15) | (7) | (0.01) | 50.0 | ||||||||
Certain tax adjustments, net(5) | — | — | — | — | — | — | 259 | 0.20 | — | ||||||||
Non-GAAP | $ 9,807 | $ 3,392 | 65.4 % | $ 2,500 | 25.5 % | $ 2,447 | $ 1,998 | $ 1.55 | 17.7 % | ||||||||
Currency impact | (308) | (28) | (0.8) | (91) | (0.1) | (0.05) | |||||||||||
Currency Adjusted | $ 9,499 | $ 3,364 | 64.6 % | $ 2,409 | 25.4 % | $ 1.50 | |||||||||||
Three months ended April 25, 2025 | |||||||||||||||||
(in millions, except per share data) | Net | Cost of | Gross | Operating | Operating | Income | Net Income | Diluted | Effective | ||||||||
GAAP | $ 8,927 | $ 3,147 | 64.7 % | $ 1,436 | 16.1 % | $ 1,261 | $ 1,057 | $ 0.82 | 15.8 % | ||||||||
Non-GAAP adjustments: | |||||||||||||||||
Amortization of intangible assets(6) | — | — | — | 564 | 6.3 | 564 | 455 | 0.35 | 19.3 | ||||||||
Restructuring and associated costs(2) | — | (2) | — | 149 | 1.7 | 149 | 114 | 0.09 | 23.5 | ||||||||
Acquisition and divestiture-related items(3) | — | (21) | 0.2 | 109 | 1.2 | 109 | 97 | 0.08 | 11.0 | ||||||||
Certain litigation charges, net | — | — | — | 214 | 2.4 | 214 | 163 | 0.13 | 23.4 | ||||||||
(Gain)/loss on minority investments(4) | — | — | — | — | — | 172 | 170 | 0.13 | 0.6 | ||||||||
Medical device regulations(7) | — | (10) | 0.1 | 14 | 0.2 | 14 | 12 | 0.01 | 21.4 | ||||||||
Certain tax adjustments, net | — | — | — | — | — | — | 13 | 0.01 | — | ||||||||
Non-GAAP | $ 8,927 | $ 3,113 | 65.1 % | $ 2,486 | 27.8 % | $ 2,483 | $ 2,080 | $ 1.62 | 16.0 % | ||||||||
See description of non-GAAP financial measures contained in the press release dated June 3, 2026. | |
(1) | The data in this schedule has been intentionally rounded to the nearest million or |
(2) | The charges primarily relate to employee termination benefits, facility related and contract termination costs, and asset write offs. |
(3) | The charges primarily include business combination costs, changes in fair value of contingent consideration, and exit of business-related charges. Exit of business-related charges primarily relate to the impending separation of the Diabetes Business, and for the three months ended April 24, 2026, costs associated with the Company's June 2021 decision to stop the distribution and sale of the Medtronic HVAD System. |
(4) | We exclude unrealized and realized gains and losses on our minority investments as we do not believe that these components of income or expense have a direct correlation to our ongoing or future business operations. |
(5) | The net charges primarily relates to the impact of an intercompany sale of intellectual property, the net tax charge as a result of the separation of the Diabetes Business, and amortization of previously established deferred tax assets arising from intercompany intellectual property transactions. |
(6) | The Company recognized |
(7) | The charges represent incremental costs of complying with the new European Union (E.U.) medical device regulations for previously registered products and primarily include charges for contractors supporting the project and other direct third-party expenses. We consider these costs to be duplicative of previously incurred costs and/or one-time costs. |
MEDTRONIC PLC | |||||||||||||||||
GAAP TO NON-GAAP RECONCILIATIONS(1) | |||||||||||||||||
(Unaudited) | |||||||||||||||||
Fiscal year ended April 24, 2026 | |||||||||||||||||
(in millions, except per share data) | Net | Cost of | Gross | Operating | Operating | Income | Net Income | Diluted | Effective | ||||||||
GAAP | $ 36,364 | $ 12,721 | 65.0 % | $ 6,467 | 17.8 % | $ 6,136 | $ 4,801 | $ 3.73 | 21.2 % | ||||||||
Non-GAAP adjustments: | |||||||||||||||||
Amortization of intangible assets(2) | — | — | — | 1,772 | 4.9 | 1,772 | 1,444 | 1.12 | 18.6 | ||||||||
Restructuring and associated costs(3) | — | (106) | 0.3 | 370 | 1.0 | 370 | 290 | 0.23 | 21.6 | ||||||||
Acquisition and divestiture-related items(4) | — | (27) | — | 173 | 0.5 | 173 | 137 | 0.11 | 21.4 | ||||||||
Certain litigation charges, net | — | — | — | 113 | 0.3 | 113 | 89 | 0.07 | 20.4 | ||||||||
(Gain)/loss on minority investments(5) | — | — | — | — | — | 131 | 130 | 0.10 | — | ||||||||
Other(6) | (39) | — | — | (39) | (0.1) | (39) | (30) | (0.02) | 20.5 | ||||||||
Certain tax adjustments, net(7) | — | — | — | — | — | — | 260 | 0.20 | — | ||||||||
Non-GAAP | $ 36,325 | $ 12,589 | 65.3 % | $ 8,856 | 24.4 % | $ 8,656 | $ 7,120 | $ 5.53 | 17.3 % | ||||||||
Currency impact | (821) | (76) | (0.6) | (262) | (0.2) | (0.15) | |||||||||||
Currency Adjusted | $ 35,504 | $ 12,512 | 64.8 % | $ 8,594 | 24.2 % | $ 5.38 | |||||||||||
Fiscal year ended April 25, 2025 | |||||||||||||||||
(in millions, except per share data) | Net | Cost of | Gross | Operating | Operating | Income | Net Income | Diluted | Effective | ||||||||
GAAP | $ 33,537 | $ 11,632 | 65.3 % | $ 5,955 | 17.8 % | $ 5,628 | $ 4,662 | $ 3.61 | 16.6 % | ||||||||
Non-GAAP adjustments: | |||||||||||||||||
Amortization of intangible assets(2) | — | — | — | 1,807 | 5.3 | 1,807 | 1,471 | 1.14 | 18.5 | ||||||||
Restructuring and associated costs(3) | — | (26) | 0.1 | 303 | 0.9 | 303 | 238 | 0.18 | 21.5 | ||||||||
Acquisition and divestiture-related items(4) | — | (38) | 0.1 | 124 | 0.4 | 124 | 101 | 0.08 | 18.5 | ||||||||
Certain litigation charges, net | — | — | — | 317 | 0.9 | 317 | 249 | 0.19 | 21.5 | ||||||||
(Gain)/loss on minority investments(5) | — | — | — | — | — | 213 | 185 | 0.14 | 12.2 | ||||||||
Medical device regulations(8) | — | (38) | 0.1 | 52 | 0.2 | 52 | 42 | 0.03 | 19.2 | ||||||||
Other(6) | 90 | — | 0.2 | 90 | 0.3 | 90 | 70 | 0.05 | 22.2 | ||||||||
Certain tax adjustments, net(7) | — | — | — | — | — | — | 62 | 0.05 | — | ||||||||
Non-GAAP | $ 33,627 | $ 11,530 | 65.7 % | $ 8,648 | 25.7 % | $ 8,533 | $ 7,079 | $ 5.49 | 16.7 % | ||||||||
See description of non-GAAP financial measures contained in the press release dated June 3, 2026. | |
(1) | The data in this schedule has been intentionally rounded to the nearest million or |
(2) | The Company recognized |
(3) | The charges primarily relate to employee termination benefits, facility related and contract termination costs, and asset write offs. |
(4) | The charges primarily include business combination costs, changes in fair value of contingent consideration, exit of business-related charges, and gains related to certain business or asset sales. Exit of business-related charges primarily relate to the impending separation of the Diabetes Business and costs associated with the Company's June 2021 decision to stop the distribution and sale of the Medtronic HVAD System. |
(5) | We exclude unrealized and realized gains and losses on our minority investments as we do not believe that these components of income or expense have a direct correlation to our ongoing or future business operations. |
(6) | Reflects adjustments to the Company's Italian payback accruals resulting from the two July 22, 2024 rulings by the Constitutional Court and the Legislative Decree published by the Italian government on June 30, 2025 for certain prior years since 2015. |
(7) | The net charges for the fiscal year ended April 24, 2026 primarily relates to the impact of an intercompany sale of intellectual property, the net tax charge as a result of the separation of the Diabetes Business, and amortization of previously established deferred tax assets arising from intercompany intellectual property transactions, which were partially offset by a tax benefit recognized due to a change in estimate of accrued interest on uncertain tax positions. The charges for the fiscal year ended April 25, 2025 primarily includes amortization of previously established deferred tax assets from intercompany intellectual property transactions. |
(8) | The charges represent incremental costs of complying with the new European Union (E.U.) medical device regulations for previously registered products and primarily include charges for contractors supporting the project and other direct third-party expenses. We consider these costs to be duplicative of previously incurred costs and/or one-time costs. |
MEDTRONIC PLC | |||||||||||||||
GAAP TO NON-GAAP RECONCILIATIONS(1) | |||||||||||||||
(Unaudited) | |||||||||||||||
Three months ended April 24, 2026 | |||||||||||||||
(in millions) | Net Sales | SG&A | SG&A | R&D | R&D | Other | Other | Other Non- | |||||||
GAAP | $ 9,807 | $ 3,056 | 31.2 % | $ 671 | 6.8 % | $ 260 | 2.7 % | $ (138) | |||||||
Non-GAAP adjustments: | |||||||||||||||
Acquisition and divestiture-related items(2) | — | (67) | (0.7) | (1) | — | (3) | — | — | |||||||
(Gain)/loss on minority investments(3) | — | — | — | — | — | — | — | 15 | |||||||
Non-GAAP | $ 9,807 | $ 2,989 | 30.5 % | $ 670 | 6.8 % | $ 257 | 2.6 % | $ (123) | |||||||
Fiscal year ended April 24, 2026 | |||||||||||||||
(in millions) | Net Sales | SG&A | SG&A | R&D | R&D | Other | Other | Other Non- | |||||||
GAAP | $ 36,364 | $ 11,784 | 32.4 % | $ 2,873 | 7.9 % | $ 386 | 1.1 % | $ (384) | |||||||
Non-GAAP adjustments: | |||||||||||||||
Restructuring and associated costs(4) | — | (15) | — | — | — | — | — | — | |||||||
Acquisition and divestiture-related items(2) | — | (164) | (0.5) | (1) | — | 18 | — | — | |||||||
Other(5) | (39) | — | — | — | — | — | — | — | |||||||
(Gain)/loss on minority investments(3) | — | — | — | — | — | — | — | (131) | |||||||
Non-GAAP | $ 36,325 | $ 11,605 | 31.9 % | $ 2,872 | 7.9 % | $ 404 | 1.1 % | $ (515) | |||||||
See description of non-GAAP financial measures contained in the press release dated June 3, 2026. | |
(1) | The data in this schedule has been intentionally rounded to the nearest million, and, therefore, may not sum. |
(2) | The charges primarily include business combination costs, changes in fair value of contingent consideration, exit of business-related charges, and for the fiscal year ended April 24, 2026, gains related to certain business or asset sales. Exit of business-related charges primarily relate to the impending separation of the Diabetes Business and costs associated with the Company's June 2021 decision to stop the distribution and sale of the Medtronic HVAD System. |
(3) | We exclude unrealized and realized gains and losses on our minority investments as we do not believe that these components of income or expense have a direct correlation to our ongoing or future business operations. |
(4) | The charges primarily relate to employee termination benefits, facility related and contract termination costs, and asset write offs. |
(5) | Reflects adjustments to the Company's Italian payback accruals resulting from the two July 22, 2024 rulings by the Constitutional Court and the Legislative Decree published by the Italian government on June 30, 2025 for certain prior years since 2015. |
MEDTRONIC PLC | |||||
GAAP TO NON-GAAP RECONCILIATIONS(1) | |||||
(Unaudited) | |||||
Fiscal Year | |||||
(in millions) | 2026 | 2025 | 2024 | ||
Net cash provided by operating activities | $ 7,330 | $ 7,044 | $ 6,787 | ||
Additions to property, plant, and equipment | (1,904) | (1,859) | (1,587) | ||
Free Cash Flow(2) | $ 5,426 | $ 5,185 | $ 5,200 | ||
See description of non-GAAP financial measures contained in the press release dated June 3, 2026. | |
(1) | The data in this schedule has been intentionally rounded to the nearest million, and therefore, may not sum. |
(2) | Free cash flow represents operating cash flows less property, plant, and equipment additions. |
MEDTRONIC PLC | |||||
CONSOLIDATED STATEMENTS OF CASH FLOWS | |||||
(Unaudited) | |||||
Fiscal Year | |||||
(in millions) | 2026 | 2025 | 2024 | ||
Operating Activities: | |||||
Net income | $ 4,837 | $ 4,691 | $ 3,705 | ||
Adjustments to reconcile net income to net cash provided by operating activities: | |||||
Depreciation and amortization | 2,958 | 2,861 | 2,647 | ||
Provision for credit losses | 136 | 123 | 90 | ||
Deferred income taxes | 51 | (316) | (508) | ||
Stock-based compensation | 457 | 429 | 393 | ||
Asset impairments and related inventory write-downs | — | — | 371 | ||
Other, net | 314 | 310 | 573 | ||
Change in operating assets and liabilities, net of acquisitions and divestitures: | |||||
Accounts receivable, net | (200) | (433) | (391) | ||
Inventories | (404) | (292) | (139) | ||
Accounts payable and accrued liabilities | 46 | 209 | 391 | ||
Other operating assets and liabilities | (865) | (538) | (345) | ||
Net cash provided by operating activities | 7,330 | 7,044 | 6,787 | ||
Investing Activities: | |||||
Acquisitions, net of cash acquired | (406) | (98) | (211) | ||
Additions to property, plant, and equipment | (1,904) | (1,859) | (1,587) | ||
Purchases of investments | (8,725) | (8,226) | (7,748) | ||
Sales and maturities of investments | 8,105 | 8,495 | 7,441 | ||
Other investing activities, net | (4) | (249) | (261) | ||
Net cash used in investing activities | (2,934) | (1,937) | (2,366) | ||
Financing Activities: | |||||
Change in current debt obligations, net | 9 | (1,070) | 1,073 | ||
Issuance of long-term debt | 1,747 | 3,209 | — | ||
Payments on long-term debt | (2,930) | — | — | ||
Dividends to shareholders | (3,639) | (3,589) | (3,666) | ||
Issuance of ordinary shares | 516 | 508 | 284 | ||
Repurchase of ordinary shares | (1,035) | (3,235) | (2,138) | ||
Proceeds from MiniMed initial public offering | 538 | — | — | ||
Other financing activities, net | 44 | (184) | (3) | ||
Net cash used in financing activities | (4,751) | (4,361) | (4,450) | ||
Effect of exchange rate changes on cash and cash equivalents | 85 | 188 | (230) | ||
Net change in cash and cash equivalents | (269) | 934 | (259) | ||
Cash and cash equivalents at beginning of period | 2,218 | 1,284 | 1,543 | ||
Cash and cash equivalents at end of period | $ 1,949 | $ 2,218 | $ 1,284 | ||
Supplemental Cash Flow Information | |||||
Cash paid for: | |||||
Income taxes | $ 1,942 | $ 1,819 | $ 1,622 | ||
Interest | 774 | 762 | 826 | ||
The data in this schedule has been intentionally rounded to the nearest million, and, therefore, may not sum. |


 View original content to download multimedia:https://www.prnewswire.com/news-releases/medtronic-reports-fourth-quarter-and-full-year-fiscal-2026-results-delivers-highest-annual-revenue-growth-in-10-years-302789415.html
SOURCE Medtronic plc
FAQ
AI-generated questions and answers. How Rhea-AI works. Not financial advice.