
Realtor.com® Gives America's 87 Million Homeowners a Smarter Way to Manage Their Most Valuable Asset
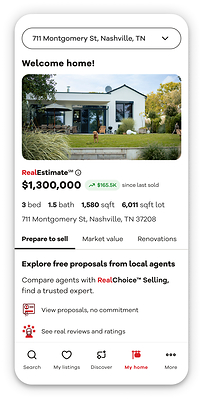
Realtor.com (NASDAQ:NWS) launched a major upgrade to its My Home dashboard on June 9, 2026, creating a centralized hub for America's 87 million homeowners to track and manage their home's financial aspects.
Rhea-AI Summary
Realtor.com (NASDAQ:NWS) launched a major upgrade to its My Home dashboard on June 9, 2026, creating a centralized hub for America's 87 million homeowners to track and manage their home's financial aspects.
New tools include Buyer Demand Signals, Buying Power calculations, and detailed local market intelligence by ZIP code.
Positive
- None.
Negative
- None.
Details
News Market Reaction – NWS
On Jun 9, the day this news came out, NWS closed 0.10% above the previous close.
Data tracked by StockTitan Argus for the Jun 9 session.
Key Figures
- Homeowners addressed
- 87 million
- Number of U.S. homeowners Realtor.com cites as potential My Home users
Historical Context
-
Realtor.com May housing report showing lower prices but stronger buyer activity.
-
Correction noting launch of RealAssist AI home search with Google technology.
-
Announcement of RealAssist AI beta, an AI-first home search experience.
-
Report on shifting international home shopping trends and key metros like Miami.
-
Spring 2026 housing report showing four-year high in contract signings.
24h Move is the share-price change in the day after each event; other market factors may also have contributed.
Key Terms
median listing prices technical
median days on market technical
median price per square foot technical
AI-generated analysis. How Rhea-AI works. Not financial advice.




New buyer demand signals and buying power integration gives homeowners an exclusive intelligence hub to understand, manage, and unlock the full potential of their home.
"Homeownership has always come with big questions, but until now the answers have been scattered across different tools, sites and conversations," said Dave Herman, SVP of Product and AI Innovation at Realtor.com®. "Many people track other major financial assets like retirement accounts, stocks and high-yield savings accounts daily, yet do not track one of their largest financial assets, their homes. My Home brings it all together giving homeowners the financial clarity and local market knowledge to make truly informed decisions in one place."
One Dashboard, Whatever Your Next Move
The questions homeowners face are deeply personal and rarely one-size-fits-all: 'I've owned my home for five years, is now a good time to sell?' 'What could my home earn as a rental?' 'I'm thinking about renovating, where do I start?' My Home is built to meet homeowners wherever they are, providing real data to answer whatever question is on their mind.
Only on Realtor.com®: New Tools to Understand and Act on Your Home
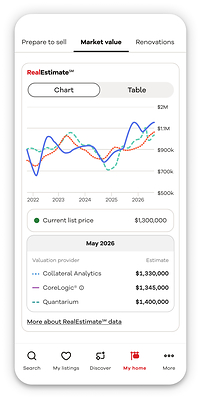
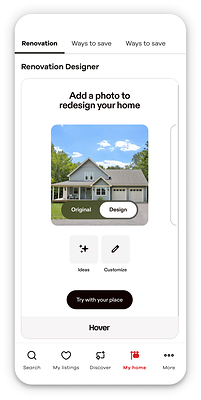
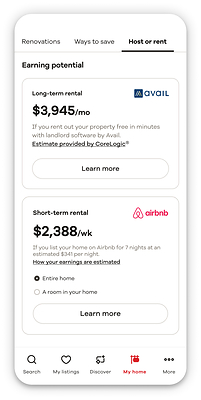
Realtor.com® has been building out the My Home dashboard for years — homeowners already use it to track their RealEstimate℠ Home valuation, explore renovation ideas, and estimate potential earnings from short-term Airbnb rentals or long-term leases via Avail. Now two new features take the experience further, helping homeowners move from simply watching their data to acting on it with confidence:
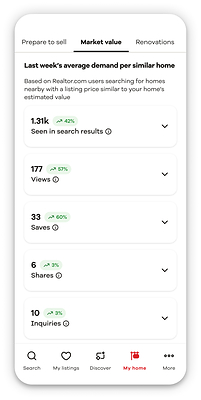
- Buyer Demand Signals: Most homeowners have no idea how much real interest their home could generate. For any claimed home, My Home now surfaces market views, saves, and inquiries on similarly priced nearby homes, giving homeowners a real sense of how their home might perform if listed today.
- Buying Power: Knowing a home's value is only half the equation. Buying Power connects existing equity to what a homeowner can realistically afford next. It factors in a variety of selling costs from repairs and renovations to transfer taxes to show what the next move actually looks like.
Local Intelligence for Local Decisions
Understanding what to do next and acting with confidence also means having a clear understanding of your local market. While national housing headlines often dominate the conversation, real estate is fundamentally local. My Home surfaces the specific, local intelligence homeowners need to make confident decisions about timing and pricing in their own market.
Within the dashboard, homeowners can track:
- Median Listing Prices over time in their specific zip code.
- Median Days on Market to understand how fast inventory is moving.
- Median Price per Square Foot to benchmark their home's value against neighbors.
For those needing deeper analysis, the dashboard links directly to a comprehensive Market Overview for their specific zip code, providing a full breakdown of local inventory and economic trends.
Availability
The relaunched My Home is available today across Realtor.com® desktop, mobile web, iOS, and Android to all homeowners who claim their home on Realtor.com®. Claiming is free and takes minutes.
About Realtor.com®
For over 30 years, Realtor.com® has connected buyers, sellers, and renters with trusted insights, professional guidance and powerful tools to help them find their perfect home. Recognized as the No. 1 real estate site REALTOR® agents recommend, Realtor.com® delivers consumer connections and a robust suite of marketing tools to support business growth. Realtor.com® is operated by News Corp [Nasdaq: NWS, NWSA] [ASX: NWS, NWSLV] subsidiary Move, Inc.
Media contact: Emily Do, press@realtor.com
 View original content to download multimedia:https://www.prnewswire.com/news-releases/realtorcom-gives-americas-87-million-homeowners-a-smarter-way-to-manage-their-most-valuable-asset-302794559.html
SOURCE Realtor.com
FAQ
AI-generated questions and answers. How Rhea-AI works. Not financial advice.