
Most Large U.S. Housing Markets Are Shifting in Buyers' Favor, But the Story Varies Widely by Metro
Realtor.com (NWS) launched the Realtor.com Market Clock on April 9, 2026 to summarize local housing conditions as buyer, seller or balanced markets and their direction.
Rhea-AI Summary
Realtor.com (NWS) launched the Realtor.com Market Clock on April 9, 2026 to summarize local housing conditions as buyer, seller or balanced markets and their direction.
Nationwide the Market Clock sits at 3 o'clock (Balanced-Loosening); 60%+ of top 50 metros are balanced or buyer-friendly, 26% remain seller's markets, and data will be updated quarterly.
Positive
- New Market Clock tool centralizes metro-level housing signals for investors and consumers
- National reading at 3 o'clock signals shifting leverage toward buyers
- Seller markets fell to 26% of top 50 metros by December 2025
- Balanced-loosening category now dominates at 46% of top 50 metros
Negative
- Geographic dispersion: large metros exhibit near-full-clock variation, complicating uniform strategies
- 13 metros remain seller's markets, including peak sellers like Chicago and Hartford
Details
News Market Reaction – NWSA
On Apr 9, the day this news came out, NWSA closed 1.21% below the previous close.
Data tracked by StockTitan Argus for the Apr 9 session.
Key Figures
- Balanced/buyer markets share
- Just over 60%
- Portion of largest U.S. housing markets now balanced or buyer-friendly
- Seller markets share
- 26%
- Share of largest U.S. housing markets still in seller territory
- Seller metros count
- 13 metros
- Top 50 metros classified as seller’s markets in Market Clock
- Balanced-loosening metros
- 23 metros
- Top 50 metros in balanced-loosening phases
- Buyer metros
- 8 metros
- Top 50 metros classified as buyer’s markets
- Balanced-tightening metros
- 6 metros
- Top 50 metros in balanced-tightening territory
- 2019 seller-leaning share
- 72%
- Top 50 metros in seller-leaning phases in December 2019
- 2021 seller-market share
- 98%
- Top 50 metros in seller-market territory in December 2021
Historical Context
-
March 2026 housing data showed softer prices, more listings, and rising risks.
-
Launch of Realtor.com app in ChatGPT with affordability tools and MLS protections.
-
Analysis of renter groups and incomes across 100 metros using ACS and HUD data.
-
Dow Jones Energy hosting World Chemical Forum 2026 for global industry leaders.
-
Report on mobile homes as lower-cost path to ownership and long-term appreciation.
24h Move is the share-price change in the day after each event; other market factors may also have contributed.
AI-generated analysis. How Rhea-AI works. Not financial advice.




Realtor.com® Introduces the Realtor.com® Market Clock, a New Tool That Distills Local Housing Conditions Into a Measure of Whether It's a Buyer, Seller or Balanced Market and Where It's Headed
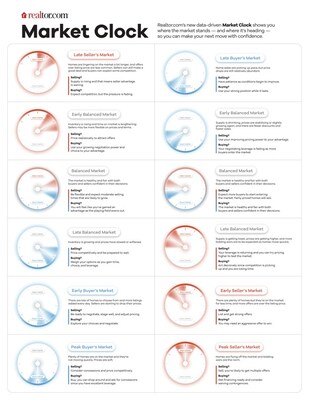
The Realtor.com® Market Clock places the national housing market at 3 o'clock — a "Balanced-Loosening" phase, heading toward buyer-friendly conditions, though not necessarily approaching them quickly. But that national reading masks striking variation across the country's 50 largest metros, which currently span nearly the full face of the clock.
Of the top 50 metros, 13 (
"A national picture is useful, but when making a real estate decision, the local details are what really matter," said Danielle Hale, Chief Economist at Realtor.com®. "Right now, a homebuyer in
A Buyer-Friendly South and West, With Pockets of Seller Strength in the Midwest and Northeast
The regional picture is varied, with all 8 buyer's markets located in the South (7) or West (1). and most of the 13 seller's markets coming from the Midwest (7) and Northeast (3). Of the metros currently classified as buyer's markets, 5 of 8 are in either
By contrast, most seller's markets are concentrated in the Midwest and Northeast. Four markets among the top 50, including
A further 8 of the top 50 markets sit at 4 o'clock, or in the Late Balanced phase of the Market Clock. While these metros – which include
The New Realtor.com® Market Clock
The Realtor.com® Market Clock is a new tool based on key market signals like market balance, market pressure and market pace with the goal of helping people understand their local markets. The market clock is organized as a 12-hour clockface. Seller-leaning conditions occupy the top of the clock (the 11, 12, and 1 o'clock positions), buyer-leaning conditions fall toward the bottom (5, 6, and 7 o'clock), and balanced phases occupy the space in between — with one set loosening toward buyers (2, 3, 4 o'clock) and the other tightening back toward sellers (8, 9, 10 o'clock). At 12 o'clock, conditions favor sellers most: homes sell quickly, competition is fierce, and buyers have limited leverage. At 6 o'clock, the market favors buyers: there's more inventory, less urgency, and more room to negotiate.
The framework is built on metro-level housing data tracking supply and inventory balance, market pace and competition, and pricing pressure and adjustment. Grounded in data, the Realtor.com® Market Clock is built using consistent, metro-level housing market information that tracks conditions over time, allowing markets to be compared both across geographies and across different points in the cycle. Critically, the clock captures not just where a market stands, but how fast and in which direction it is moving — a distinction that matters significantly in markets currently in transition.
"Consumers and professionals are exposed to more information than ever before, but more data hasn't always meant more clarity for people trying to make one of the biggest financial decisions of their lives," said Hale. "The Market Clock is our attempt to change that — to take the full range of signals we track and translate them into something that reflects what the market actually feels like on the ground."
The Realtor.com® Market Clock is designed to describe current conditions and track shifts in leverage over time — not to forecast home prices, sales volumes, or mortgage rates. A market moving into buyer-friendly territory does not guarantee price declines, just as a seller's market does not ensure continued price appreciation.
A Framework Validated by the Last Cycle
The Market Clock's track record from 2019 through 2025 reflects the housing cycle that consumers and industry professionals have lived through. In December 2019, conditions were already tight:
By December 2021, the compression was dramatic. Ninety-eight percent of the top 50 metros had reached seller-market territory — one of the most compressed and competitive environments in modern housing history, with only one metro outside seller territory.
The rate shock of 2022 began to shift conditions, and by December 2023,
How Buyers and Sellers Can Use the Market Clock
For anyone interested in buying and selling now or in the future, the Market Clock is designed to help set expectations. Buyers can use their metro's position to gauge how competitive local conditions are, how quickly they may need to act, and how much negotiating room it is realistic to expect. Sellers can use it to help calibrate pricing strategy and understand whether patience or flexibility is likely to be rewarded in their market.
"Whether you're a first-time buyer trying to figure out how aggressive your offer needs to be, or a seller wondering whether to hold firm on price, the Realtor.com market clock is a much needed solution for today's buyers and sellers," said Jake Krimmel, senior economist, Realtor.com. "It's a professional grade tool that's meant to be simple enough to give non-experts a clear takeaway. And it's best when paired with the advice and guidance of a skilled Realtor® agent when you're ready to move."
The Realtor.com® Market Clock is available as part of Realtor.com® Economics housing market research portal and the report will be updated on a quarterly basis.
Quadrant | Region | Metro | Clock Hour | Hour |
Seller's Markets 13 metros (3 Northeast, 7 | Midwest | 11 | Early Seller | |
Midwest | 11 | Early Seller | ||
Midwest |
| 11 | Early Seller | |
Midwest | 11 | Early Seller | ||
Northeast | 11 | Early Seller | ||
West |
| 11 | Early Seller | |
Midwest |
| 12 | Peak Seller | |
Midwest |
| 12 | Peak Seller | |
Northeast | 12 | Peak Seller | ||
South |
| 12 | Peak Seller | |
Midwest | 1 | Late Seller | ||
Northeast | 1 | Late Seller | ||
West | 1 | Late Seller | ||
Balanced - 23 metros + | South | 2 | Early | |
South |
| 2 | Early | |
West | 2 | Early | ||
West | 2 | Early | ||
West |
| 2 | Early | |
West | 2 | Early | ||
West | 2 | Early | ||
3 | Balanced - | |||
Midwest | 3 | Balanced - | ||
Midwest | 3 | Balanced - | ||
Northeast |
| 3 | Balanced - | |
South | 3 | Balanced - Cooling | ||
South |
| 3 | Balanced - | |
South | 3 | Balanced - | ||
South | 3 | Balanced - | ||
South | 3 | Balanced - | ||
Midwest | 4 | Late | ||
South | 4 | Late | ||
South |
| 4 | Late | |
South | 4 | Late | ||
South | 4 | Late | ||
South |
| 4 | Late | |
West |
| 4 | Late | |
West | 4 | Late | ||
Buyer's Markets 8 metros (0 Northeast, 0 | South |
| 5 | Early Buyer |
South | 5 | Early Buyer | ||
South | 5 | Early Buyer | ||
South |
| 5 | Early Buyer | |
South | 5 | Early Buyer | ||
South | 5 | Early Buyer | ||
South |
| 5 | Early Buyer | |
West |
| 5 | Early Buyer | |
Balanced - 6 metros (3 Northeast, 1 | Midwest |
| 9 | Balanced - |
Northeast |
| 9 | Balanced - | |
Northeast | Buffalo-Cheektowaga-Niagara | 10 | Late | |
Northeast | 10 | Late | ||
West |
| 10 | Late Balanced | |
West | 10 | Late |
Methodology
The Realtor.com® Market Clock is built on Realtor.com® housing market data and analysis of deed records to classify the top 50 U.S. metropolitan areas and a national aggregate into one of 12 phases of the buyer-seller leverage cycle. The framework synthesizes measures of market balance, pace and momentum, and pricing pressure into a single clock position for each metro. Data will be updated monthly and a report released quarterly. Data span January 2018 through December 2025. The 50 largest
About Realtor.com®
Realtor.com® pioneered online real estate and has been at the forefront for over 25 years, connecting buyers, sellers, and renters with trusted insights, professional guidance and powerful tools to help them find their perfect home. Recognized as the No. 1 site trusted by real estate professionals, Realtor.com® is a valued partner, delivering consumer connections and a robust suite of marketing tools to support business growth. Realtor.com® is operated by News Corp [Nasdaq: NWS, NWSA] [ASX: NWS, NWSLV] subsidiary Move, Inc.
Media contact: Mallory Micetich, press@realtor.com
 View original content to download multimedia:https://www.prnewswire.com/news-releases/most-large-us-housing-markets-are-shifting-in-buyers-favor-but-the-story-varies-widely-by-metro-302737408.html
SOURCE Realtor.com
FAQ
AI-generated questions and answers. How Rhea-AI works. Not financial advice.