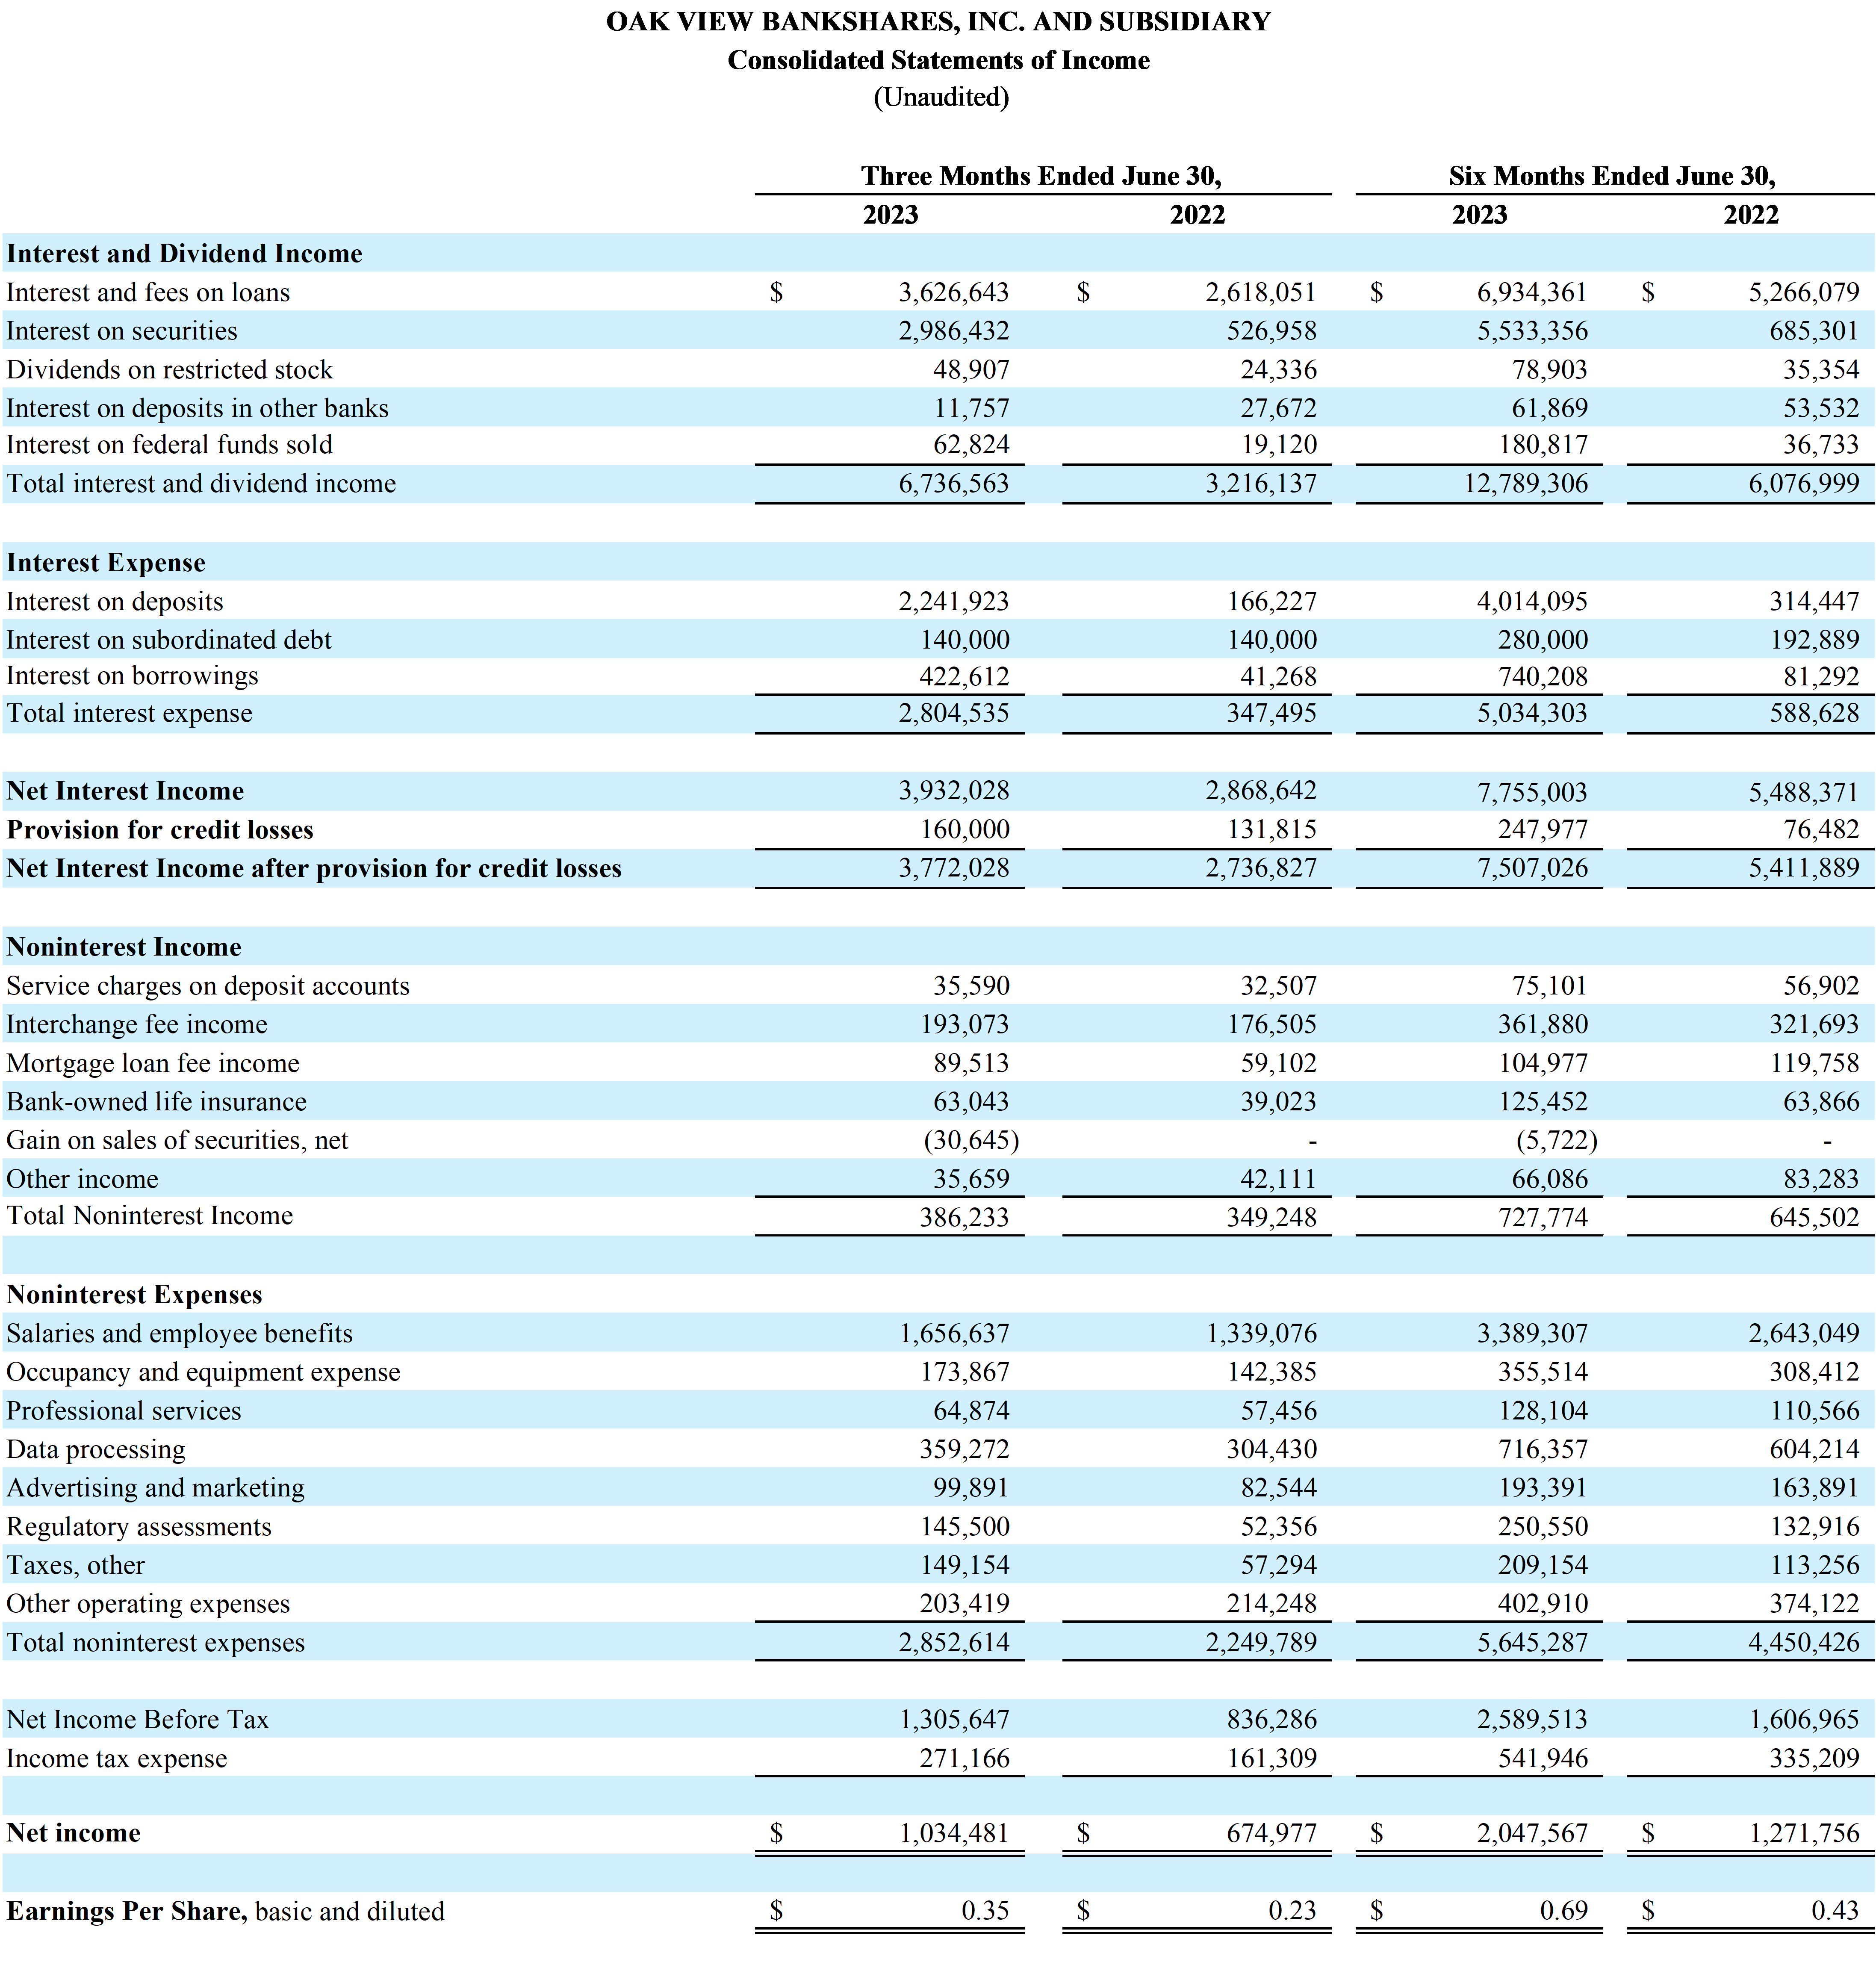
WARRENTON, VA / ACCESSWIRE / July 21, 2023 / Oak View Bankshares, Inc. (the "Company") (OTC Pink:OAKV), parent company of Oak View National Bank (the "Bank"), reported net income of $1.03 million for the quarter ended June 30, 2023, compared to net income of $674,977 for the quarter ended June 30, 2022, an increase of 53.26%. Basic and diluted earnings per share for the second quarter were $0.35 compared to $0.23 per share for the second quarter of 2022.
Net income for the six months ended June 30, 2023, was $2.05 million, compared to $1.27 million for the six months ended June 30, 2022, an increase of 61.00%. Basic and diluted earnings per share for the six months ended June 30, 2023, were $0.69 compared to $0.43 for the six months ended June 30, 2022.
Selected Highlights:
Return on average assets was 0.76% and return on average equity was 14.33% for the quarter ended June 30, 2023, compared to 0.70% and 9.83%, respectively, for the quarter ended June 30, 2022. Return on average assets was 0.77% and return on average equity was 14.44% for the six months ended June 30, 2023, compared to 0.68% and 9.63%, respectively, for the six months ended June 30, 2022.
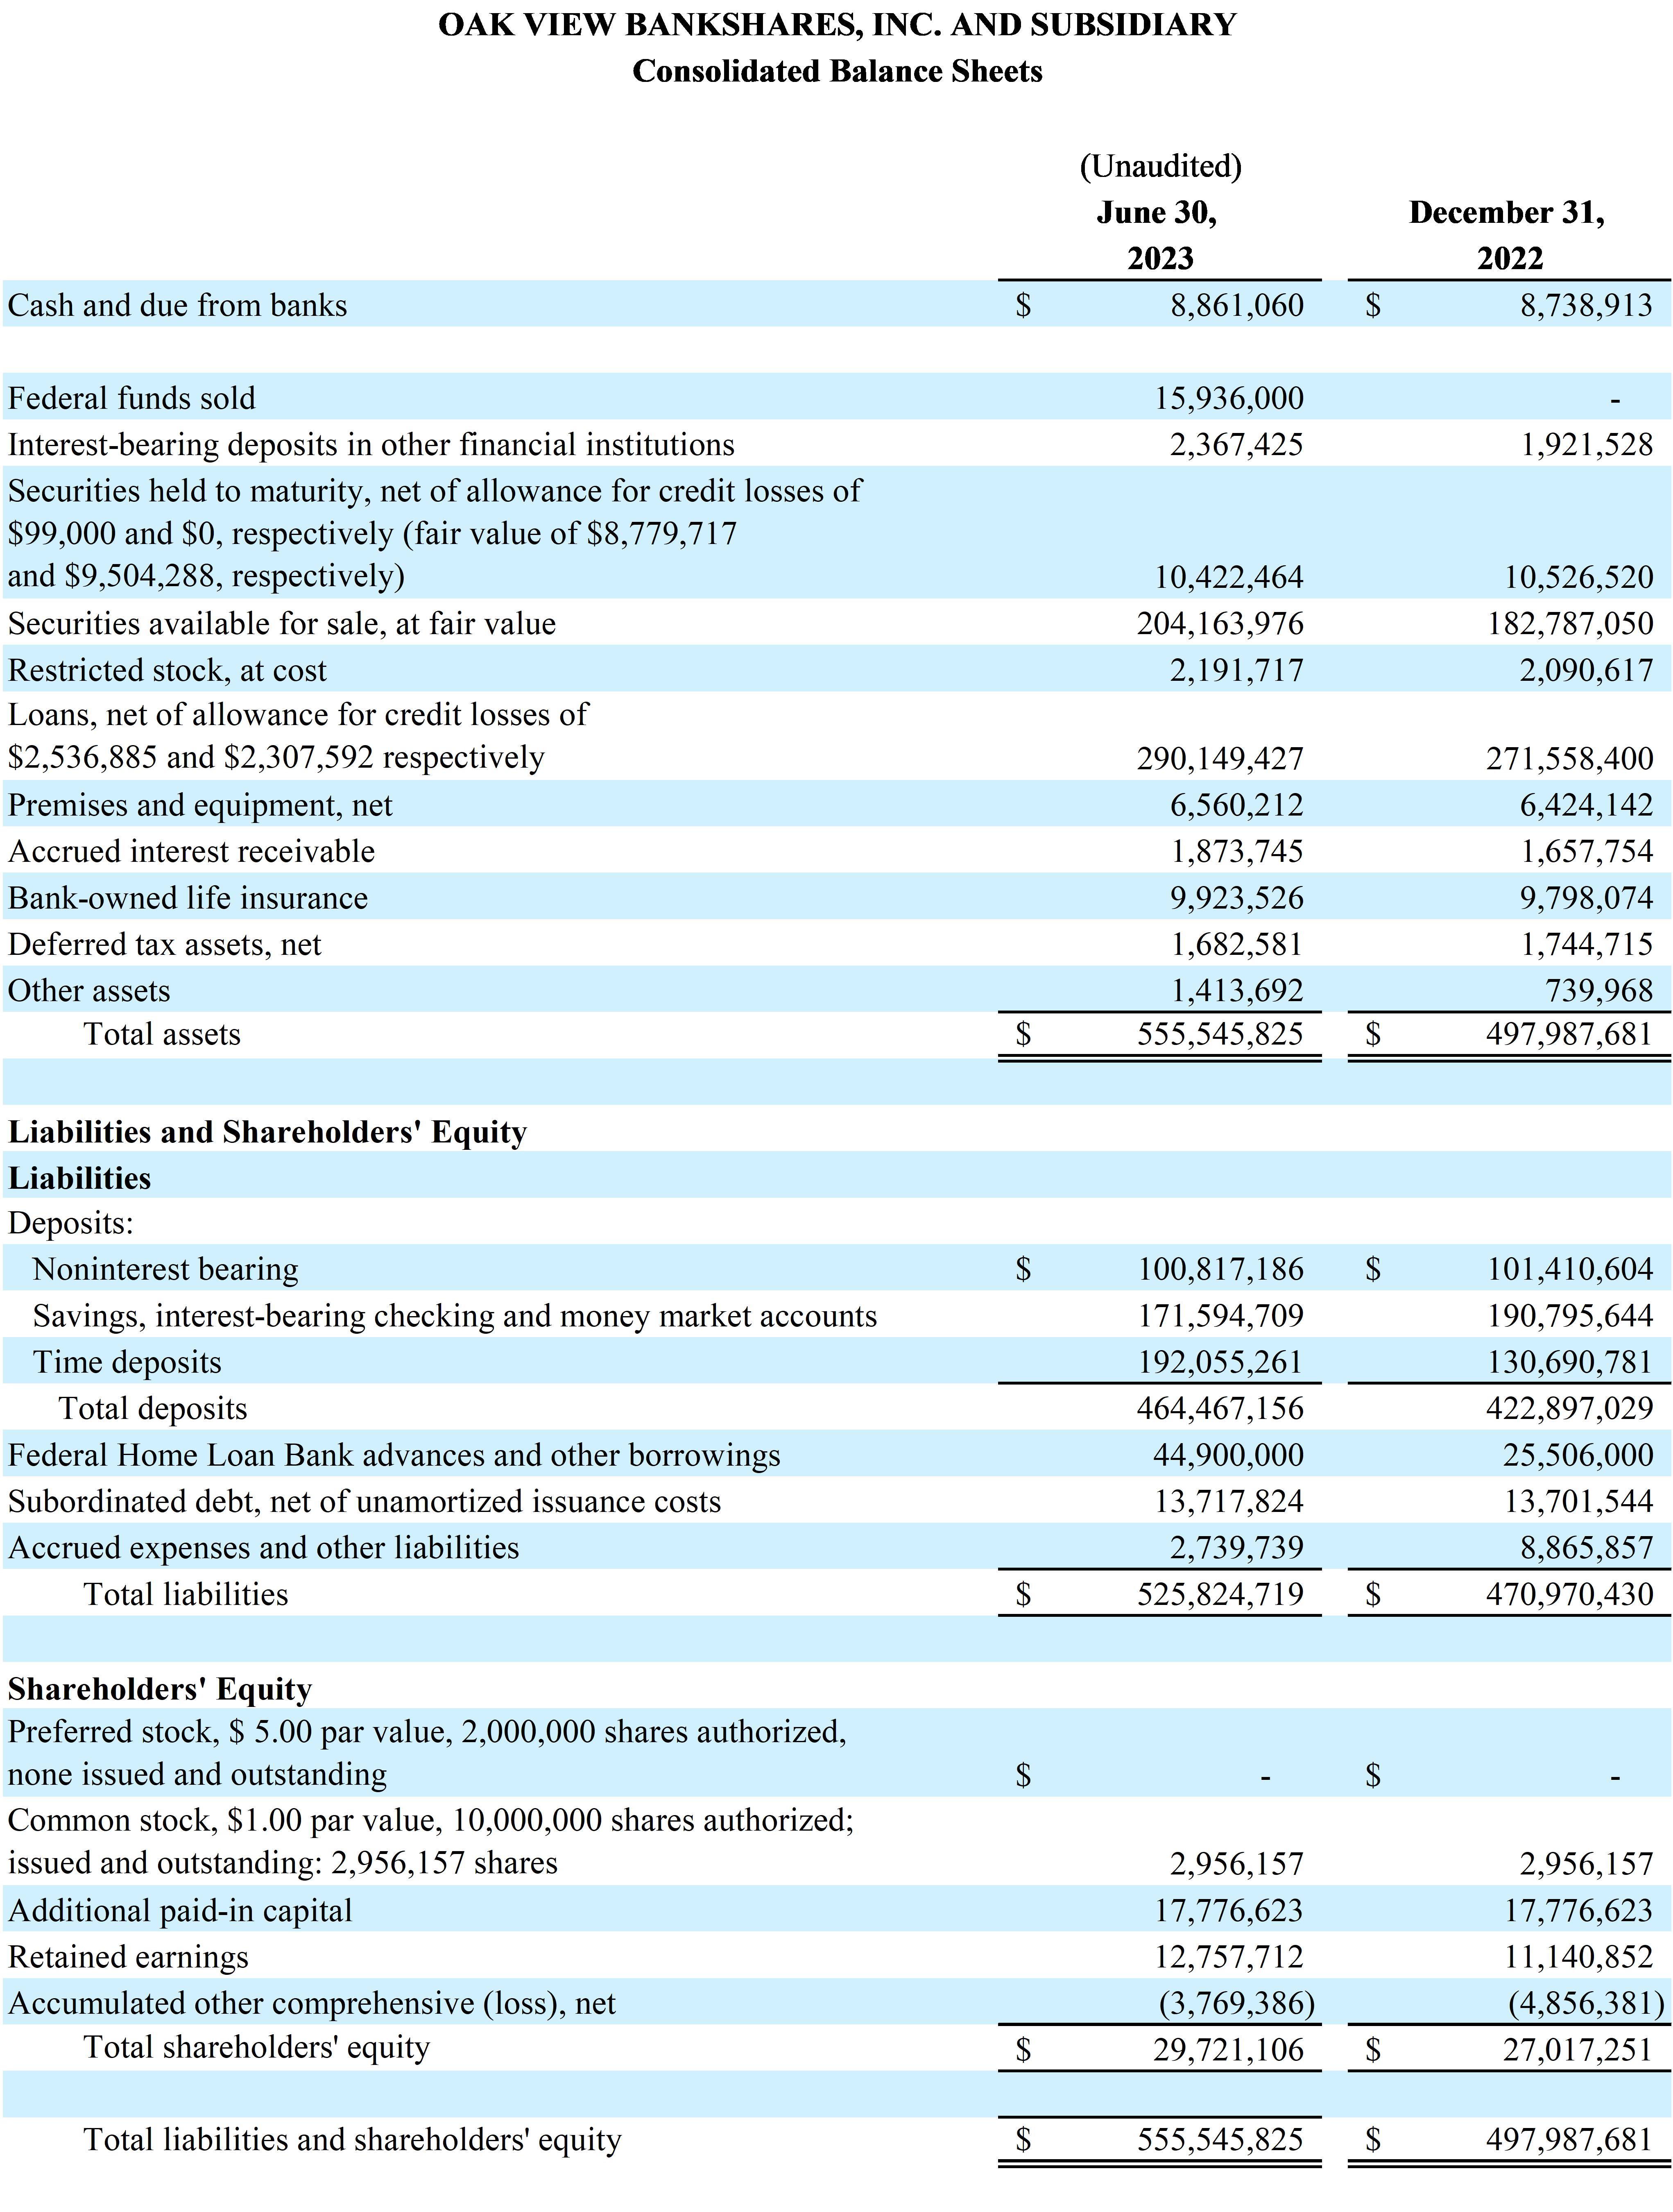
Total assets were $555.55 million on June 30, 2023, compared to $497.99 million on December 31, 2022.
Total loans were $292.69 million on June 30, 2023, compared to $273.87 million on December 31, 2022.
Total securities were $214.59 million on June 30, 2023, compared to $193.31 million on December 31, 2022.
Total deposits were $464.47 million on June 30, 2023, compared to $422.90 million on December 31, 2022.
Asset quality remains strong with no nonperforming loans or past due loans as of June 30, 2023.
Regulatory capital remains strong with ratios exceeding the "well capitalized" thresholds in all categories.
Liquidity remains strong at $434.99 million as of June 30, 2023, compared to $379.25 million as of December 31, 2022. Liquidity includes cash, unencumbered securities available for sale, and available secured borrowing capacity.
Michael Ewing, Chairman of the Board and CEO said, "We are very pleased to report an increase in earnings per share of 52.17% on a quarter-over-quarter basis and 60.47% on a year-over-year basis. Core deposits increased $31.76 million since year-end 2022 as we continue to benefit from the dislocation in the industry. We have deployed these proceeds into earning assets with attractive risk/return characteristics. This disciplined approach has contributed to higher levels of earnings for the quarter and year-to-date."
Mr. Ewing concluded, "We strongly believe that community banks build better communities. In doing so, we manage the Company to seek the optimal balance among safety and soundness, profitability, and growth - in that order. As we continue this journey, we will maintain these straightforward principles which we believe will give us the strength to meet the financial needs of our customers, support our communities and optimize value for our shareholders."
Net Interest Income
The net interest margin was 2.99% for the quarter ended June 30, 2023, compared to 3.13% for the quarter ended June 30, 2022. The net interest margin was 3.04% and 3.12% for the six months ended June 30, 2023, and 2022, respectively.
Interest income increased $3.52 million and $6.71 million for the quarter and six months ended June 30, 2023, respectively, as a result of increased investment opportunities to deploy capital into investments with attractive risk and return characteristics and increased loan income due primarily to the higher interest rate environment.
Interest expense increased $2.46 million and $4.45 million for the quarter and six months ended June 30, 2023, respectively. Increases in interest expense are primarily attributable to interest expense related to the issuance of subordinated debt in February 2022, interest expense paid on deposits resulting from increases in volume and in interest rates, and interest expense paid on FHLB advances and other borrowings due to higher balances needed to deploy capital into higher yielding investment opportunities.
Noninterest Income
Noninterest income was $386,233 and $727,774 for the quarter and six months ended June 30, 2023, respectively. Debit card interchange fee income was the largest contributor of noninterest income totaling $193,073 and $361,880, for the quarter and six months ended June 30, 2023, respectively.
Noninterest Expense
Noninterest expense was $2.85 million and $5.65 million for the quarter and six months ended June 30, 2023, respectively.
Salaries and employee benefits were the largest category of noninterest expense, which totaled $1.66 million and $3.39 million for the quarter and six months ended June 30, 2023, respectively. Salaries and employee benefits increased as a result of newly added positions, an overall increase in employee benefits, including health insurance premiums and the increase in quarterly incentive compensation paid to all employees as a result of the Company's exceptional financial performance.
Liquidity
The Company's liquidity position was very strong with $434.99 million of liquid assets available which included cash, unencumbered securities available for sale, and secured borrowing capacity as of June 30, 2023, compared to $379.25 million as of December 31, 2022.
The Company is in a very strong position regarding the liquidity concerns facing the banking industry, caused by the ability of large depositors to withdraw deposit balances that exceed the FDIC insurance limits. The Company had "uninsured" deposits of $90.84 million and $102.34 million, representing 19.56% and 24.02% of total deposits, as of June 30, 2023, and December 31, 2022, respectively, well within industry averages.
The Company's deposits proved to be stable with core deposits totaling $433.51 million as of June 30, 2023, compared to $401.75 million as of December 31, 2022, an increase of $31.76 million.
Asset Quality
The Company adopted the recent accounting pronouncement for current expected credit losses ("CECL"), effective January 1, 2023. Prior to CECL's effective date, the Company accounted for the allowance for loan losses under the incurred loss model.
As of June 30, 2023, the allowance for credit losses related to the loan portfolio was $2.54 million or 0.87% of outstanding loans,net of unearned income, compared to $2.31 million or 0.84% of outstanding loans, net of unearned income, on December 31, 2022. As of June 30, 2023, the Company had no nonperforming loans or past due loans compared to one loan 90 or more days past due and still accruing interest, which totaled $18,345 as of December 31, 2022. The Company originated this loan under the Small Business Administration ("SBA") Paycheck Protection Program and received payment during the second quarter of 2023.
Shareholders' Equity
Shareholders' equity was $29.72 million on June 30, 2023, compared to $27.02 million on December 31, 2022. Accumulated Other Comprehensive Loss improved $1.09 million to $3.77 million as of June 30, 2023, compared to $4.86 million as of December 31, 2022, and is primarily related to unrealized losses in the available-for-sale securities portfolio which are attributable to mark-to-market adjustments resulting from rising interest rates.
About Oak View Bankshares, Inc. and Oak View National Bank
Oak View Bankshares, Inc. is the parent bank holding company for Oak View National Bank, a locally owned and managed community bank serving Fauquier, Culpeper, Rappahannock, and surrounding Counties. For more information about Oak View Bankshares, Inc. and Oak View National Bank, please visit our website at www.oakviewbank.com. Member FDIC.
For additional information, contact Tammy Frazier, Executive Vice President & Chief Financial Officer, Oak View Bankshares, Inc., at 540.359.7155.